性能数据分析
前端性能监控支持您对下列数据进行分析:
类型 | 功能说明 |
页面性能 | 包括首屏渲染时间、LCP、DNS 查询耗时、 TCP 连接耗时、请求响应耗时、内容传输耗时、DOM 解析耗时、资源加载耗时 、SSL 建连耗时等页面性能指标。 |
日志查询 | 包括历史日志、页面访问日志、自定义事件日志和离线日志查询。 |
异常分析 | JS 错误、Promise 错误、Ajax 请求异常、JS 加载异常、接口返回码异常等异常情况。 |
页面访问 | 页面访问用于展示页面访问量情况(UV、PV ) ,并支持多维度分析页面访问情况。 |
API 监控 | HTTP Code 成功率、Retcode 成功率、API 请求耗时等调用情况监控。 |
静态资源 | 前端 HTML 页面中主要包含的静态资源有:JS 文件、CSS 文件和图片文件,若这些文件加载耗时较长、失败等,将直接对页面造成影响甚至瘫痪。 |
自定义事件 | |
自定义测速 |
说明:
LCP:从用户请求网址到在可视窗口中渲染最大可见内容元素所需的时间。
前提条件
操作说明
总览视图分析
展示页面性能关键指标变化趋势图。
单击上方的图例可取消或展示对应的数据。-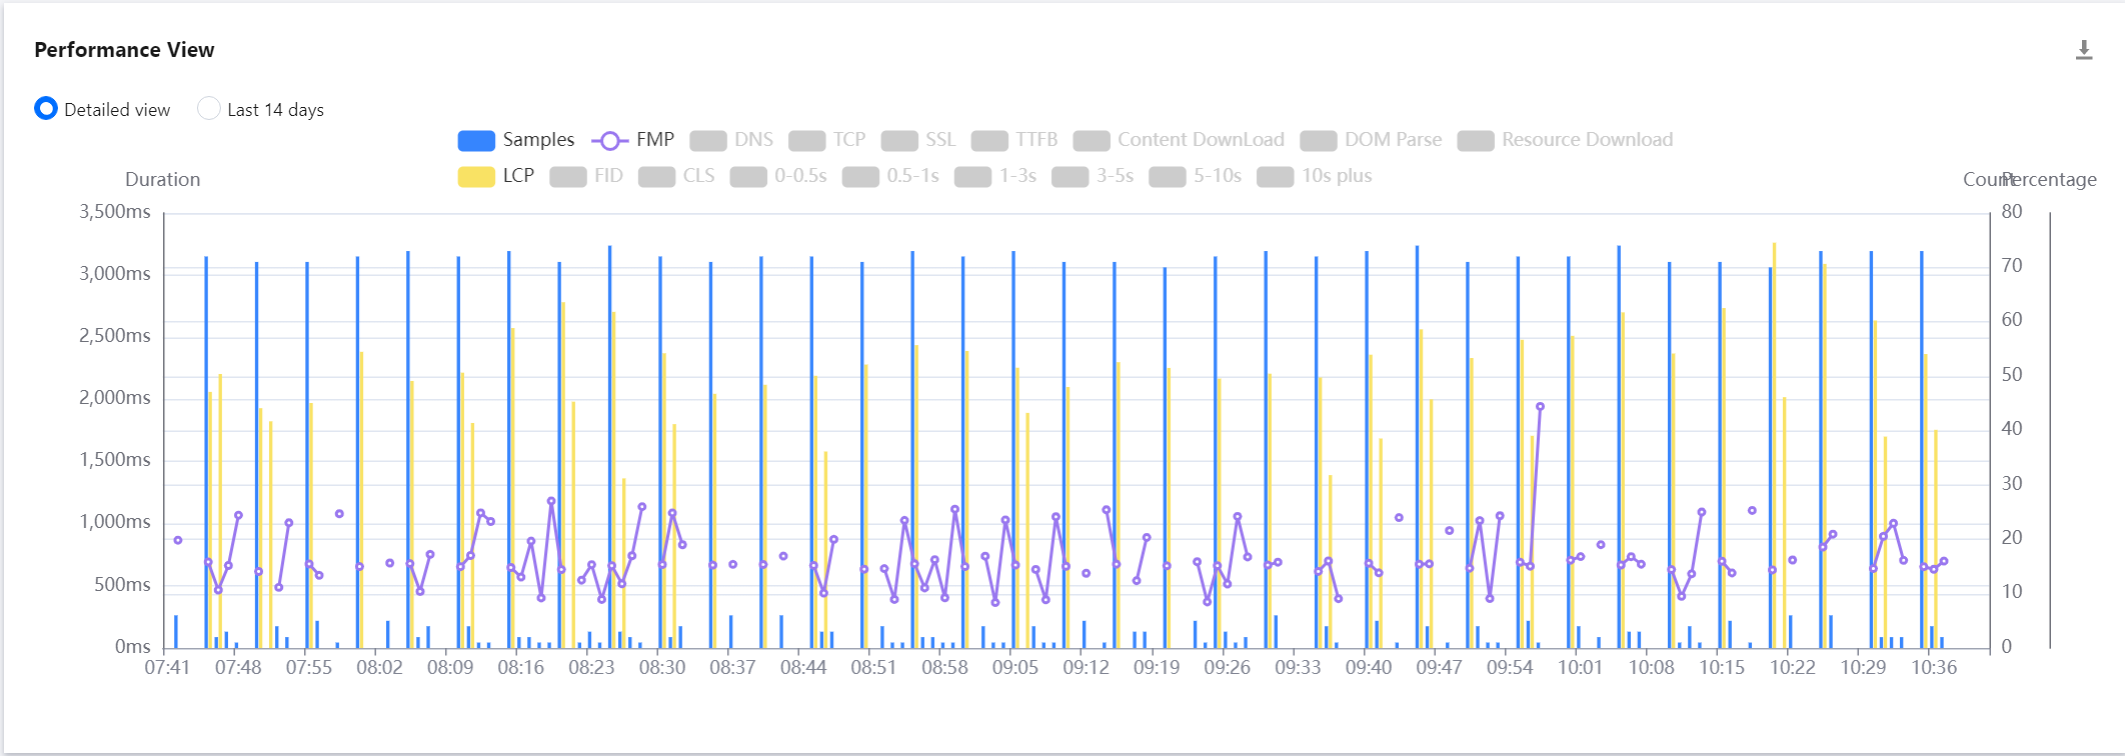
支持按时间段或近14天粒度展示变化趋势图。
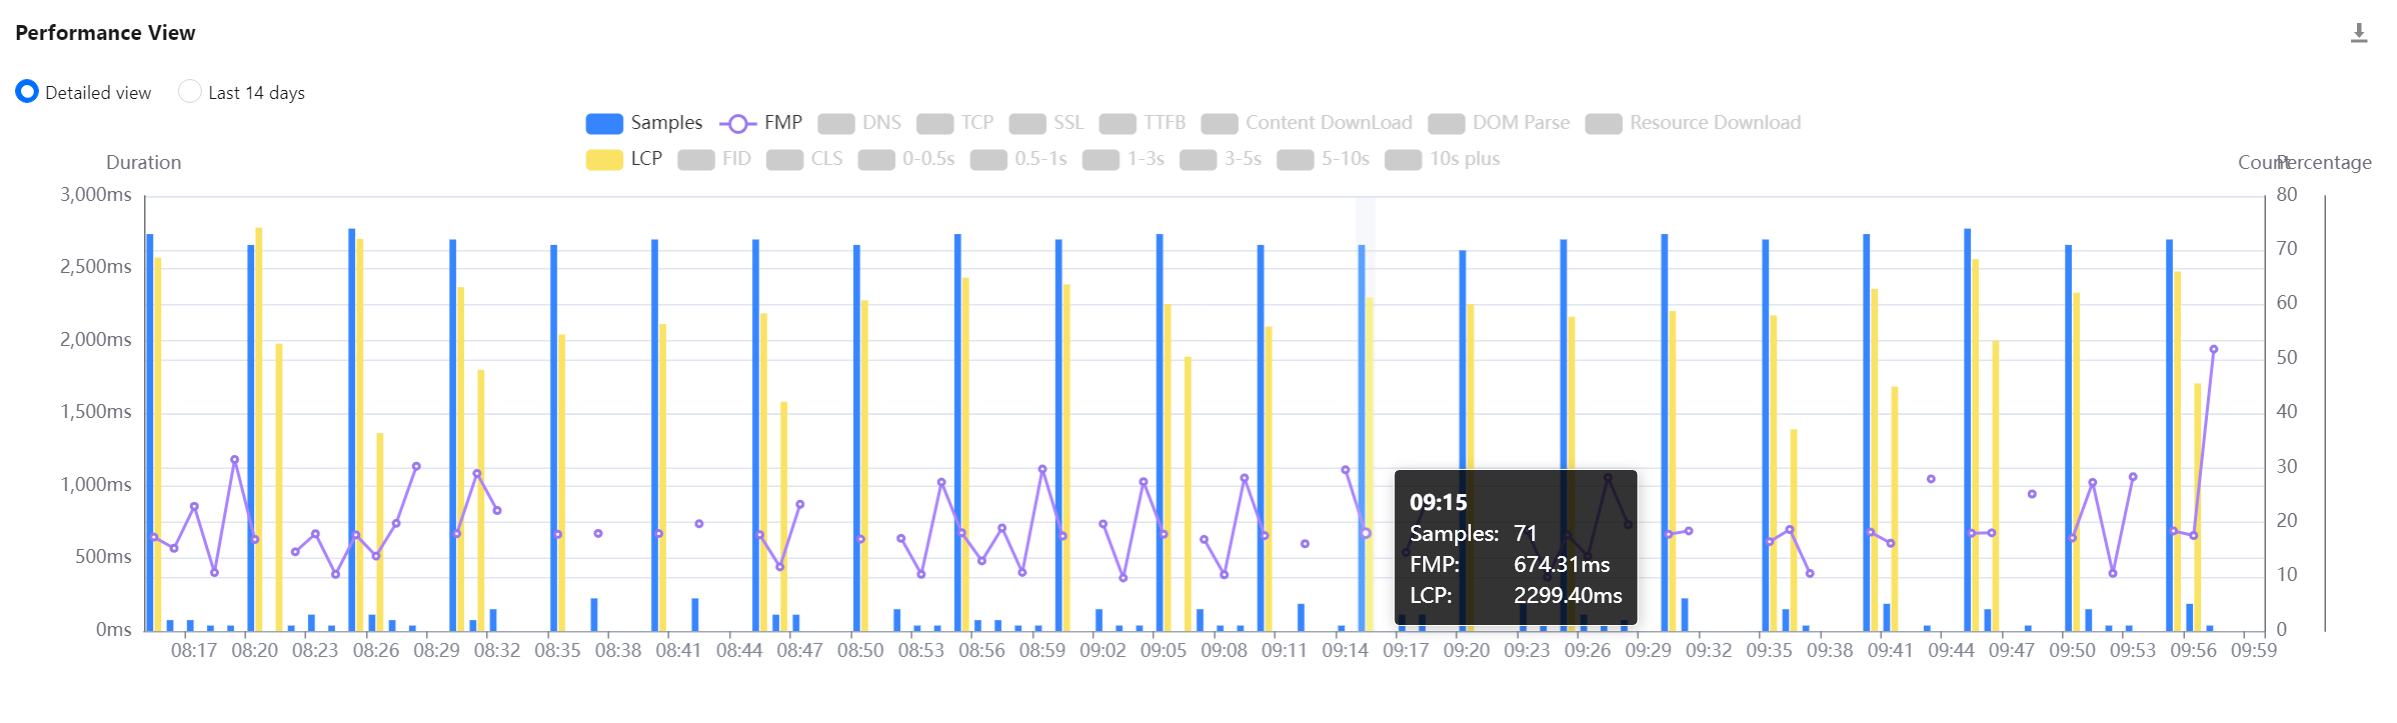
在曲线中拖动鼠标可展示某一时刻首屏渲染时间。
把鼠标移动到图表中,并向上滑动鼠标可缩小图表时间跨度,向下滑动鼠标可放大图表时间跨度。
自定义视图选择
您可以在在页面顶部,勾选需要展示的视图。
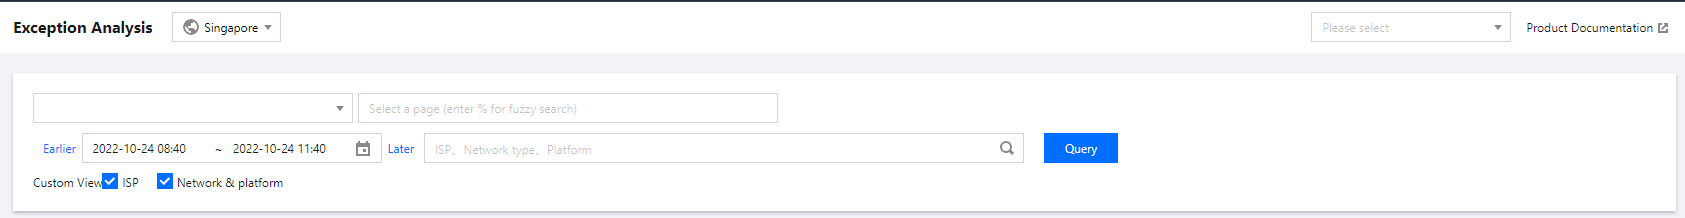
勾选后页面底部将会根据各维度展示前端性能数据情况,方便您从各维度分析前端性能数据。您还可以
其它视图
视图名称 | 说明 |
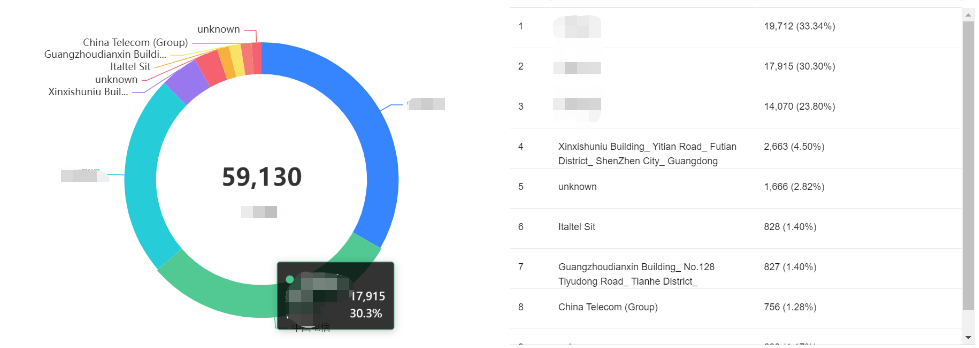
网络/平台视图 | 用饼图形式展示来自各区域的异常数量、占比及首屏时间 。其中网络包括3G、4G、WIFI 等,平台包括 Macos、Windows、IOS 等。 |
ISP 视图 | 用饼图形式展示来自各运营商的异常数量、占比及首屏时间。运营商包括移动,电信、联通等。 |
地区视图 | 用饼图形式展示来自各区域的异常数量、占比及首屏时间。 |
品牌/机型视图 | 用饼图形式展示来自手机品牌/机型的异常数量、占比及首屏时间。 |
浏览器视图 | 用饼图形式展示来自各浏览器的异常数量、占比及首屏时间。 |
Version 视图 | 用饼图形式展示来自各应用版本的异常数量、占比及首屏时间。您可以通过在接入应用时的 new Aegis 传入 version 来自定义研发相关的版本信息,默认使用 SDK 的版本。 |
Ext1 视图、Ext2 视图、Ext3 视图 |
文档反馈