Developing SQL Jobs
Download
Focus Mode
Font Size
Prerequisites
A Stream Compute Service (SCS) job needs to run on a dedicated SCS cluster. If you do not have a cluster, see Creating a Private Cluster.
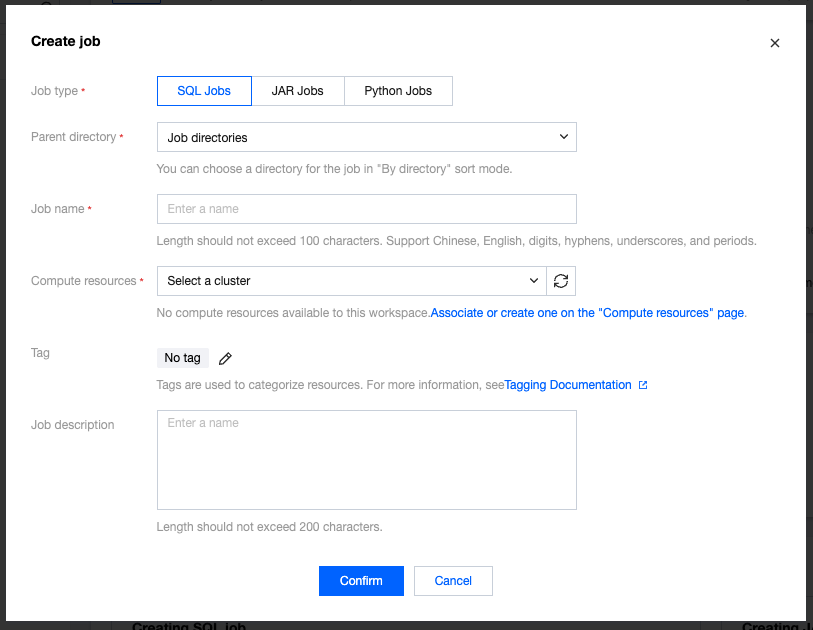
Creating a Job
In the SCS console, select Job Management > Create > Create Jobs, select the job type, job name, and running cluster in the pop-up window, then click OK to see the newly created job in the job list.
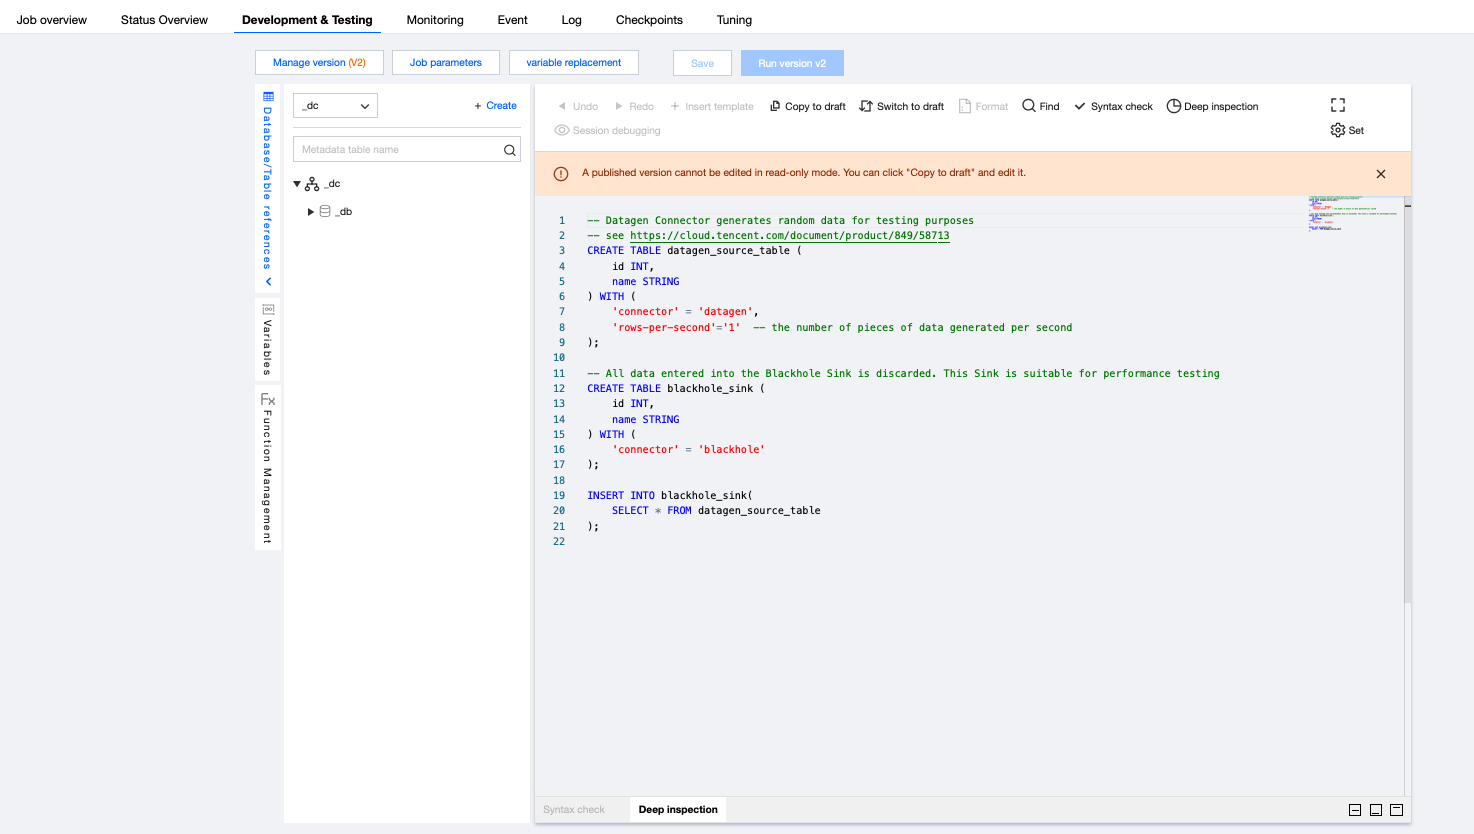
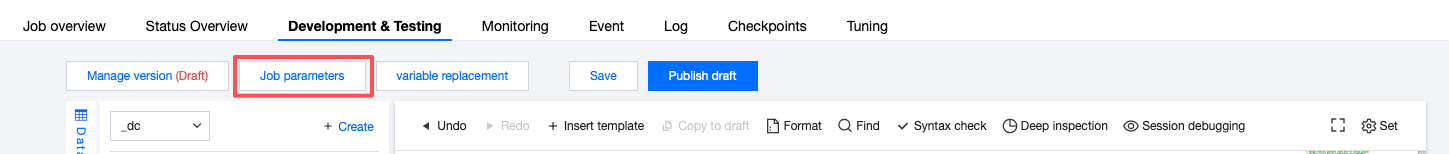
After creating an SQL job, click the name of the job to develop in Job Management, then click Development and Debugging to start development in draft status. The "(Draft)" after Version Management (Draft) indicates the job is currently in editable draft status.
Writing and Debugging SQL
To develop an SQL job, input SQL analysis statements in the SQL editor. Click Insert Template to quickly add commonly used data flow definition statements such as Ckafka or JDBC. Click Database and Table Reference to conveniently reference tables, as well as view and edit DDL statements. After editing the SQL statements, click Job Parameters to set parameter values in the pop-up parameter interface on the right side of the page. For details, see Job Parameters. Then click Save to save the SQL statements and job parameters.
Job Parameters
You can set job parameters on the Development and Debugging page by clicking Job Parameters and configuring values in the pop-up parameter interface on the side, then clicking OK to save job parameter information. The following context provides more details for each parameter to help you better configure job parameters.
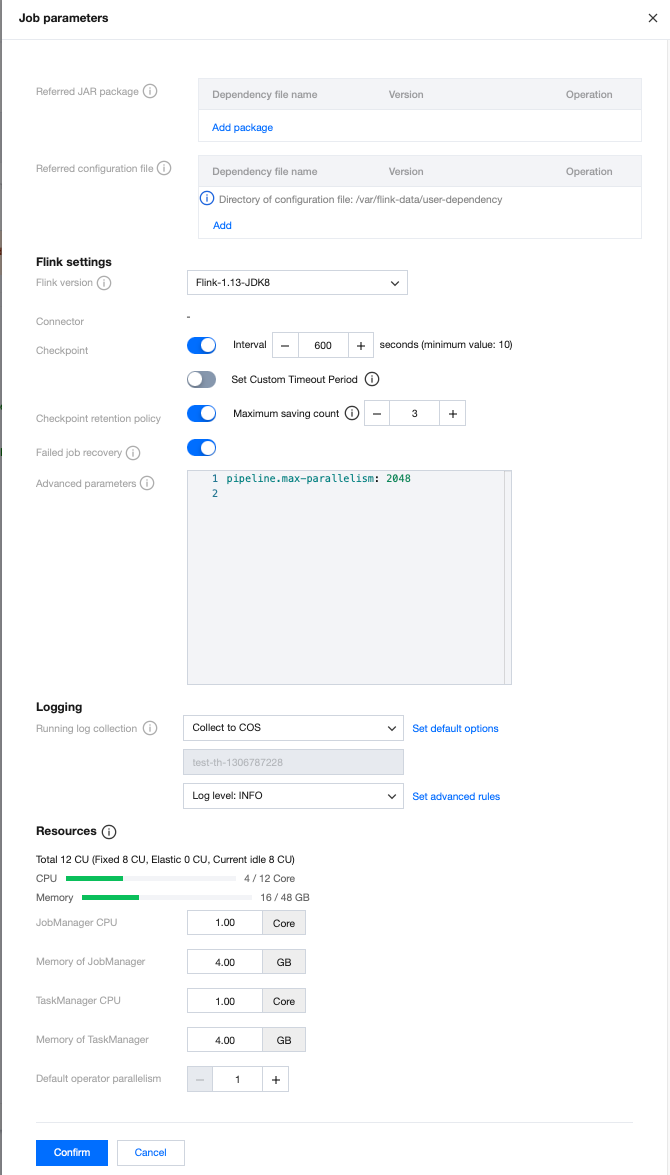
Referencing Packages
If the built-in functions provided in the SQL Developer Guide do not meet the requirements, you can develop your own custom functions and upload them as JAR packages in Managing Dependencies, in order to add referenced packages here and select a version. For program package upload and version management, see Managing Dependencies.
Checkpoint
Checkpoint is a job snapshot. After enabling Checkpoints, the job will automatically save snapshots at the set time interval for job recovery upon failure. The Checkpoint time interval can be set within the range of 30 seconds to 3,600 seconds.
Running Log Collection
Display the running log collection settings of the current job, collecting to the default cluster-bound log service by default. The running logs of the job will be automatically collected into the logset and log topic bound to the cluster of the job, and can be viewed on the Logs page.
Advanced Parameters
Some Flink advanced parameters can be customized. You can configure them in YML syntax using "key: value" format. For details, see Advanced Job Parameters.
Specifications Configurations
You can configure the specification size of JobManager and TaskManager as needed to utilize resources flexibly. For details, see Configuring Job Resources.
Default Operator Parallelism
When the operator parallelism is not explicitly defined in code in the JAR package, the job will use the default operator parallelism specified by the user. The parallelism and TaskManager specification size together determine the computing resources occupied by the job. A parallelism of 1 consumes computing resources measured in CUs, where the amount of CU is defined based on one TaskManager's specification size (when the TaskManager specification size is 1, a parallelism of 1 consumes 1 CU of computing resources. When the TaskManager specification size is 0.5, a parallelism of 1 consumes 0.5 CU of computing resources).
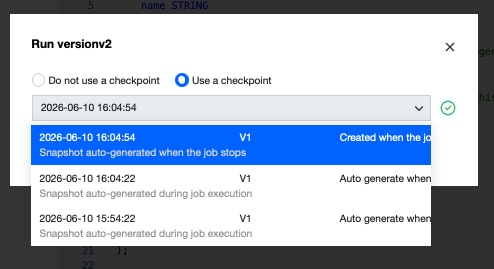
Restoring Jobs from Snapshots
During job running, you can restore from a historical snapshot. When running a job, the prompt is as follows:
Jobs with no historical snapshots cannot run with historical snapshots.
Syntax Check
After writing and saving the SQL statements, perform a syntax check to avoid running failure due to syntax errors. Click Syntax Check at the top of the SQL editor to check the saved SQL statements. If the syntax is correct, the "Syntax check passed" message will appear at the top right corner of the page. If there are syntax errors, the errors will be prompted. Modify as prompted until the syntax check passes.
Deep Check
After writing and saving the SQL statement, perform a deep check to avoid execution failure due to syntax errors. Click Deep Check at the top of the SQL editor to perform a deep syntax check on the saved SQL statements. Deep check checks the syntax and the dependent connector packages.
Session Debugging
Debugging in this mode is currently only supported for Flink version 1.13 and Flink version 1.16, and only draft versions of the jobs can be debugged.
Click Session Debugging in the top right corner of the SQL editor to open the debug preview interface.

If the cluster does not enable session cluster, you are not able to perform session debugging. Go to the details page of the dedicated cluster to enable session cluster.
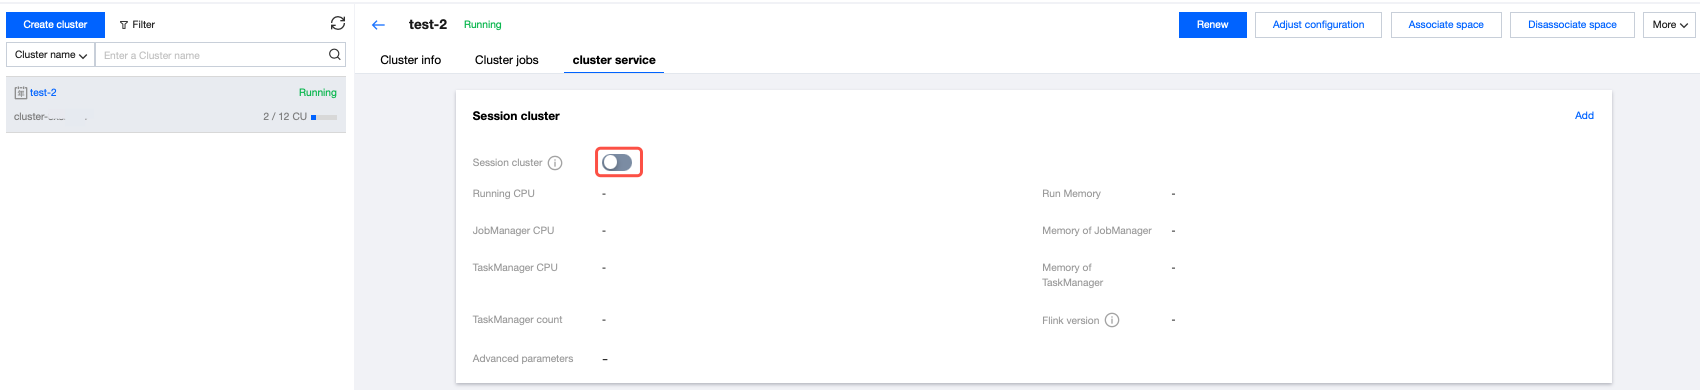
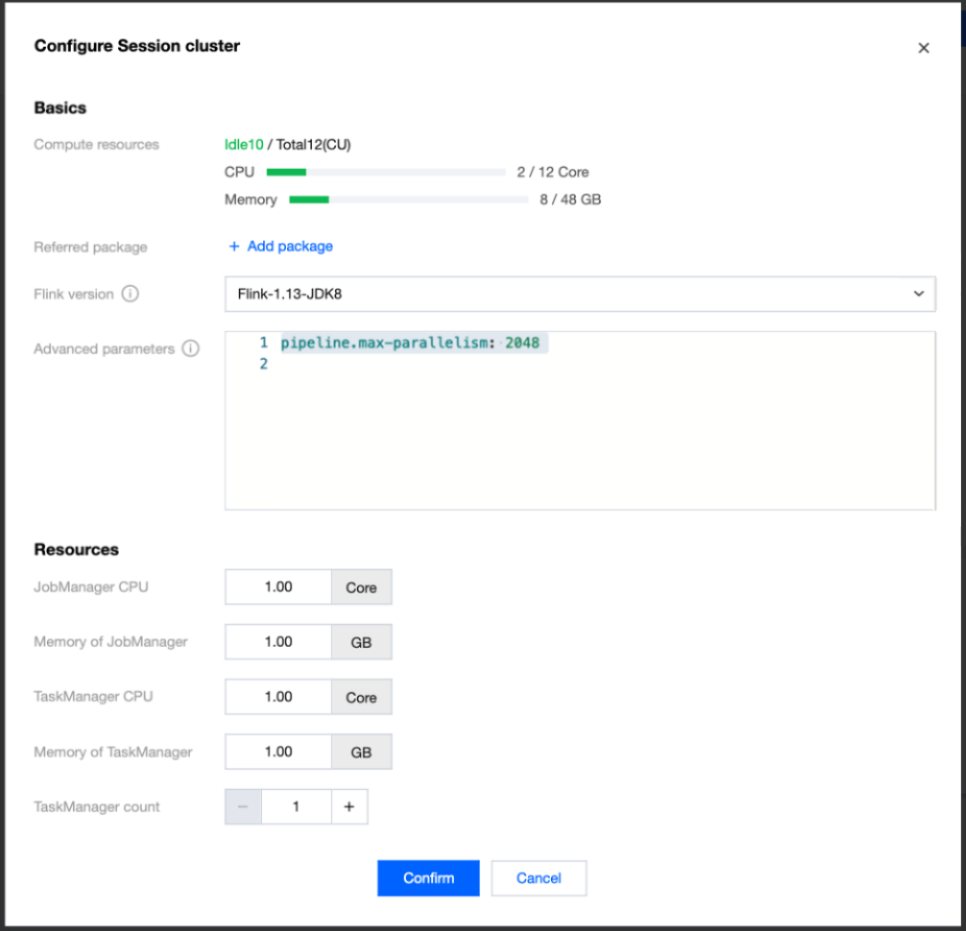
Click the button to enable session cluster, where you can set advanced parameters at the startup of the session cluster, JobManager specifications, TaskManager specifications, and the number of TaskManagers to start:
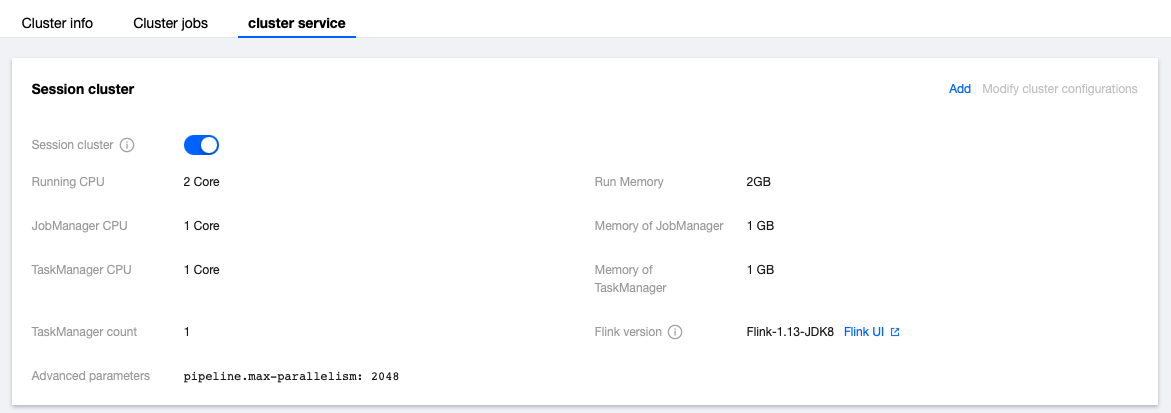
Session cluster startup information is also displayed on the cluster details page. You can click Flink UI to enter the Flink UI interface of the session cluster. The Flink UI password is the same as the password for the user's independent cluster:
To modify session cluster parameters, click the switch button to stop the session cluster first. Then, click the Modify Cluster Configurations button in the upper right corner to modify parameters. After modification, click OK, and the session cluster will automatically start and take effect.
By default, clicking the Session Debugging feature will debug the entire SQL job. The generated debug preview window content is the entire SQL job.
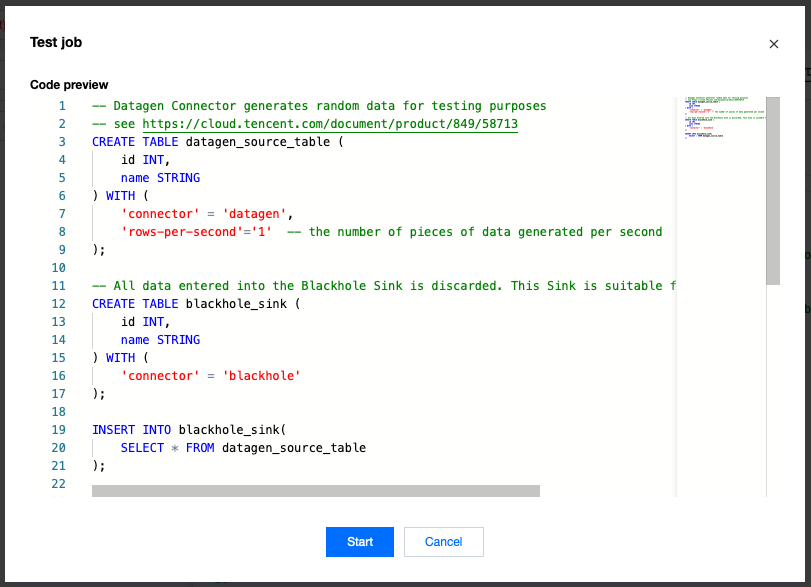
The Session Debugging feature also supports debugging part of the code. You can select part of the SQL code before clicking Session Debugging, then the preview window will display as follows:
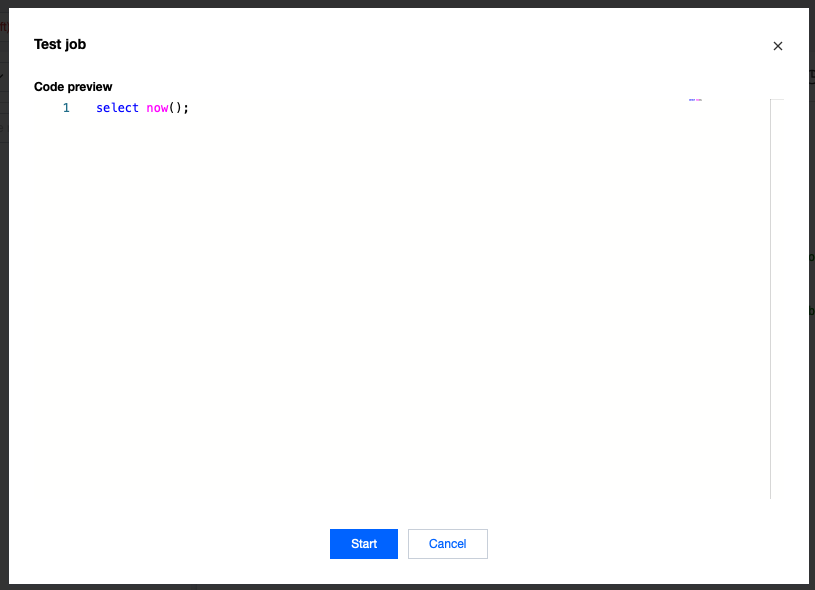
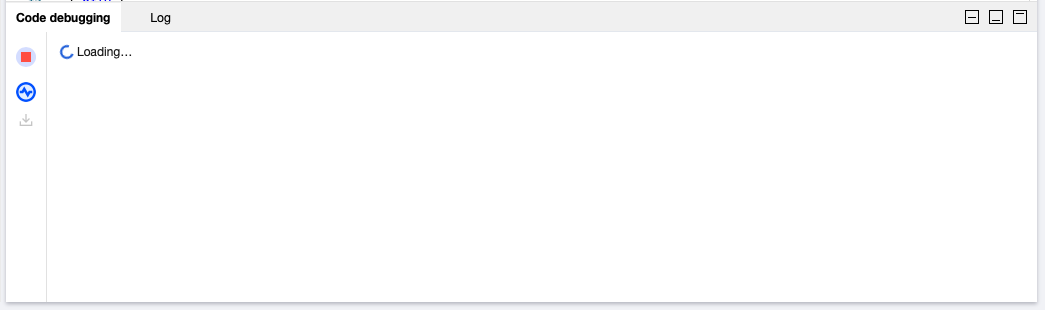
If the preview code is correct, click Start Debugging to open the debugging interface. You can click the red stop button on the left to stop the debugging tasks, or click the wavy button to enter the Flink UI interface. You can also click the minimize or maximize button in the upper right corner to resize the window.
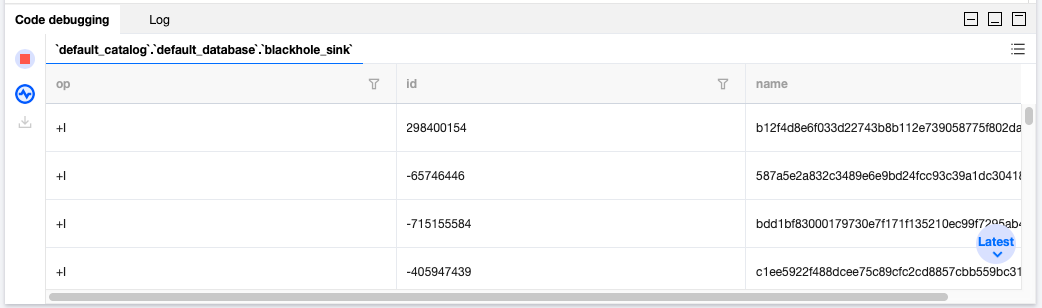
If the SQL has no syntax issues, you will receive the final result:
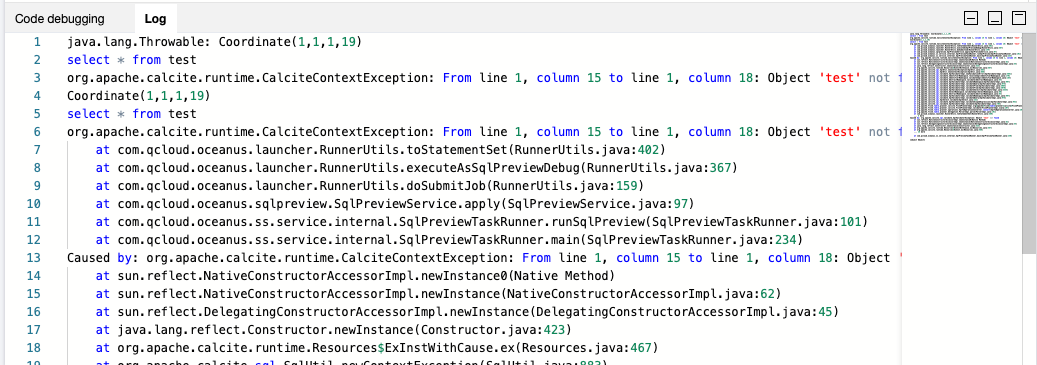
If the submitted SQL code or the SQL code being debugged reports an error during execution, the error information will be displayed in the Logs tab of the debugging window:
Note:
1. Only the super administrator can enable and disable the session cluster.
2. The resources required to start the session cluster will be deducted from the available CU amount of the dedicated cluster.
3. The debug result shows a maximum of 100 entries. If the debug task contains multiple complete Pipelines (multiple sinks), the task automatically stops when any one of the Sinks reaches 100 entries of data outputs. To output more debug results for other Sinks, you can separately select and debug the SQL code containing the complete Pipeline of that sink.
4. Switching to any other page during task execution will be treated as discarding this debugging session.
5. The session cluster will be stopped after the independent cluster is isolated. If there is a need for session debugging after user renewal, the session cluster must be restarted.
Start the session cluster. It is not allowed to set the following parameters:
"jobmanager.rpc.address","blob.server.port","jobmanager.rpc.port","taskmanager.rpc.port","taskmanager.numberOfTaskSlots","parallelism.default","rest.bind-port","web.submit.enable","kubernetes.jobmanager.cpu","jobmanager.memory.process.size","kubernetes.jobmanager.labels","kubernetes.taskmanager.cpu","taskmanager.memory.process.size","kubernetes.taskmanager.labels","kubernetes.container.image","kubernetes.rest-service.annotations","kubernetes.container.image.pull-policy","kubernetes.jobmanager.service-account","state.checkpoints.dir","state.savepoints.dir","env.java.opts","kubernetes.namespace","kubernetes.rest-service.exposed.type","taskmanager.cpu.cores","jobmanager.heap.size","jobmanager.heap.mb","taskmanager.heap.size","taskmanager.heap.mb","classloader.resolve-order"
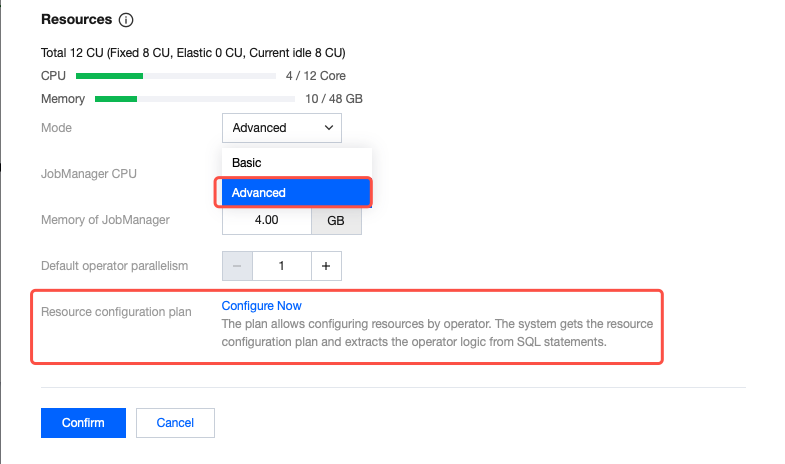
Advanced Mode of SQL Job Resource Configuration
The advanced mode of SQL job resource configurations supports fine-grained configurations of the execution graph generated by SQL, including operator parallelism, setting fine-grained resources for operators (Fine-Grained Resource Management | Apache Flink), and state TTL.
Use the following method:
1. Click Job Parameters.
2. Select Advanced Mode for Resource Configuration Mode (if there is no such option, it might be due to the earlier version of your job's cluster. Please contact us to upgrade), then click Configure Now.
3. Select the corresponding operator and set the parallelism, state TTL, and other information.
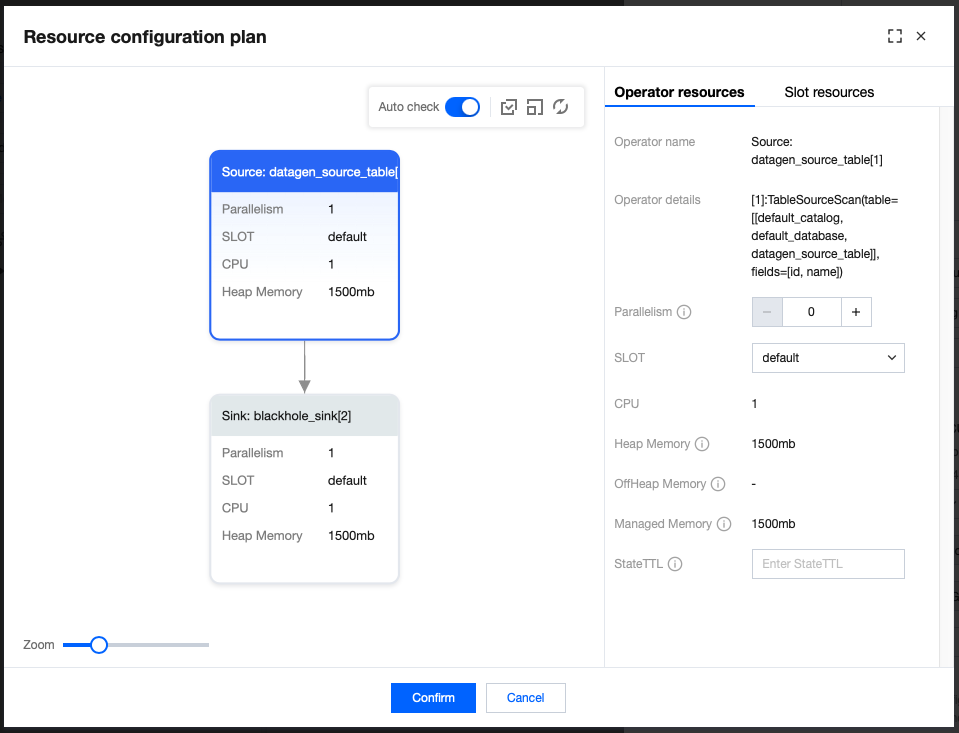
4. If you need to configure fine-grained resources for operators, click SLOT Resource Configurations to add a SLOT.
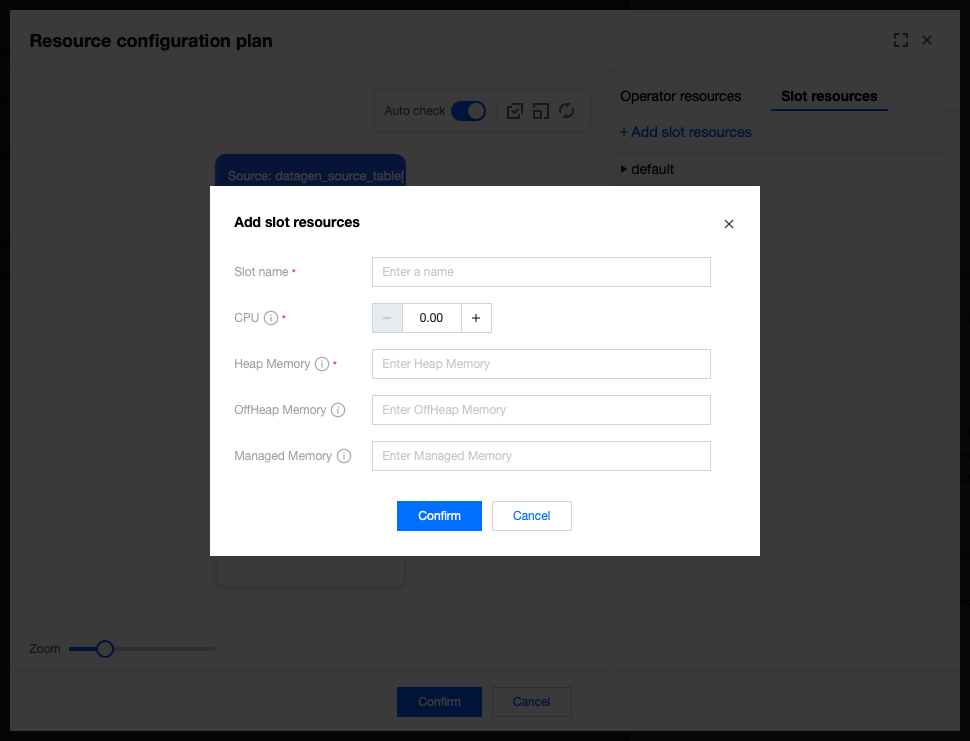
Carefully read Fine-Grained Resource Management | Apache Flink. Incorrect SLOT configurations may result in job running failure.
5. Configure the operator to the corresponding SLOT.
Help and Support
Was this page helpful?
You can also Contact sales or Submit a Ticket for help.
Help us improve! Rate your documentation experience in 5 mins.
Feedback