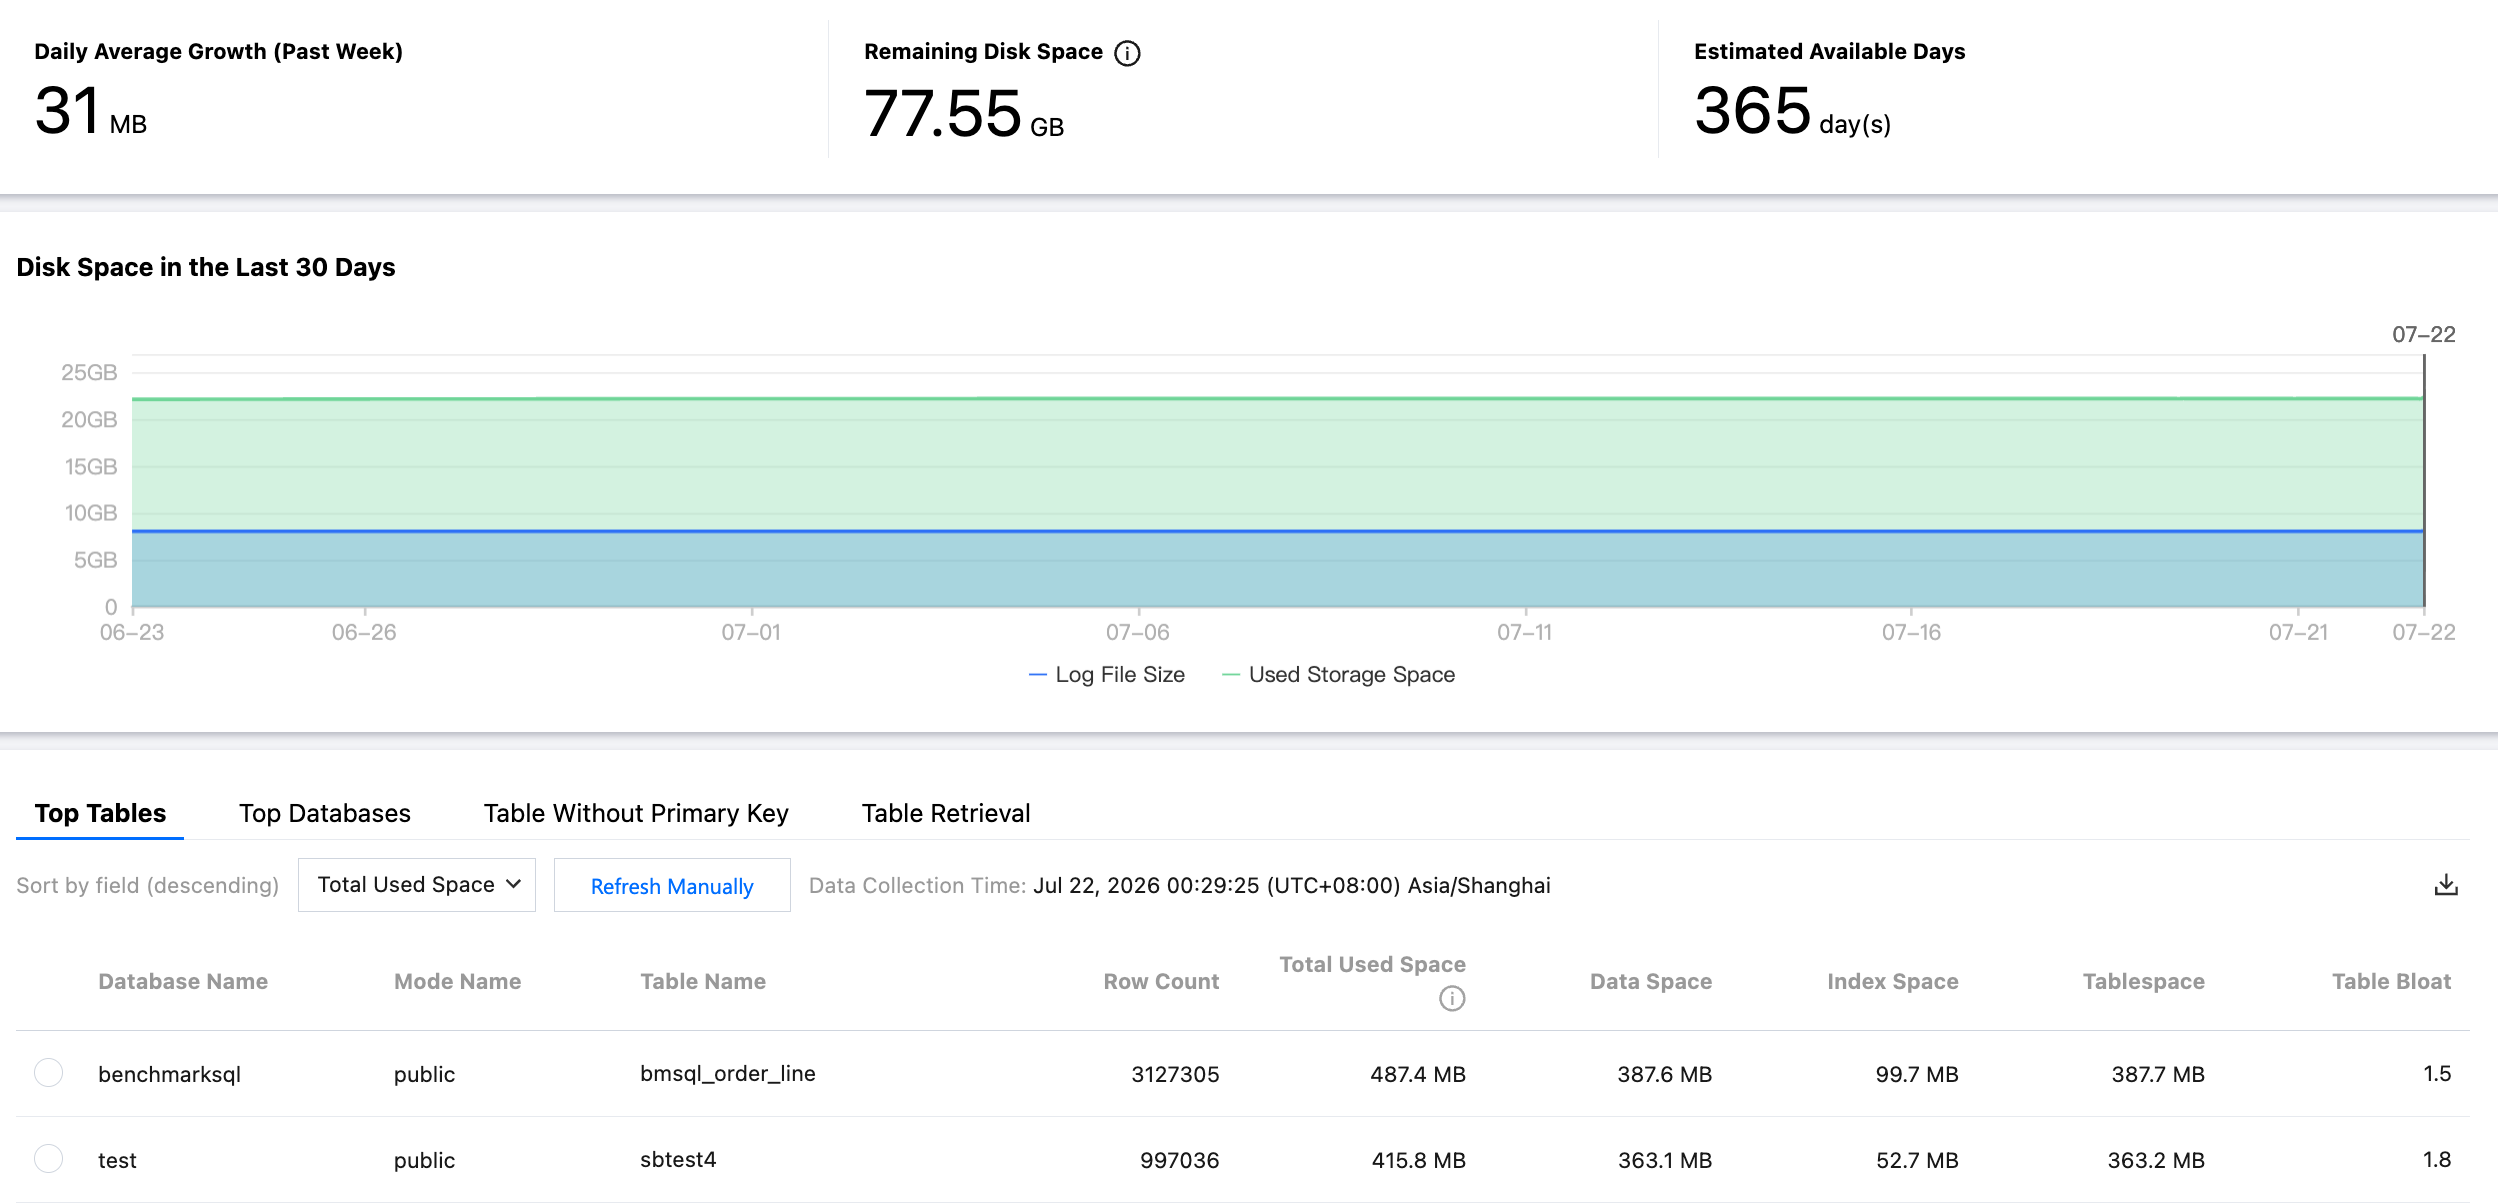
The Space Analysis feature of DBbrain allows you to view the utilization of instance space, including data space and log space sizes, average daily growth, and estimated available days, as well as view the usage details and trends of table space and database space within the instance.
Use Limits
Space analysis does not support collecting space data for read-only instances.
Space analysis does not support collecting space data for instances with more than 100,000 tables.
2. In the left sidebar, select Performance Optimization.
3. At the top of the page, select the PostgreSQL database type and instance ID, then select the Space Analysis tab.
4. On the Space Analysis page, you can view the comparison of average daily growth over the past week, remaining disk space, estimated available days, and the disk space trend chart for the last 30 days.
Remaining disk space = Purchased disk space - (Data space + Log space).
Viewing Top Tables
The TOP table space displays details of tables currently occupying large amounts of space, including number of row count, total used space, data space, index space, tablespace, and table bloat. This information helps you understand disk space usage details and perform timely optimizations.
Note:
The TOP Tables/Databases support the "Manual Refresh" feature. By default, data is collected once daily. If the collected data becomes outdated and inaccurate, you can click Refresh Manually to trigger real-time collection and analysis of TOP Tables/Databases information. Note that slight delays may occur when the instance contains numerous tables/databases or experiences heavy access load.
2. In the left sidebar, select Performance Optimization.
3. At the top of the page, select the PostgreSQL database type and instance ID, then select the Space Analysis tab.
4. Select the TOP Tables tab, choose the sort field (descending order), including data space, index space, total used space, table space, table bloat, and number of rows, to view the TOP tables list.
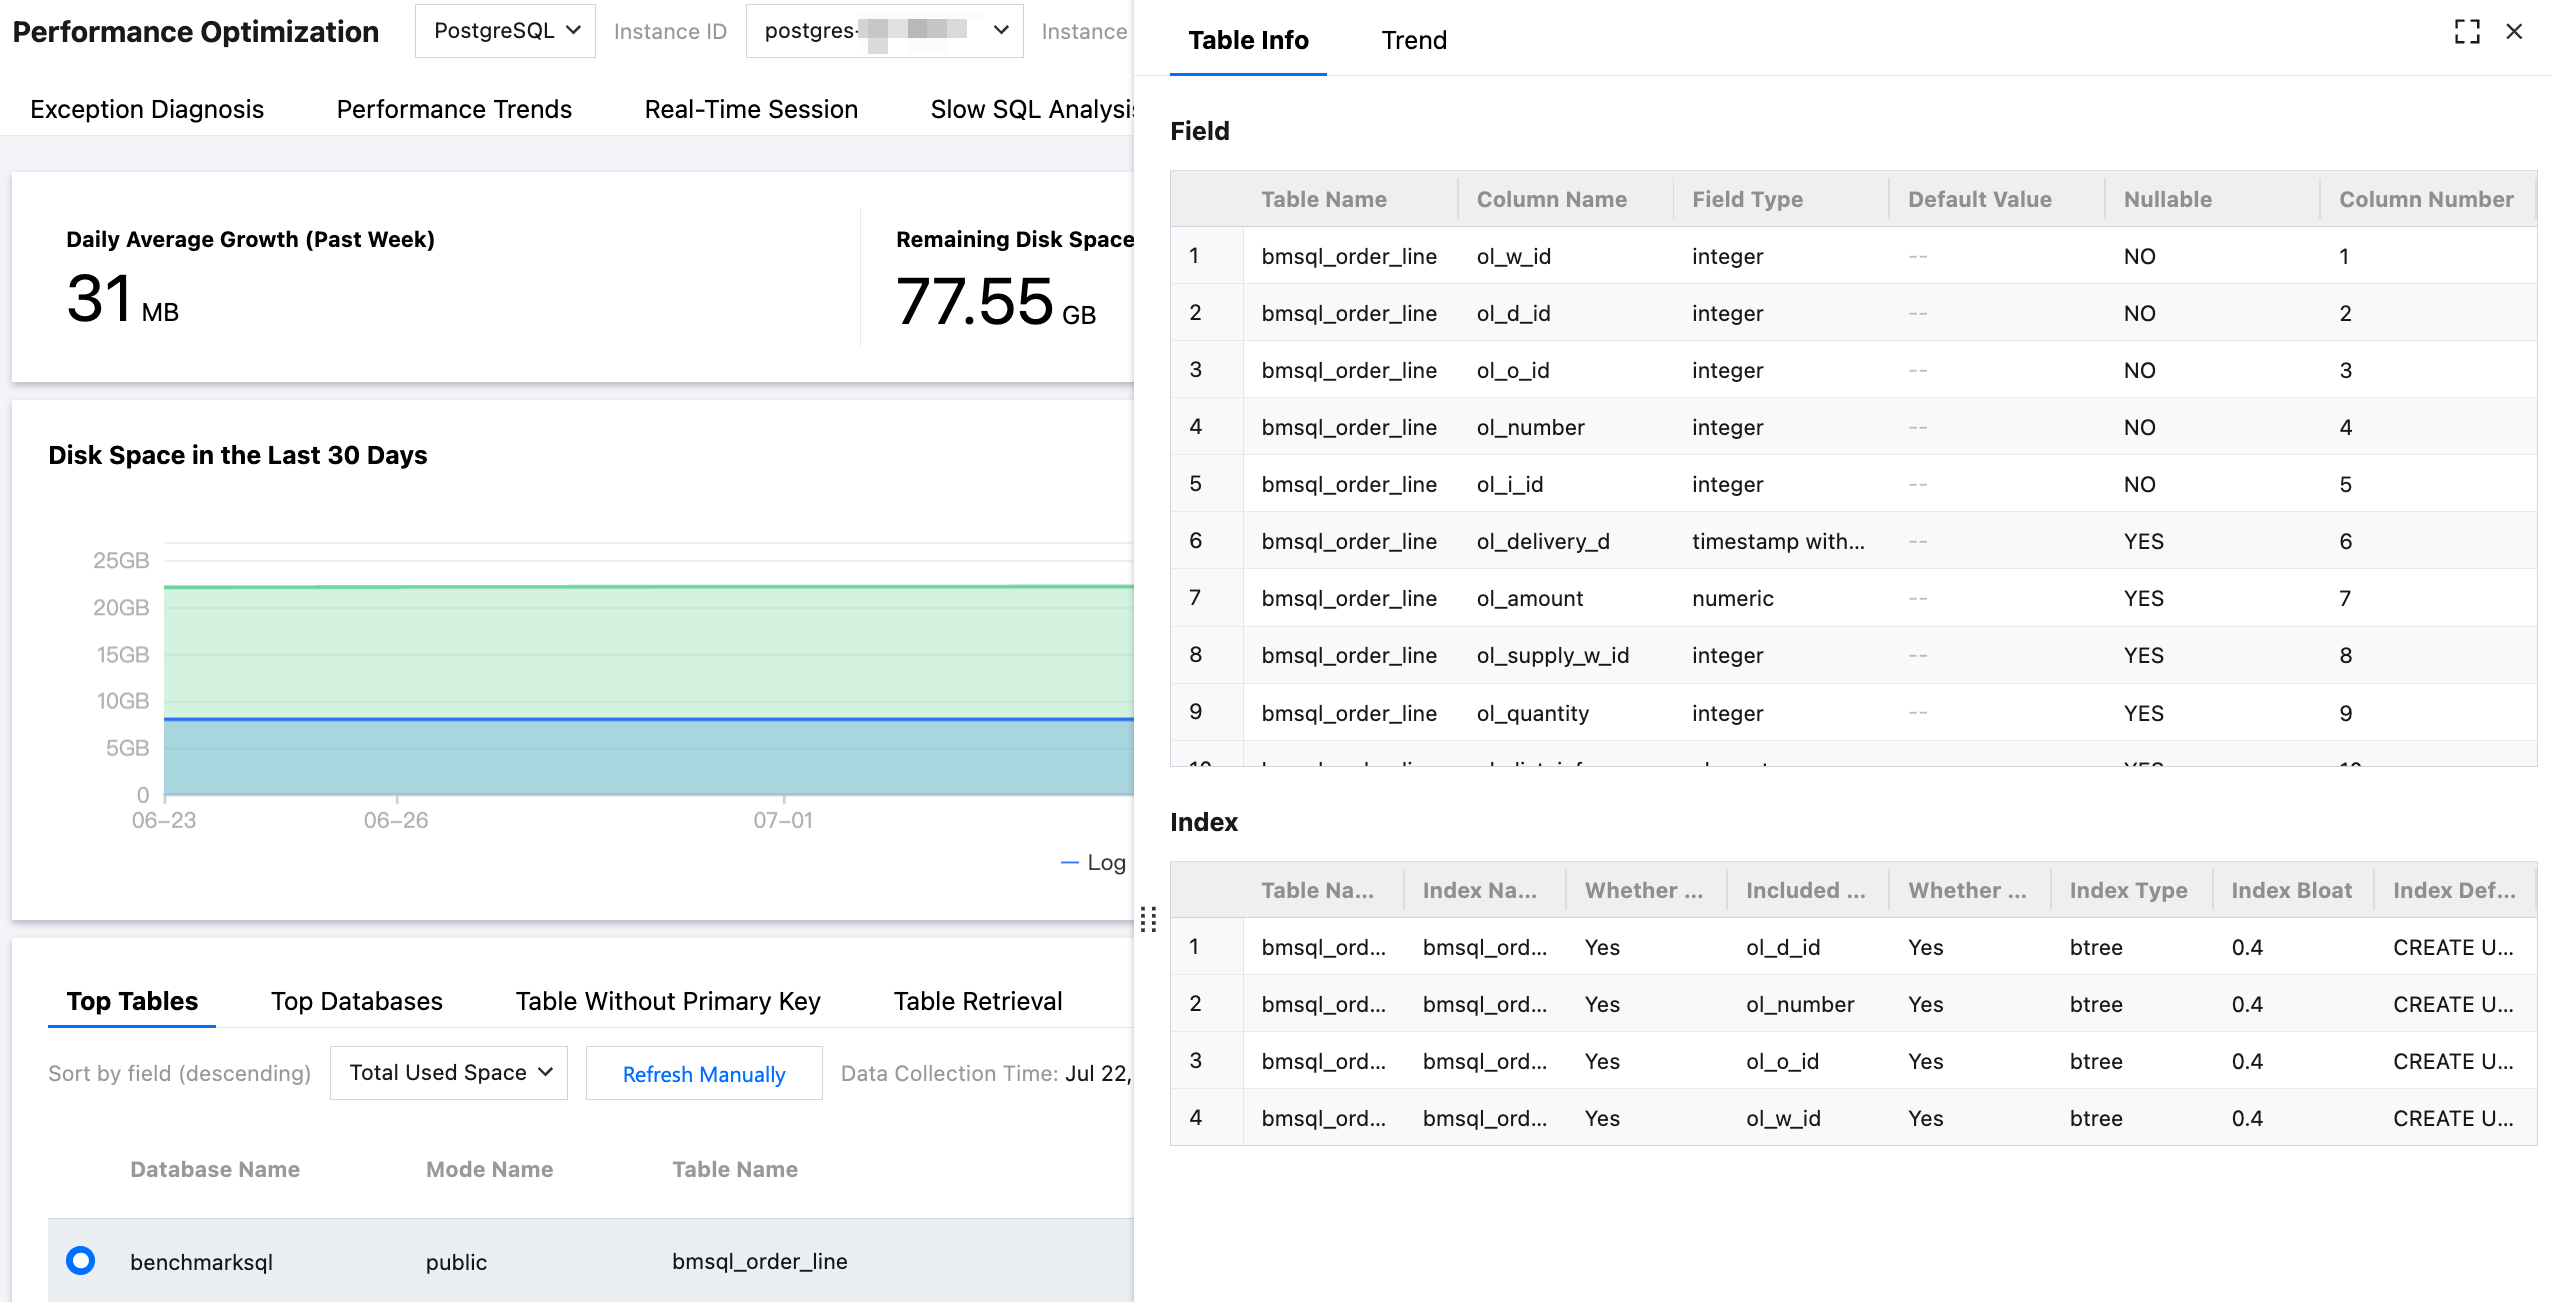
5. Click the data row in the list of top tables to view the table information and trend charts.
Table Info: Displays detailed field and index information for the table. Field information includes table name, column name, field type, default value, whether null values are allowed, and column sequence number. Index information includes table name, index name, whether it is unique, included columns, whether it is the primary key, index type, index bloat, and index definition.
Trend: Include trend charts for table bloat, space usage (data space, table space, index space), and physical file size (number of rows, total used space).
6. (Optional) In the upper-right corner of the list, click
to download the top table data in .csv format.
TOP Database
The Top Databases display details of databases with large space usage, including physical file size, number of rows, total used space, data space, index space, fragment space, and fragmentation rate. The information helps you understand disk space usage and optimize it in a timely manner.
2. In the left sidebar, select Performance Optimization.
3. At the top of the page, select the PostgreSQL database type and instance ID, then select the Space Analysis tab.
4. Select the TOP Databases tab, choose the sort field (descending order), to view the list of TOP databases.
5. Click a data row in the list of TOP databases to view trend charts. The trend charts include table bloat, space usage (data space, table space, index space), and physical file size (number of rows, total used space).
6. (Optional) In the upper-right corner of the list, click
to download the top database data in .csv format.
Table Without Primary Key
The Table Without Primary Key section displays information about tables in the current instance lacking primary keys. Such tables pose potential risks and may affect instance read/write performance and synchronization efficiency. It is recommended to promptly address these tables and add primary keys suitable for the business scenarios.
2. In the left sidebar, select Performance Optimization.
3. At the top of the page, select the PostgreSQL database type and instance ID, then select the Space Analysis tab.
4. Select the Table Without Primary Key tab to view the list of tables without primary keys.
The list of tables without primary keys supports both periodic scanning (with a frequency of once per day) and manual refresh. Click a table without a primary key in the list to view its field and index information.
5. (Optional) In the upper-right corner of the list, click
to download the data of tables without primary keys in .csv format.