Slow SQL analysis collects, samples, and aggregates the records and execution information of slow SQL in the instance (such as source information, frequency, execution time, returned sets, scanned sets, and so on). For the aggregated SQL statements, execution plans, overall resource consumption, sizes of scanned and returned sets, index usage efficiency, and so on, it analyzes the performance of slow SQL and provides optimization suggestions. It also supports slow SQL throttling.
Usage Limits
Directly connected self-built database instances do not support slow log analysis.
When the query time exceeds the value set by the long_query_time parameter, the corresponding SQL statements will be counted in the slow SQL analysis page.
2. In the left sidebar, select Performance Optimization.
3. At the top of the page, select the PostgreSQL database type and instance ID, then select the Slow SQL Analysis tab.
4. At the top of the page, select the Statistics tab.
5. Select a time period. Options include today, last 5 minutes, last 10 minutes, last hour, last 3 hours, last 24 hours, last 3 days, and custom.
6. View the slow SQL statistics trend chart, slow SQL breakdown time consumption statistics, and slow SQL list data.
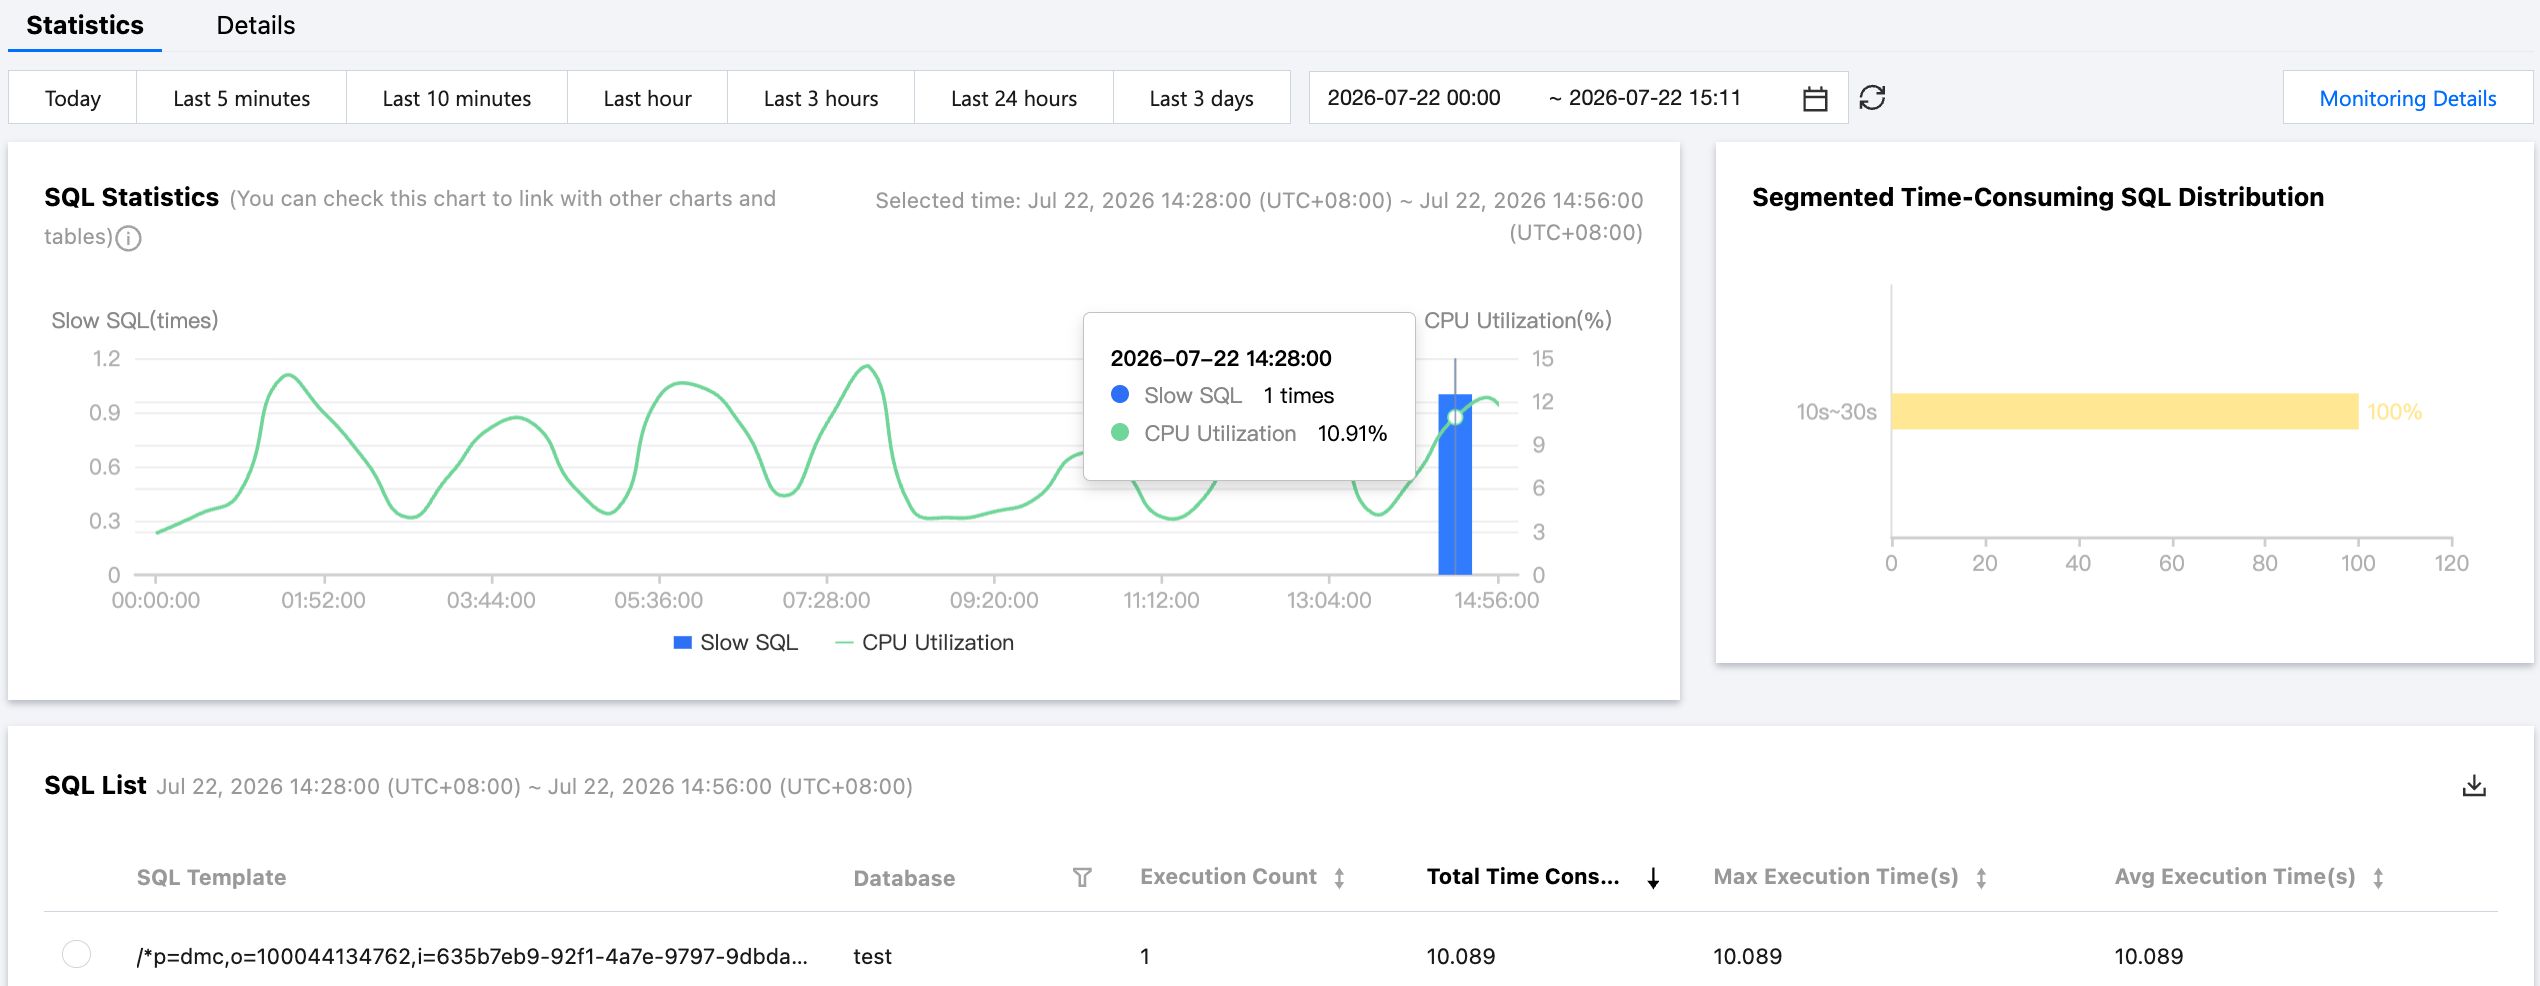
SQL Statistics: Displays the number of slow SQLs and CPU utilization trend information for the selected time range. SQL Statistics is displayed in conjunction with Segmented Time-Consuming SQL Distribution and SQL List.
Among them, slow SQL is displayed as blue bar charts, and CPU utilization is shown as green curves. Clicking on a single blue bar or dragging to select multiple time periods (selecting multiple blue bars) will dynamically display the corresponding data for the selected period in the Breakdown Time Consumption SQL Distribution and SQL List sections.
Segmented Time-Consumption SQL Distribution: The breakdown time consumption slow SQL distribution displays the overall time consumption distribution of slow SQL queries within the selected time period. The horizontal axis represents the percentage of slow SQL queries, while the vertical axis indicates the time ranges of slow SQL execution. Hover the cursor over a specific time range to view the percentage of slow SQL queries in that period.
SQL List: Displays aggregated SQL template information for slow queries during the selected time period. Clicking on the SQL template allows you to view analysis, statistics, and detailed information. Additionally, throttling operations for slow SQL are supported.
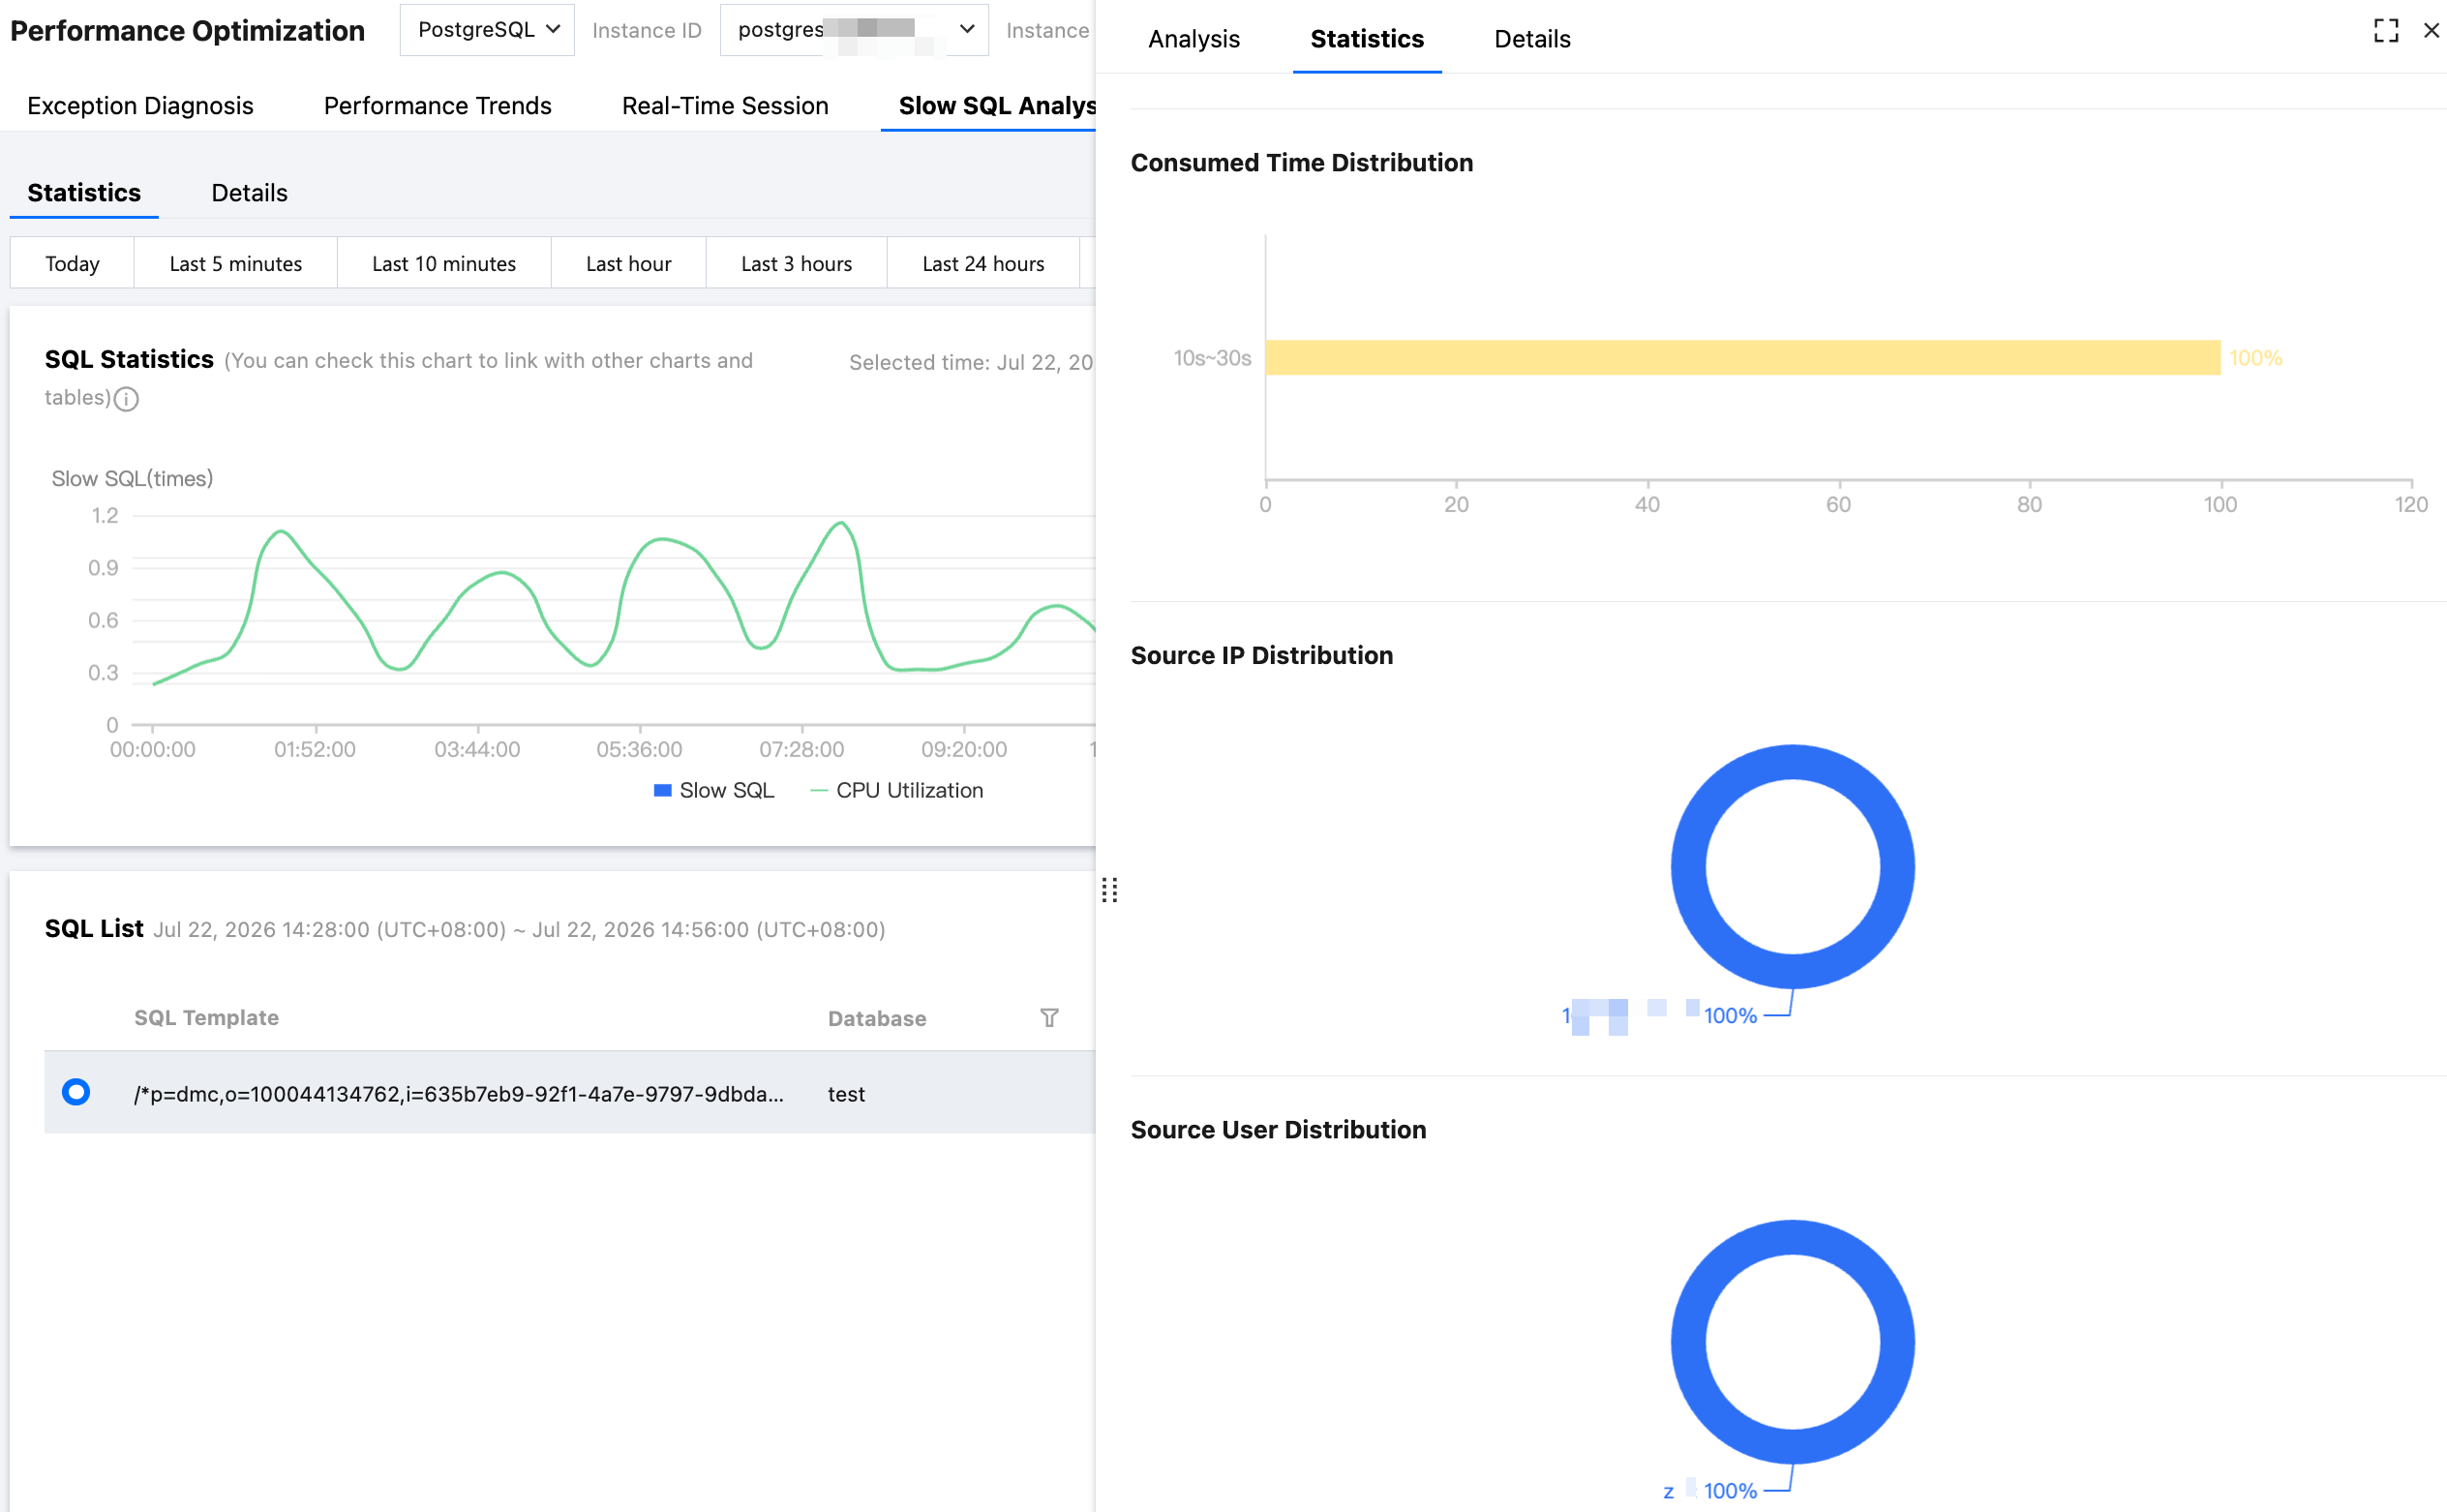
7. In the SQL list, click on the aggregated SQL template. A panel will slide out from the right, displaying detailed analysis, statistics, and granular data for the SQL.
On the Analysis page, you can view the complete SQL template and SQL samples.
On the Statistics page, you can view information such as time consumption distribution, source IP address distribution, and source User distribution for this type of SQL (aggregated summary).
On the Details page, you can view detailed SQL execution records. For specific operations, see Viewing Slow SQL Details.
8. Export slow SQL data.
On the right side of the SQL list, click
to export slow SQL analysis data in .csv format locally, facilitating user review.
2. In the left sidebar, select Performance Optimization.
3. At the top of the page, select the PostgreSQL database type and instance ID, then select the Slow SQL Analysis tab.
4. At the top of the page, select the Details tab.
5. Use the following conditions to filter and view detailed SQLs.
Select the time period: today, last 5 minutes, last 10 minutes, last hour, last 3 hours, last 24 hours, last 3 days, or custom time periods.
Select a database and enter filter conditions such as user, IP address, keyword, and so on.
The details list also supports the following operations:
Hover over the SQL statement to view and copy the it.
Click
at the top of the list to export the detailed list in the CSV format. You can export up to 10,000 records at a time. For more records, narrow the time period and export again.