Lag
Download
Focus Mode
Font Size
Overview
Application lag is one of the key reasons leading to user churn. The Lag Monitoring module is dedicated to assisting users in managing lag issues. An important approach to lag management is to measure the current state of the application by extracting effective metrics, capturing sufficient information to provide optimization directions. The lag monitoring module measures the application's smoothness using two metrics: FPS and suspension rate. Through lag issue monitoring, it directly captures lag stacks, helping users identify the causes of lag and providing optimization directions.
Lag metric uses stable and lightweight collection techniques to collect smoothness data throughout the entire application runtime.
Lag issue monitoring utilizes high-frequency stack trace capturing to provide rich contextual information for accurate cause analysis.
The Android platform's self-developed rapid stack trace capturing technology effectively improves performance compared to traditional stack trace capturing implementations.
Both lag metrics and lag issues support custom sampling rates and provide robust data analysis capabilities.
Metric
The module measures application smoothness using two metrics: FPS and hanging rate.
FPS data is aggregated by scenario, directly counting user-reported raw records, and calculates average and percentile values based on these raw records.
Suspension rate is calculated based on user-reported raw records, aggregated daily by device ID. Multiple records generated by a single device in a day are consolidated into a single record. The suspension rate is then computed by averaging and calculating percentile values from these aggregated data sets.
FPS
FrameRate: Frame rate is the number of images that the GPU and CPU can generate during application runtime, measured in frames/second (FramesPerSecond, FPS). It is typically used as a metric to evaluate hardware performance and application smoothness. Key points include:
Lag Monitoring statistics include FPS during UI refresh, capturing the real user experience of the application.
RUM Pro's lag monitoring measures FPS that includes real UI refresh, excluding data from page idle periods. For example, when viewing a photo album page, if the application does not handle asynchronous loading properly, it may experience lag during user scrolling. When the user is quietly viewing photos, since no time-consuming operations are triggered, it may appear normal. If FPS is calculated based on the total time the user stays on the page, the period without refresh may average out the lag during scrolling. With RUM Pro's lag metric monitoring, this issue is avoided; we only measure FPS that includes real page refresh, so FPS remains unaffected by variations in page idleness duration.
The platform normalizes FPS data to ensure compatibility across various refresh rates.
Currently, smartphones on the market feature various screen refresh rates, commonly 60Hz, 90Hz, and 120Hz. Simply put, if an application performs exceptionally well with minimal UI update overhead, its frame rate is limited by the screen refresh rate and cannot exceed it. This means that even a high-performance application will exhibit different frame rates across devices with varying screen refresh rates. The impact of different refresh rates on VSYNC signal generation frequency is illustrated in the following figure.
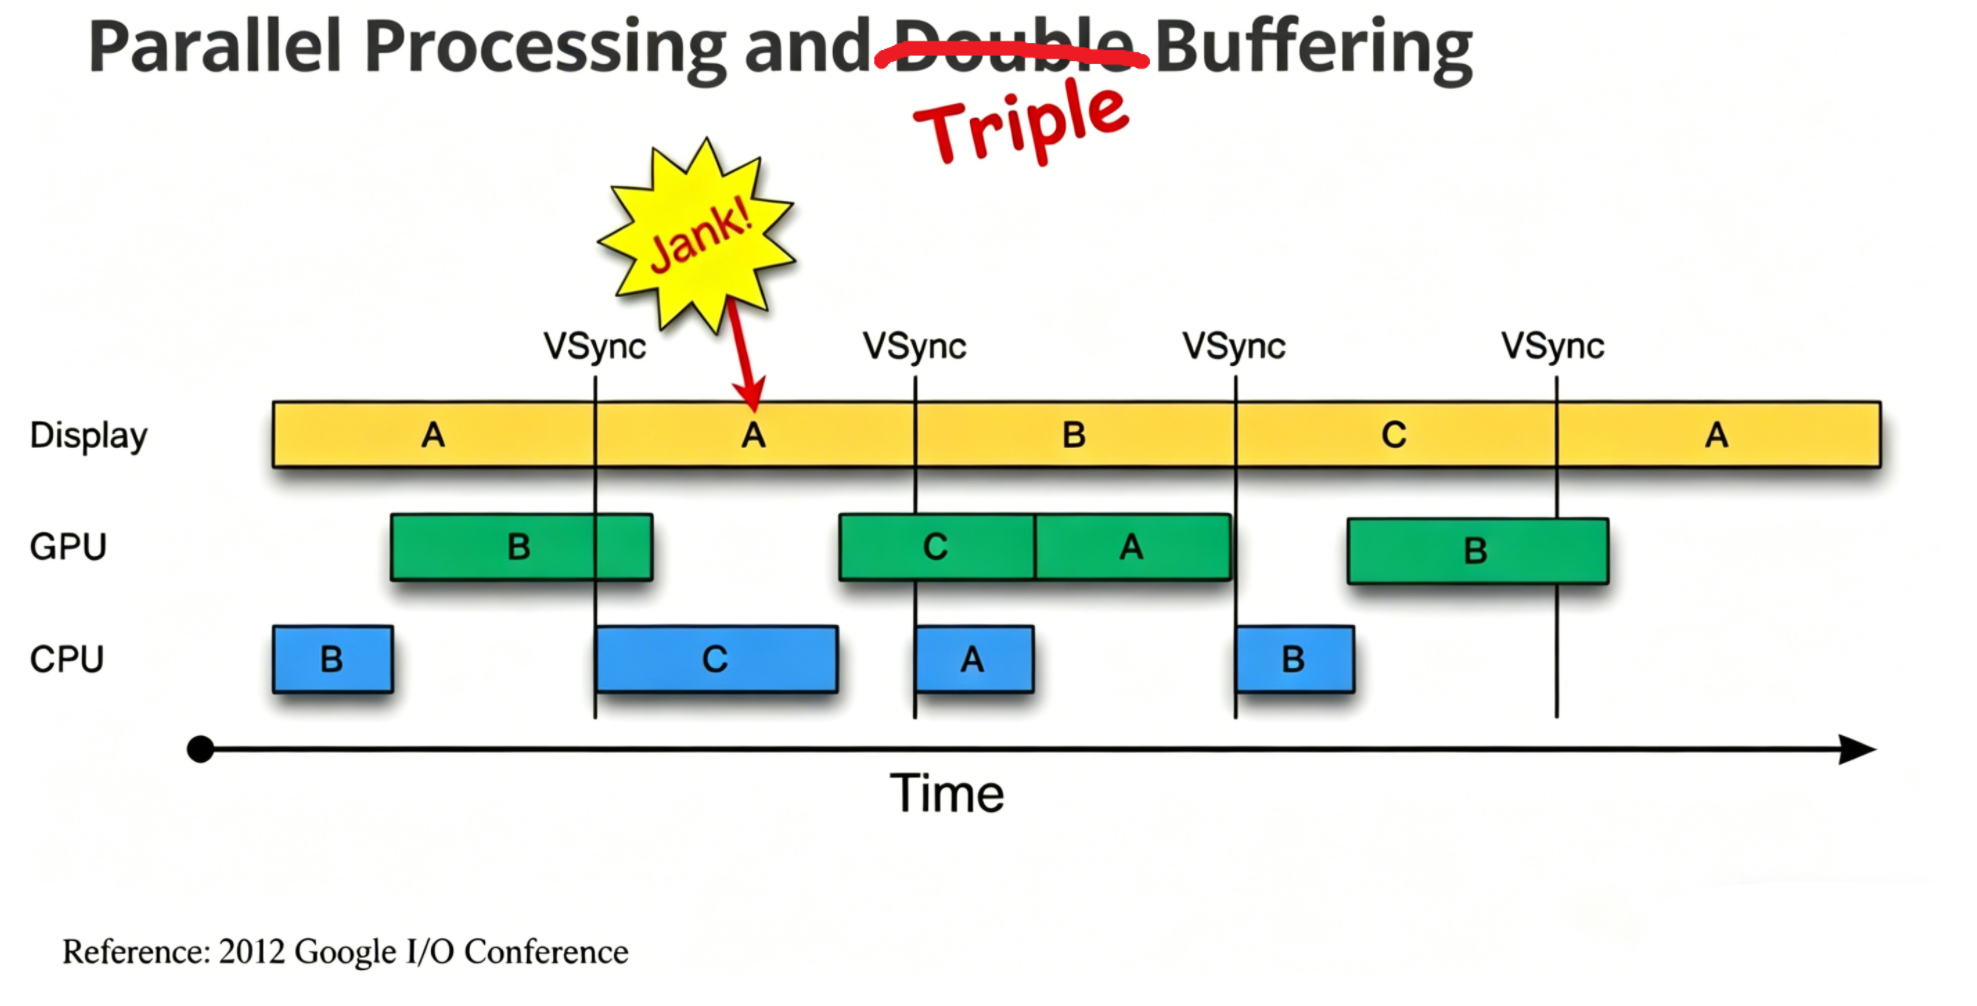
RUM Pro adopts a normalization approach to unify different screen refresh rates to 60Hz. This means that even across devices with varying refresh rates, the platform reports nearly identical FPS values for the same application.
The platform aggregates FPS by scenario, and data from the same scenario during a single run is reported in a consolidated manner.
RUM Pro aggregates FPS by scenario during application runtime. The lag metrics module collects data for each scenario. When the user switches scenarios, the module retains data from the previous scenario. The next time the application is launched, the reporting module retrieves data collected during the last run, consolidates identical scenarios, and ultimately generates distinct data records for each scenario.
Supports multiple percentile values: P50, P90, P99, helping users better understand actual user experience.
Scenario data records are reported to the server, which stores these raw records while calculating average and percentile values (P50, P90, P99).
Percentile values (P50, P90, P99):
For example, during a single run of Application A, a user experiences 10 scenarios, generating 10 records reported to the server. With 10 users reporting, a total of 100 records are generated. Each record contains FPS data. The server sorts these 100 records by FPS value in descending order. The 50th data point in this sorted dataset represents the P50 value; the 90th data point represents P90; and the 99th data point represents P99.
In FPS, percentile values are sorted in descending order, thus P50 >= P90 >= P99.
The SDK's FPS statistics collection method has minimal performance impact on applications.
Hanging rate
For lag monitoring, the suspension rate is calculated as follows: if the refresh delay between two application frames exceeds 200 ms, it is considered that the application fails to respond adequately to user interactions, and this delay is accumulated into the suspension time. The suspension rate of a device is defined as its total suspension time divided by the device's total foreground duration within a day. In other words, the suspension rate in lag monitoring is aggregated daily per device, calculated as: Device Suspension Rate = Total Daily Suspension Time (in seconds) / Total Daily Foreground Duration (in hours).
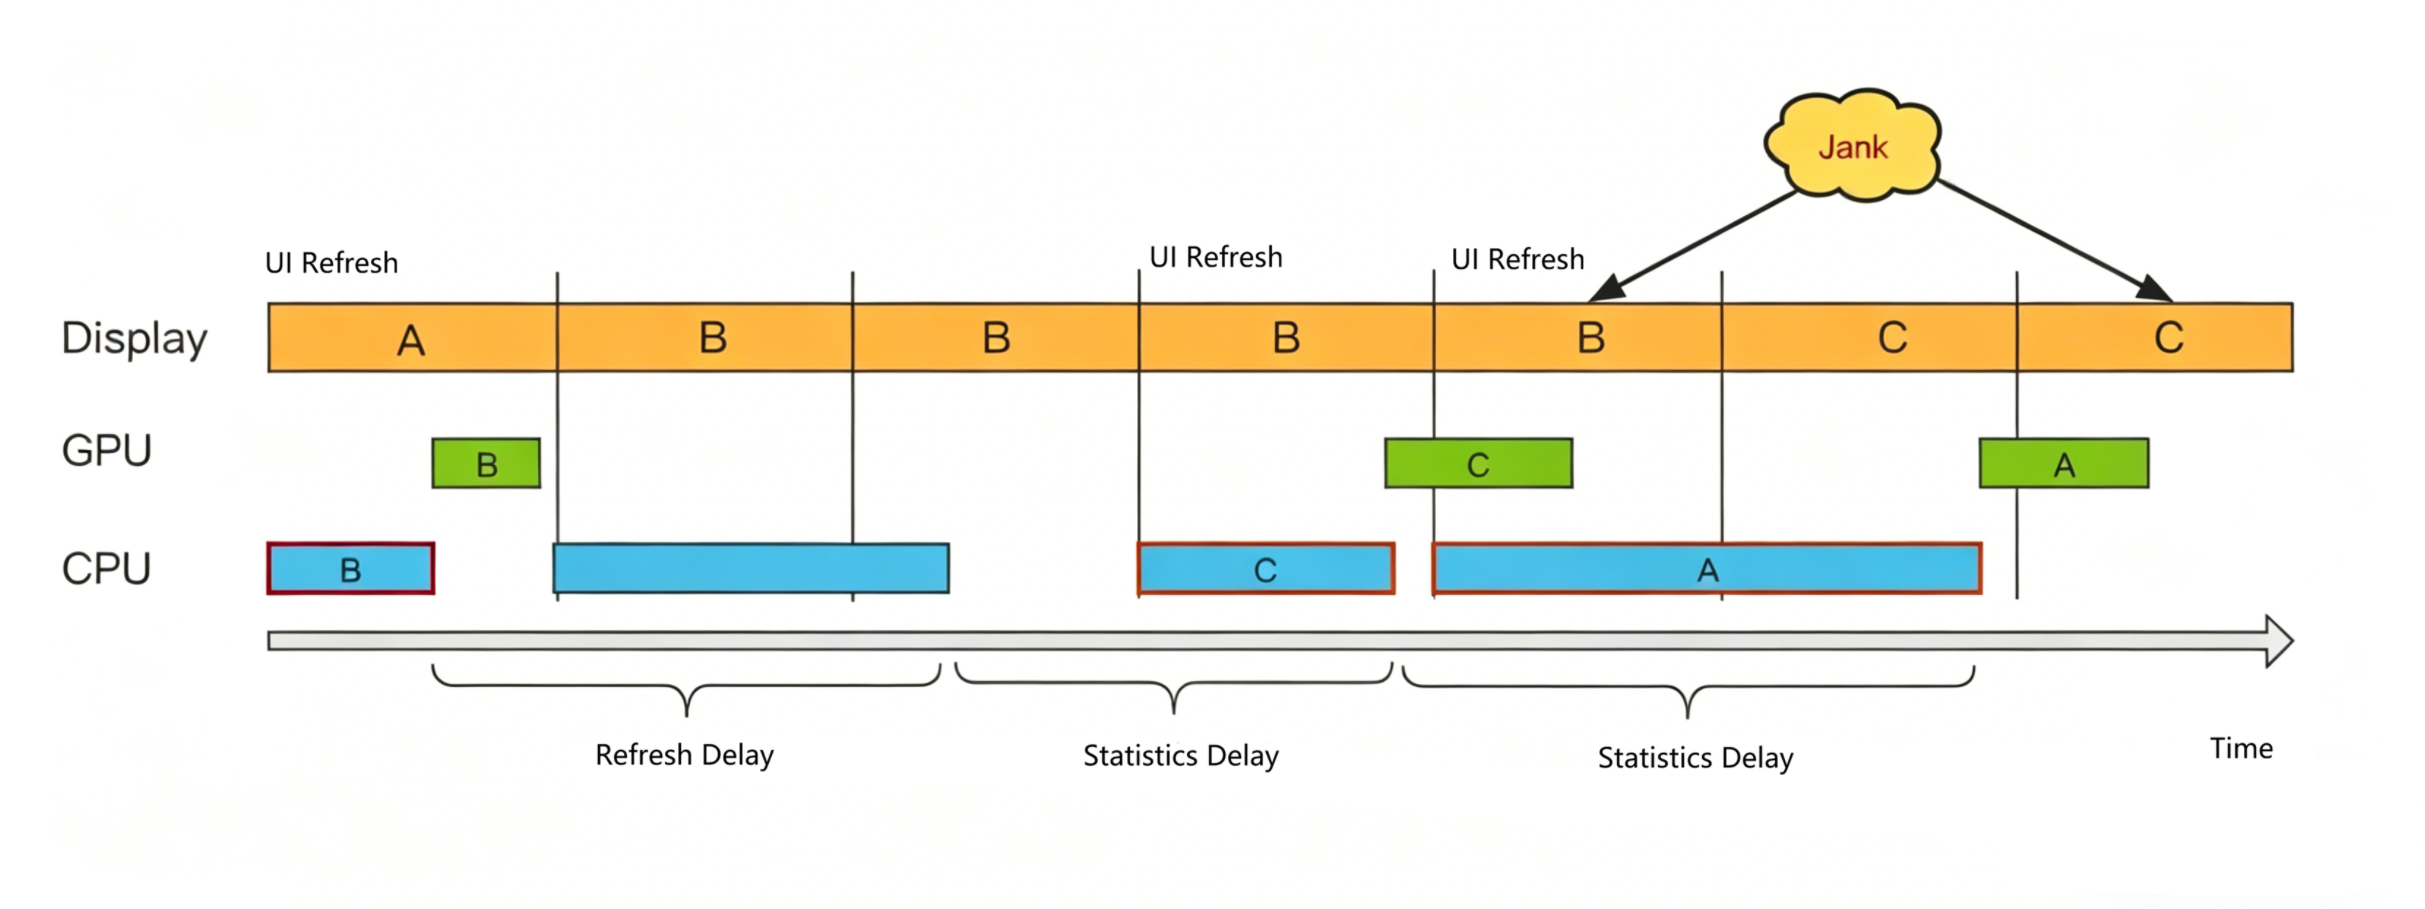
For an application, we focus on percentile values of device suspension rates, such as P50, P90, and P99. For example, for Application A on a given day, 100 devices reported suspension rate data. The backend aggregates by device ID, resulting in 100 records. Each record contains a suspension rate value. These 100 records are sorted in ascending order. In this sorted dataset, the 50th record shows 45.23s/h, thus P50 = 45.23s/h. Similarly, the 90th record shows 134.23s/h, so P90 = 134.23s/h.
Metric Analysis
The following content uses FPS metrics as an example for analysis. Suspension rate can be referenced similarly.
Trend analysis
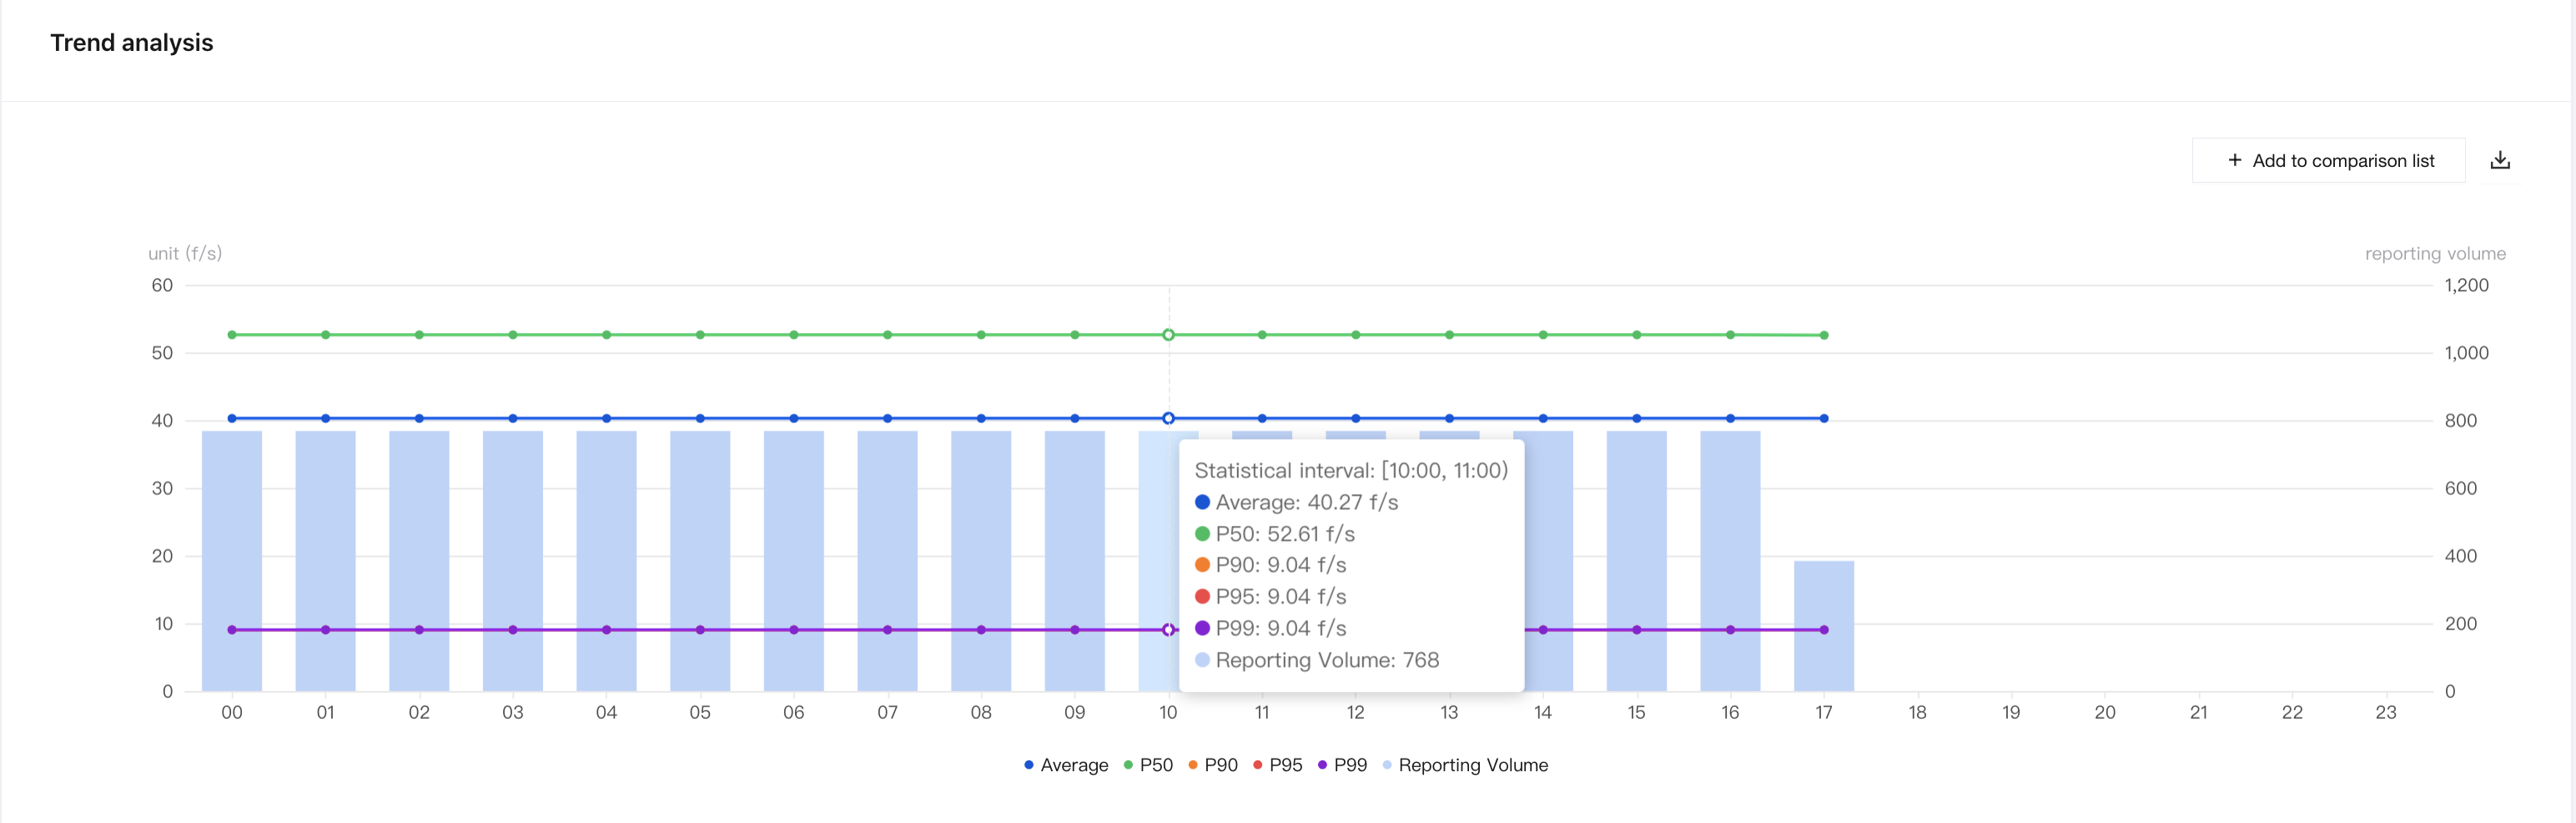
Users can view FPS trend analysis for a day or a specific period. The platform provides multiple statistical methods, including average and percentile values (P50, P90, P99), helping users better understand the overall FPS performance of applications.
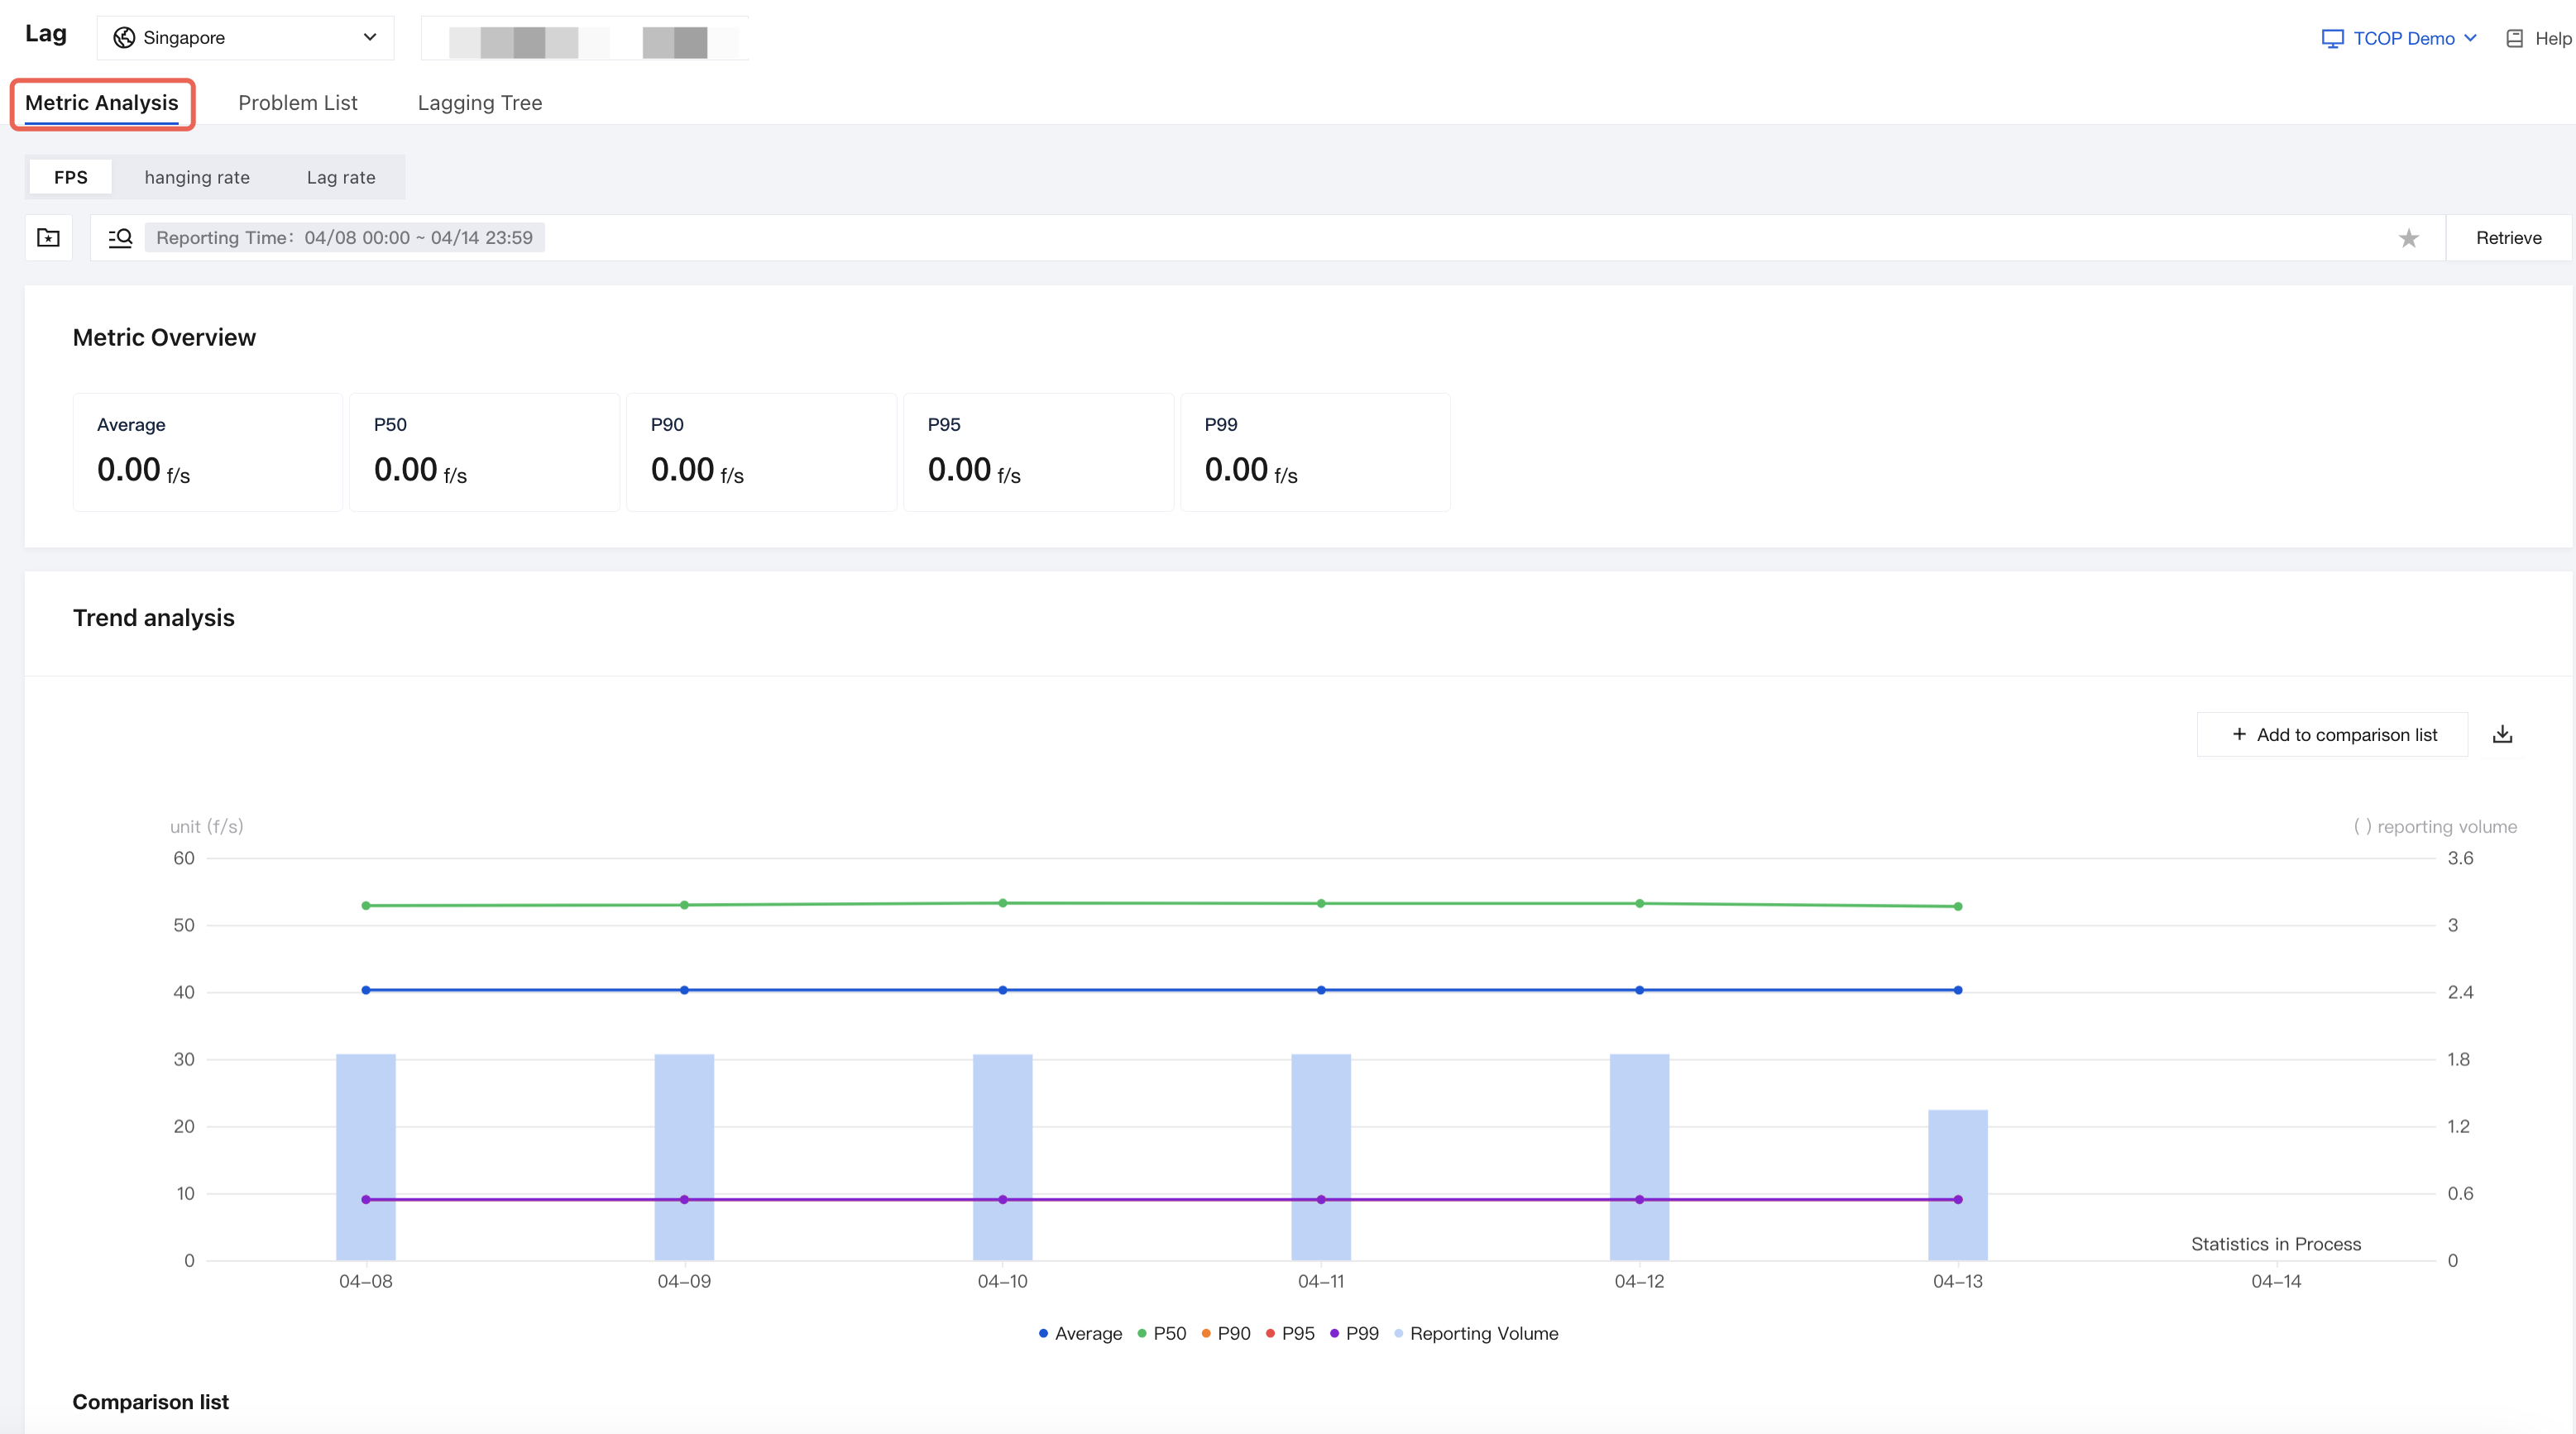
Users can query FPS data under specified conditions. As shown in the following figure, the FPS for a specified scenario:
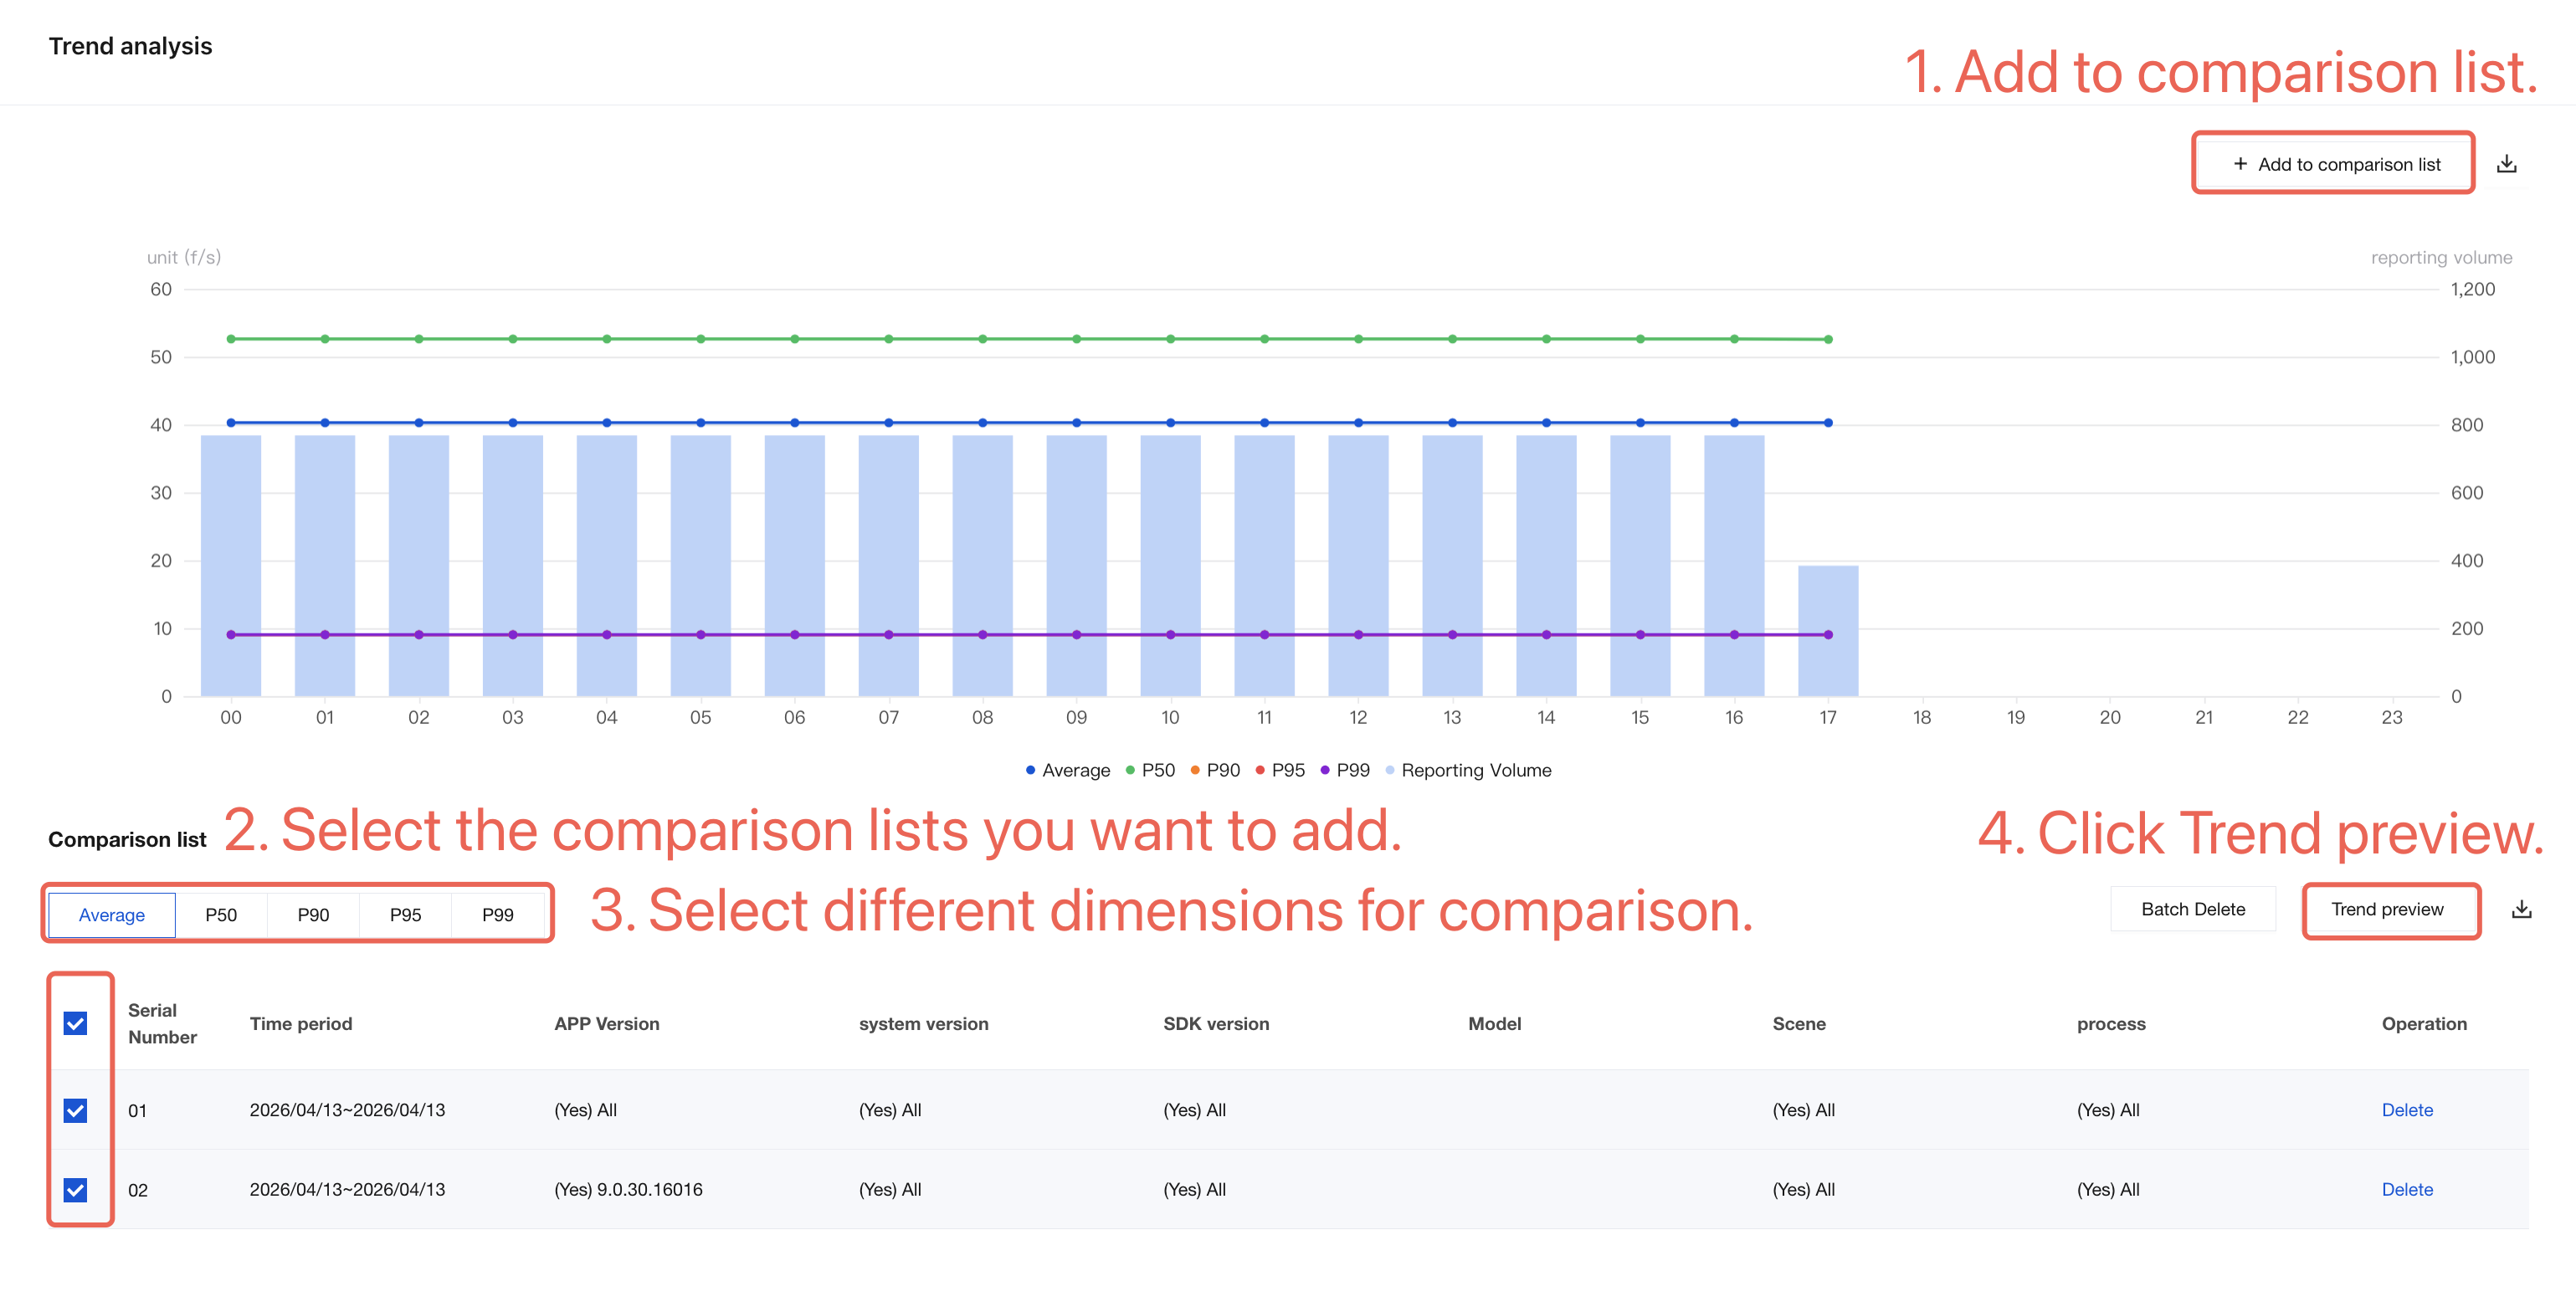
Compare and Analyze
In trend analysis, you can add a set of query results to the comparison list. After adding multiple sets of query results, you can subsequently compare and analyze these datasets within the comparison list.
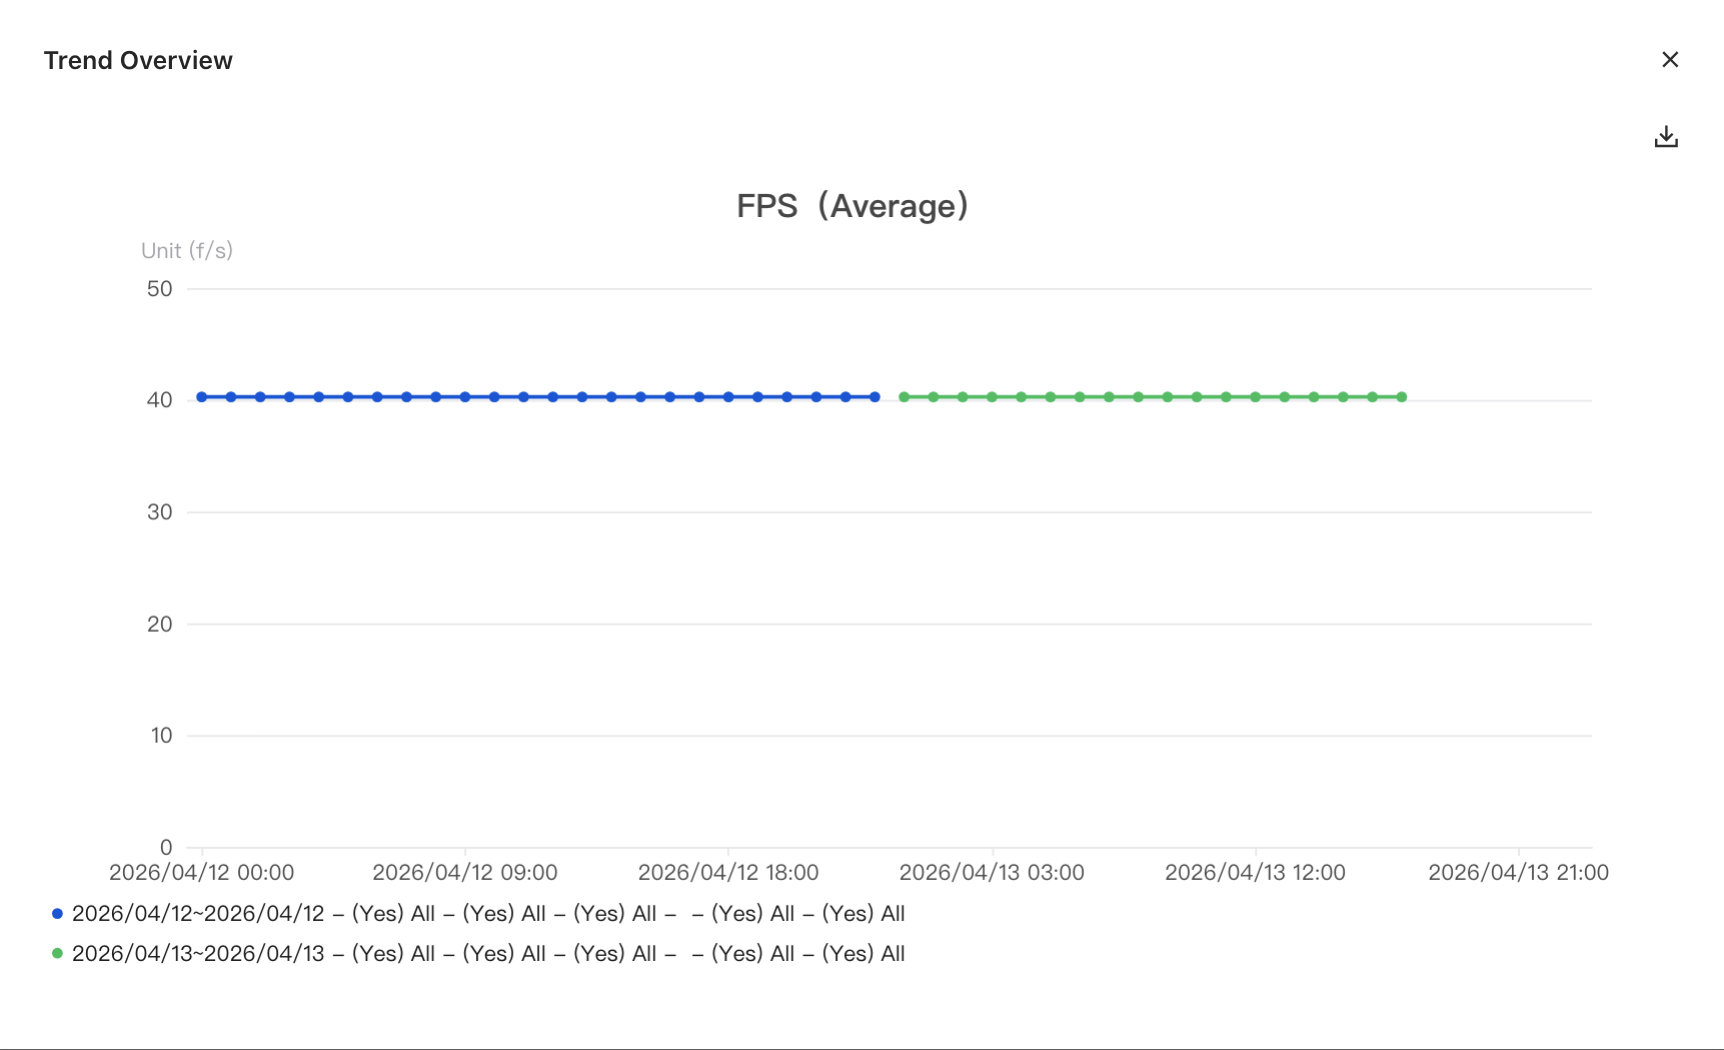
As shown in the figure below, it is desired to compare and analyze data from two different scenarios. Query the data for these two scenarios separately, add them to the comparison list, and click Trend Preview to view comparison results across different statistical dimensions.
Trend Preview Sample Chart:
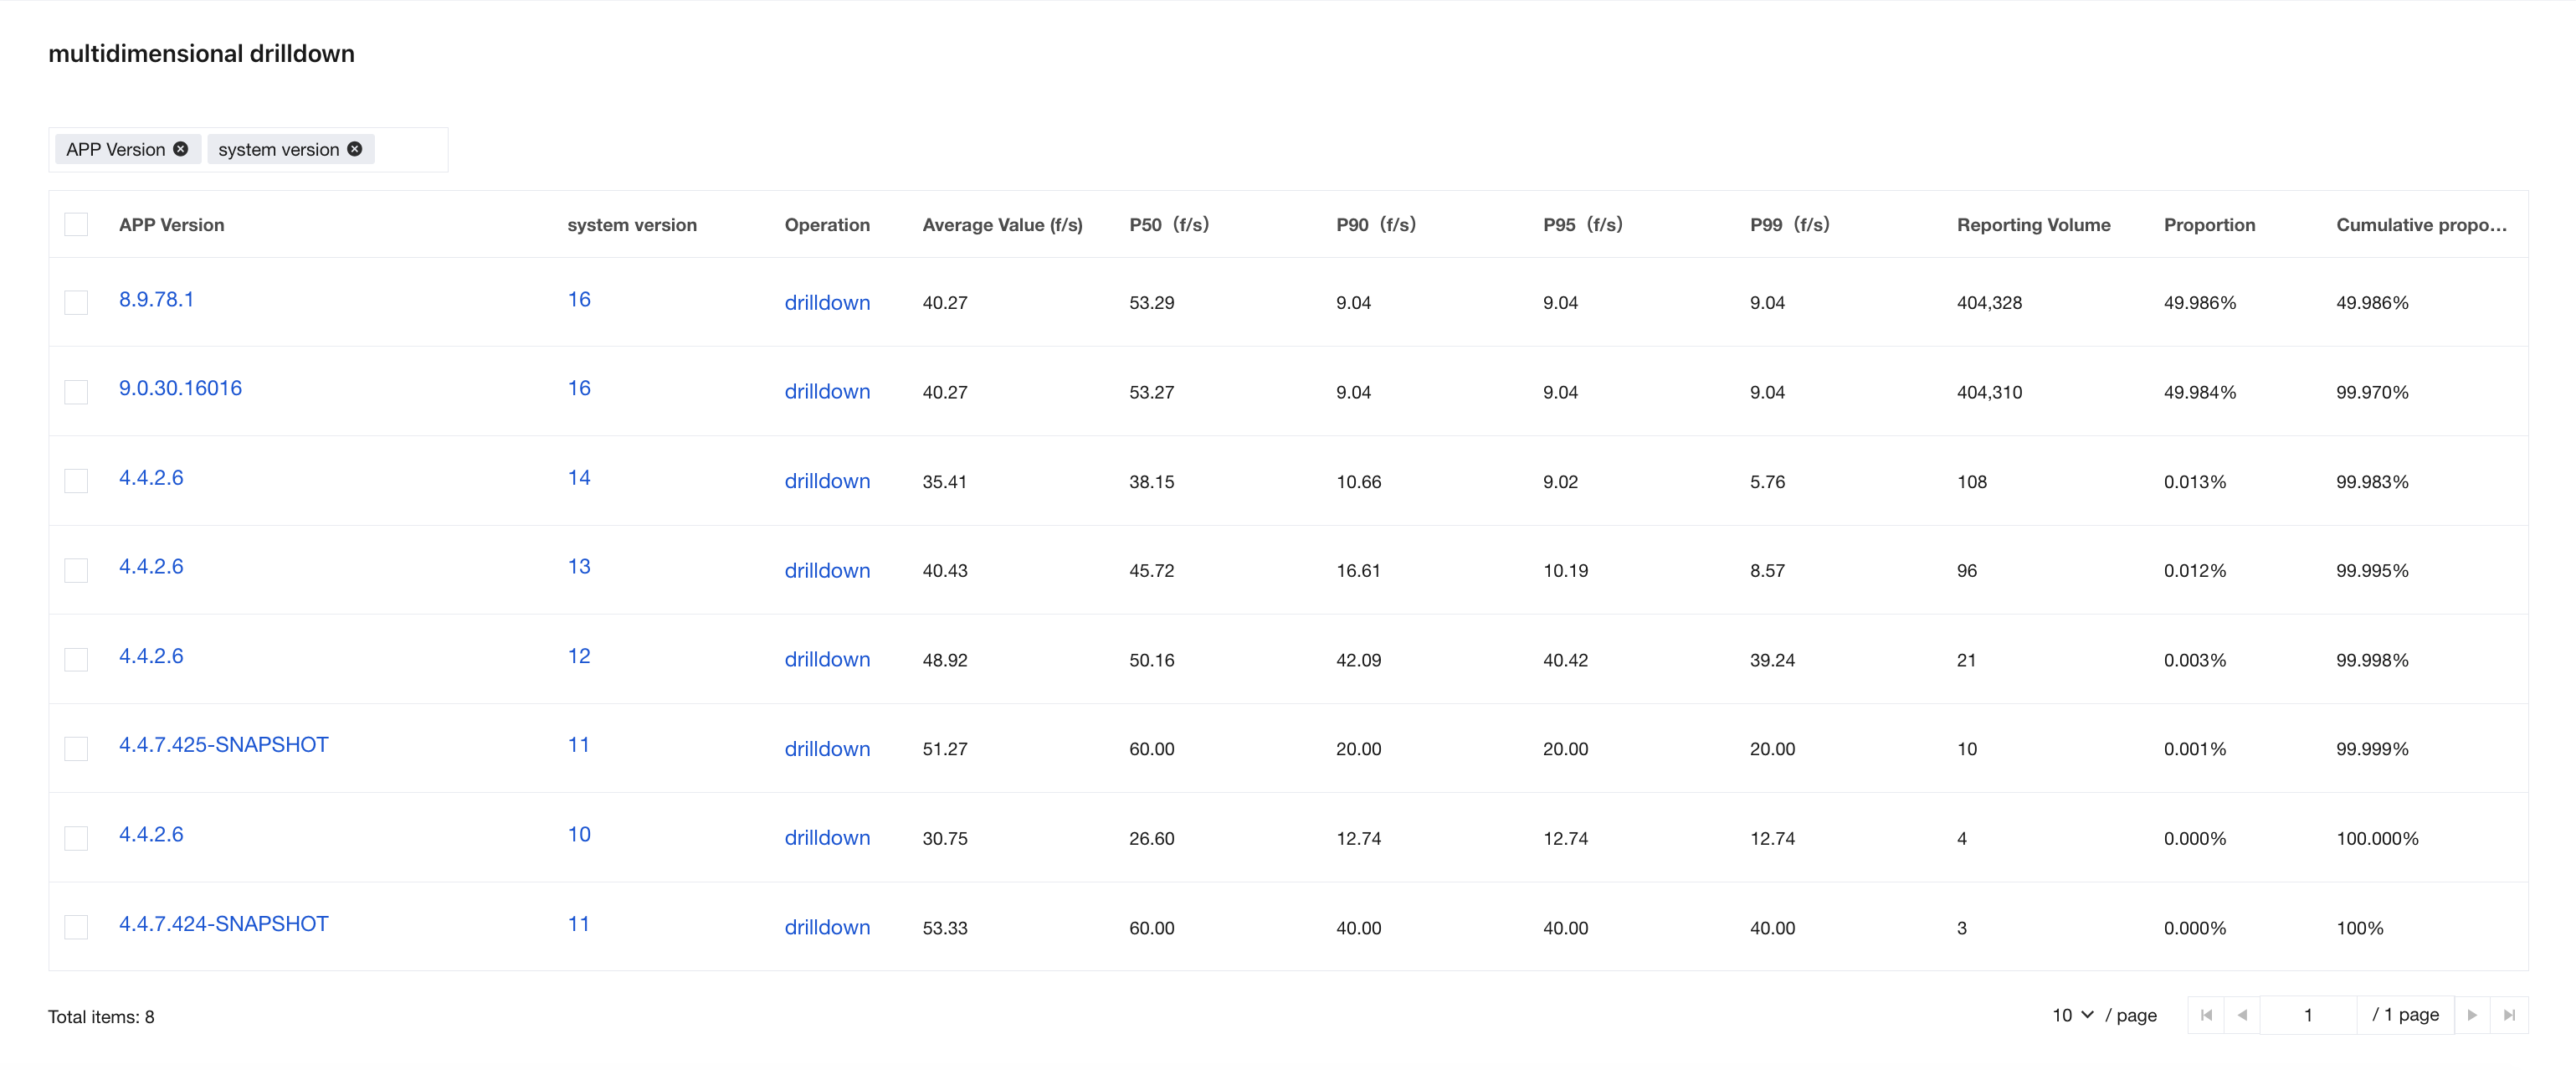
Multidimensional drilldown
In some cases, if you want to view data across all App Versions or all scenarios over a period of time, this can be addressed through multidimensional analysis.
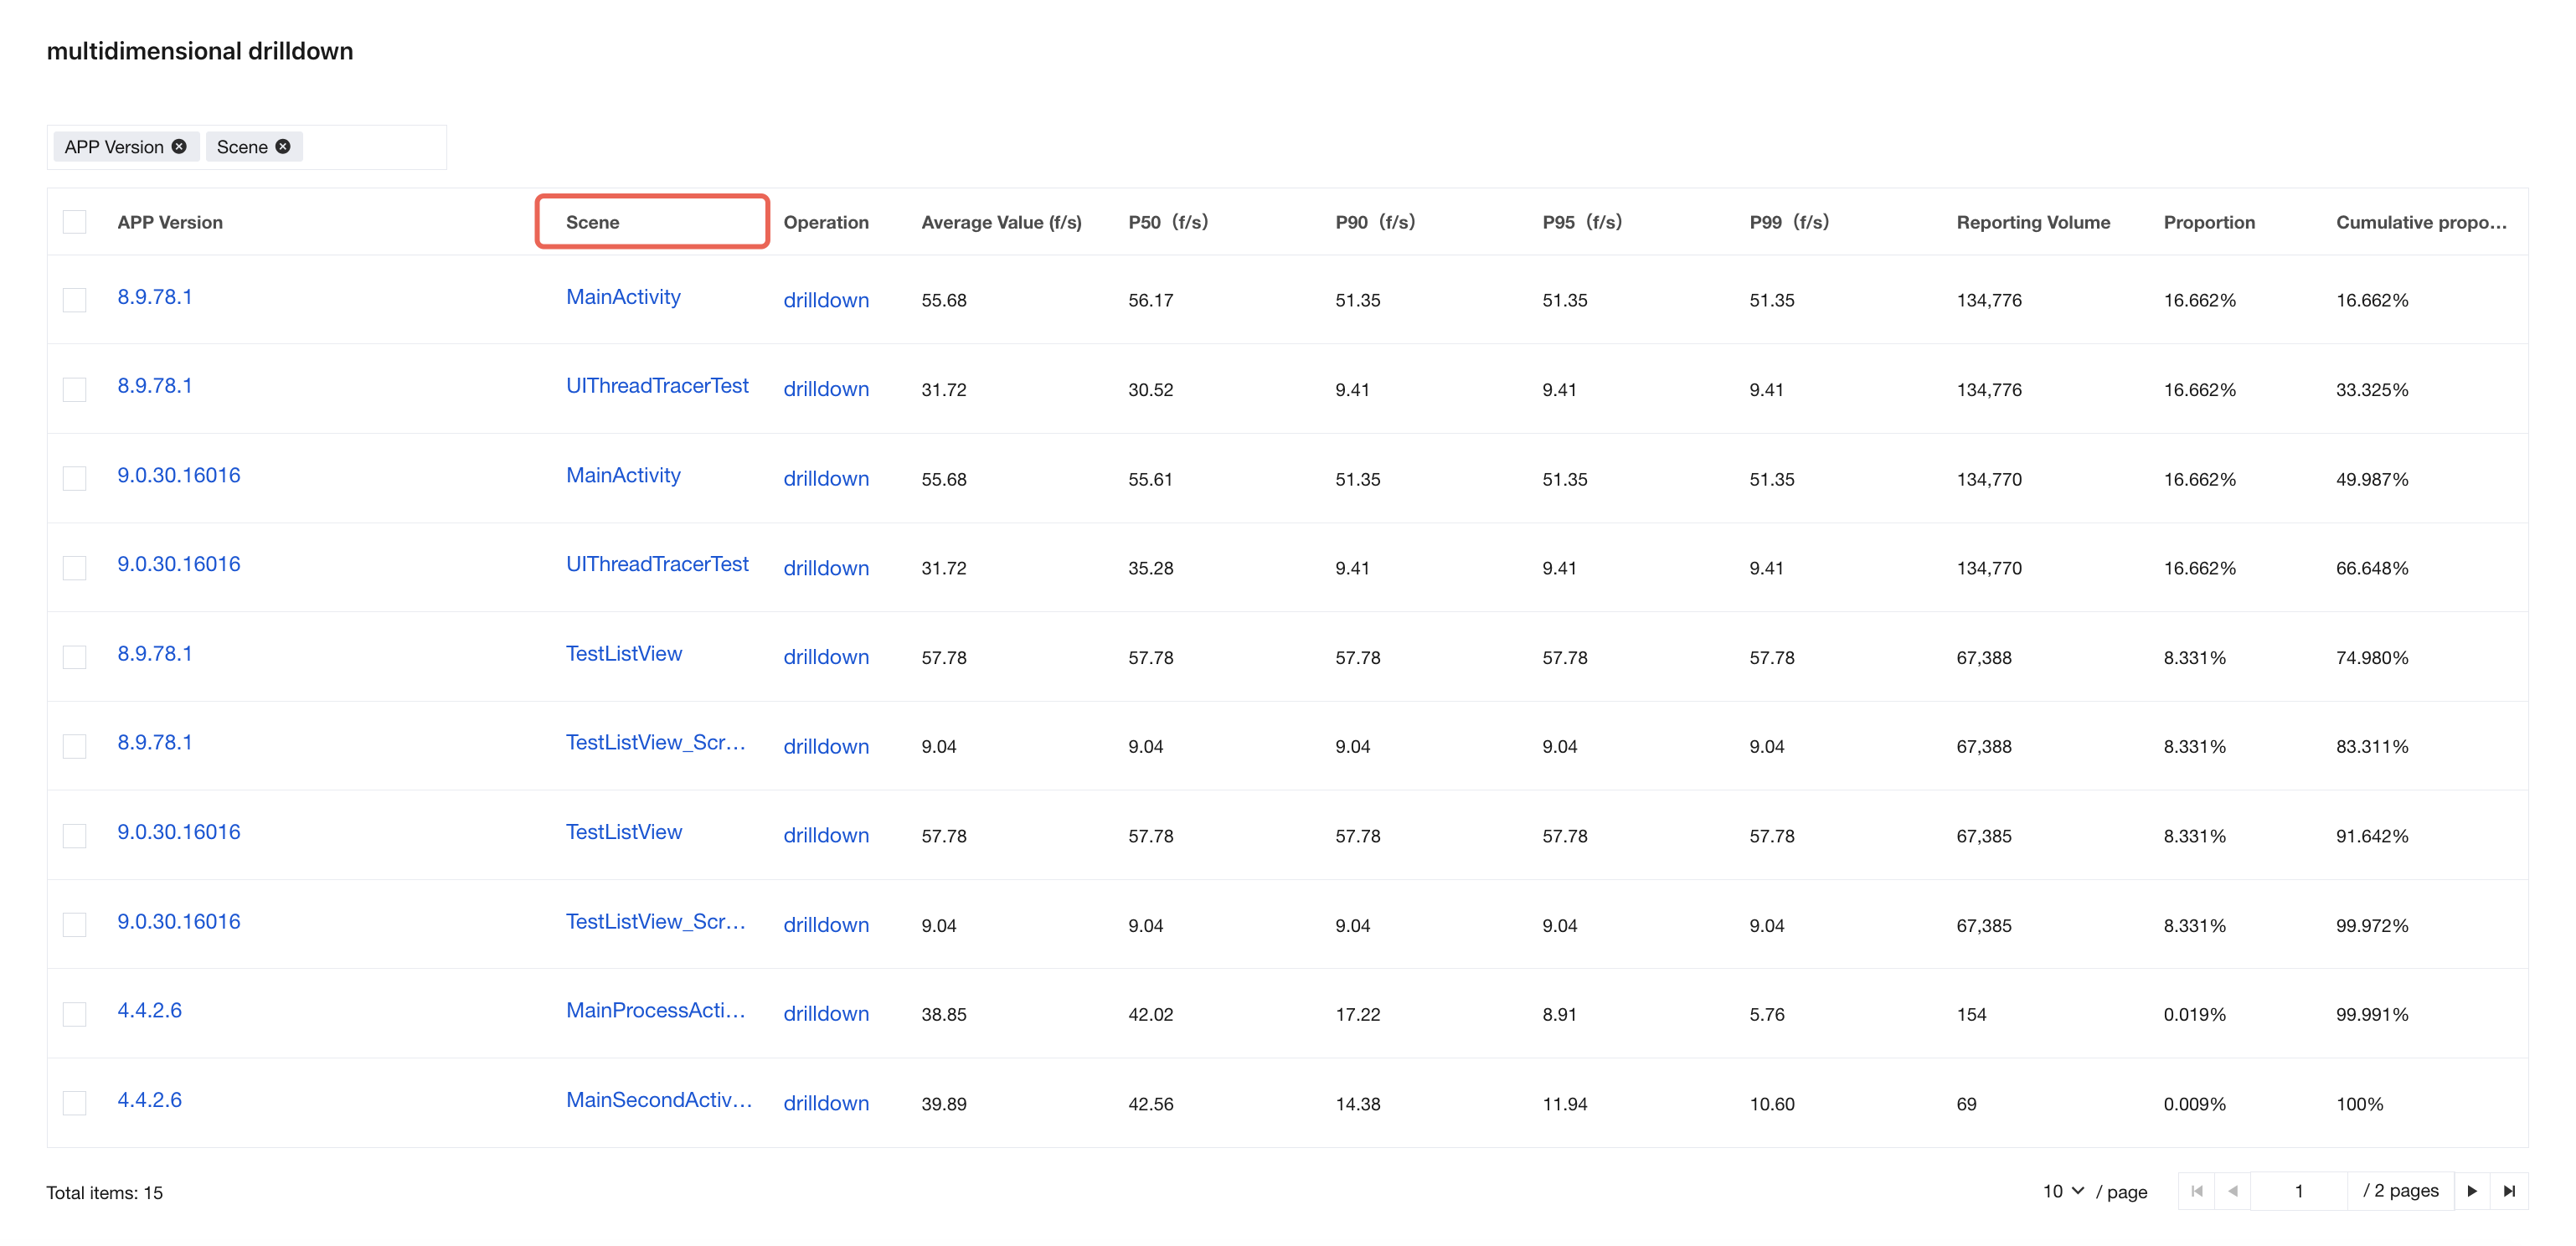
It also supports analyzing data for specified versions under specific scenarios.
problem monitoring
The core focus of lag Issue monitoring is to help users identify the causes of application lag. By monitoring the processing time of UI thread messages and implementing a high-frequency, continuous stack capturing policy, instances exceeding the threshold are reported to the server. Based on the lag stack tree, the server extracts key time-consuming characteristics, aggregates individual cases into Issues (problems), and generates a list of lag issues.
Problem List
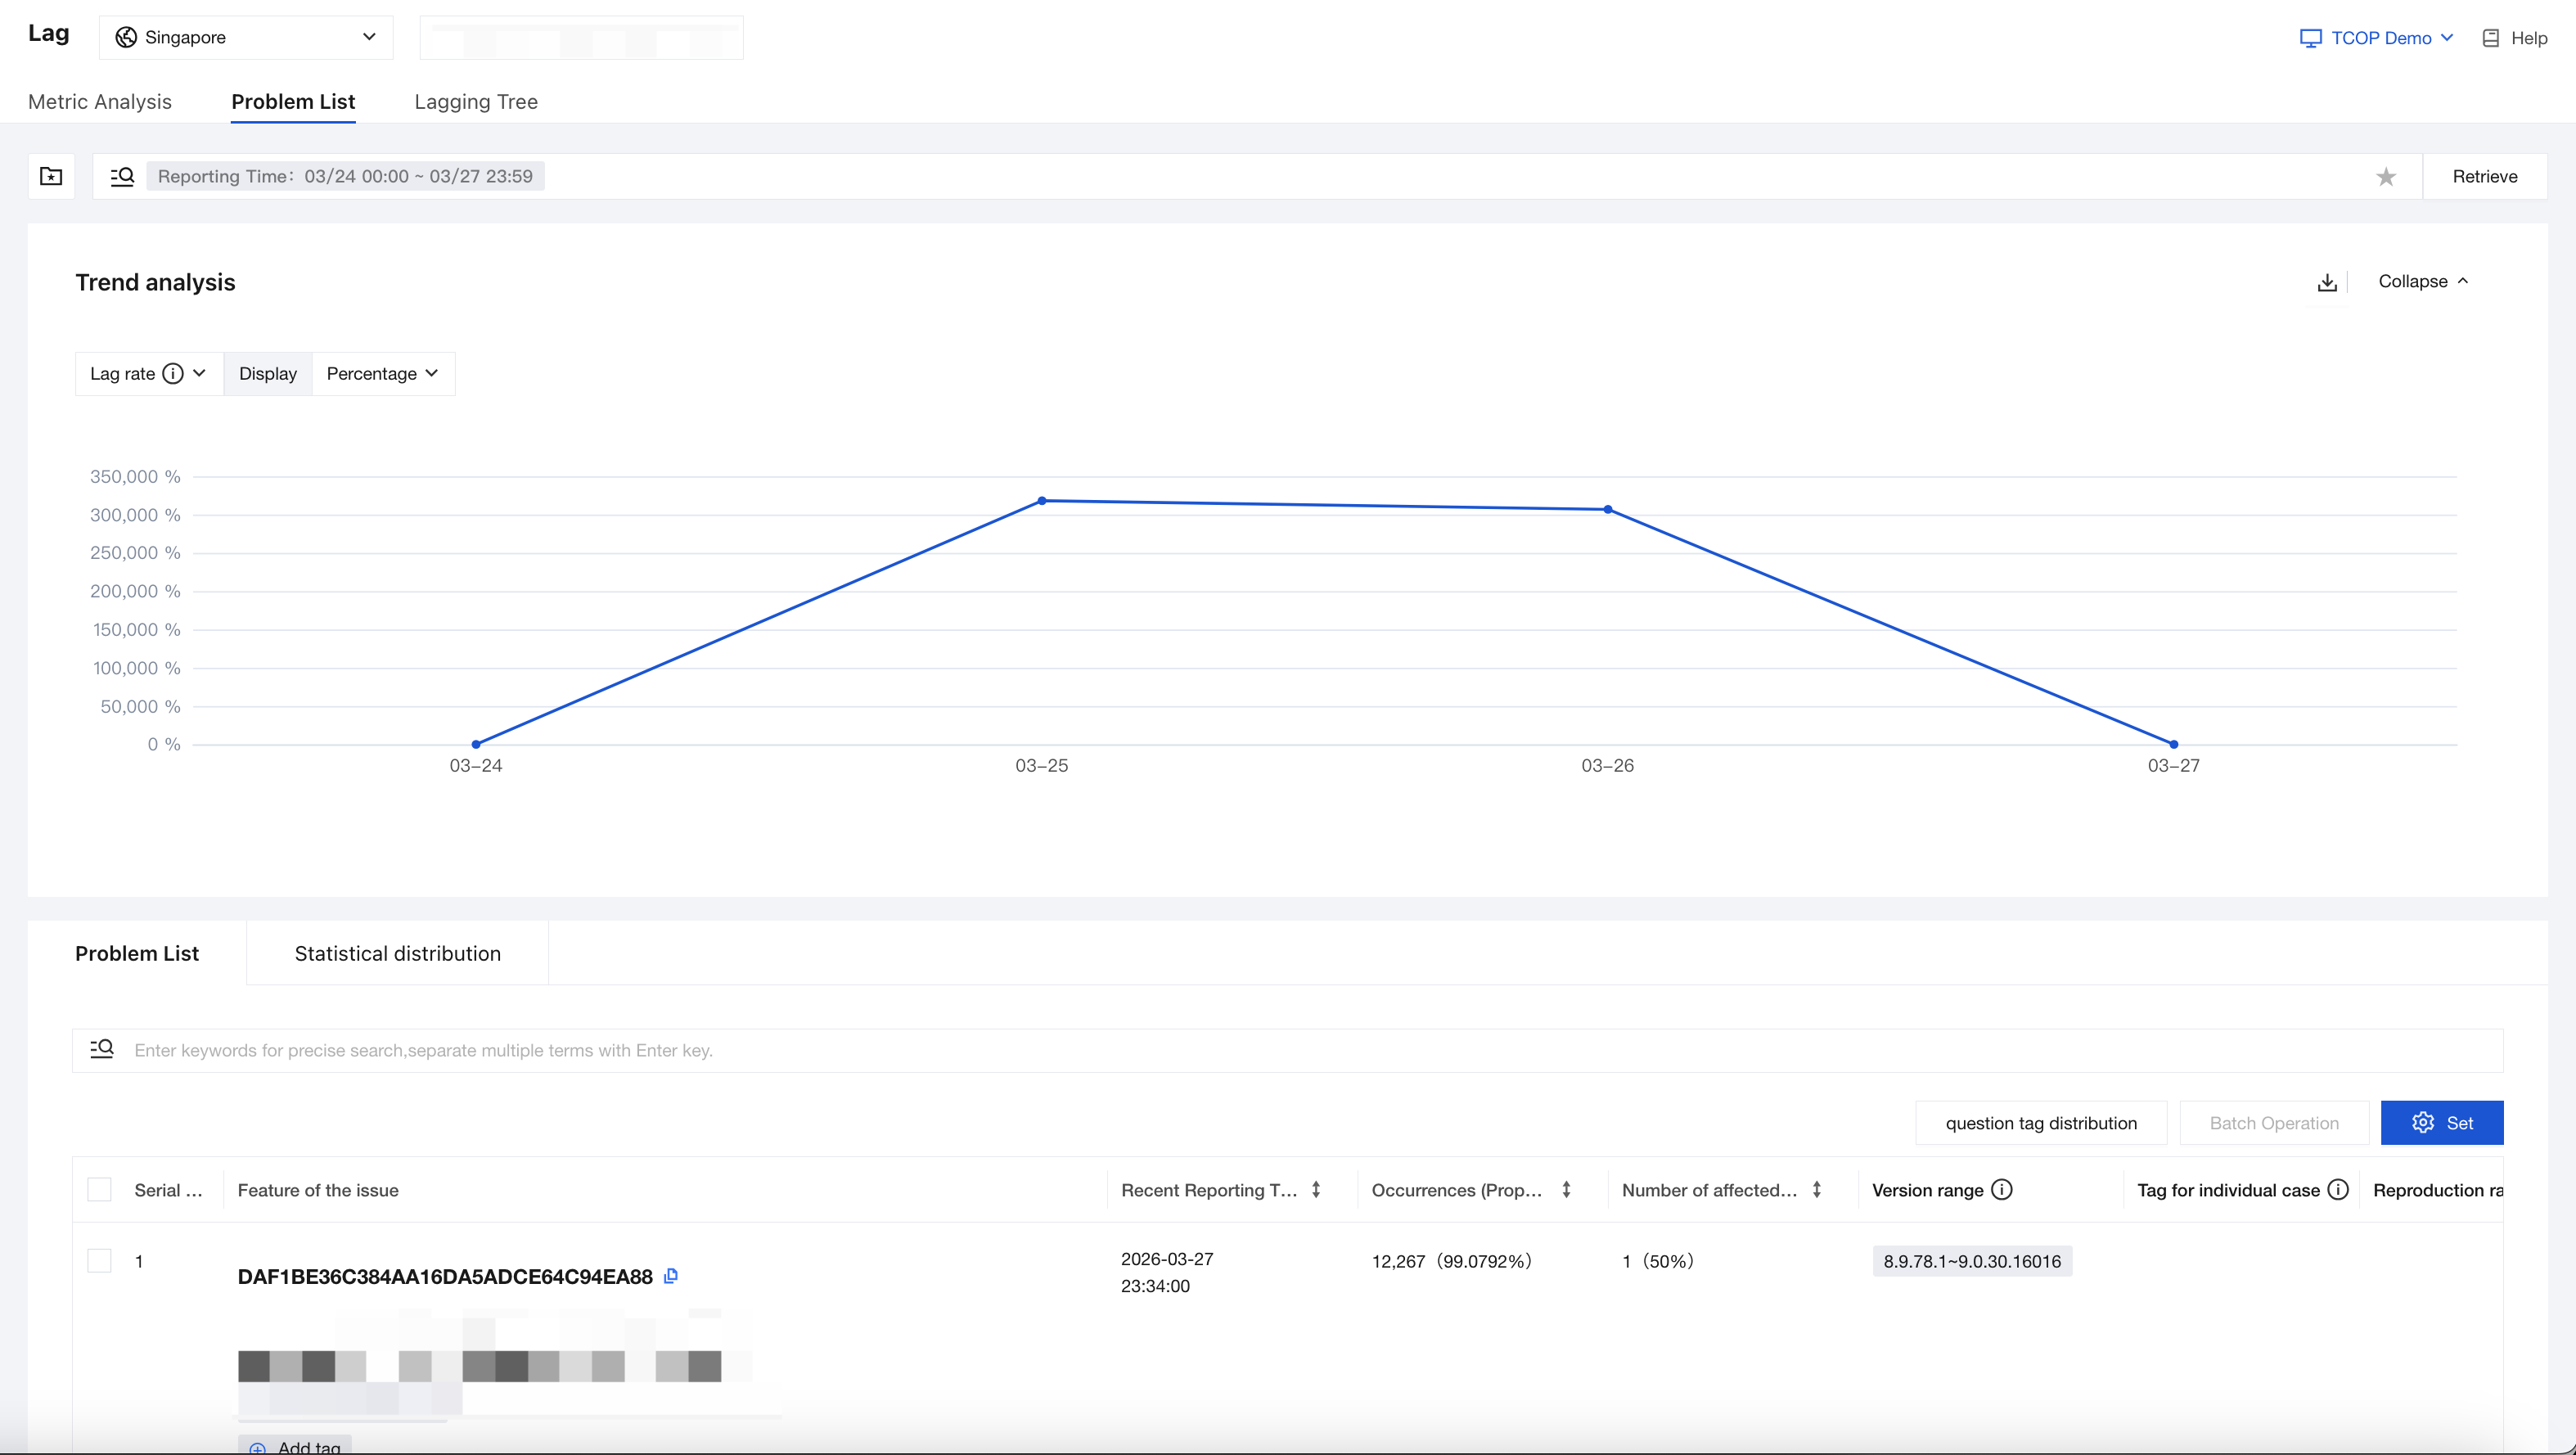
On the Lag > Problem List page, you can view data monitored for lag issues, with support for filtering and analyzing the data.
The lag issue list supports rich search criteria. Users can freely configure the desired search fields to display by clicking Edit Field. They can also adjust the display of the search criteria area by toggling Display filter and Collapse filters. The webpage will retain the user's selection;
After selecting the search criteria, click Retrieve to submit the query. Once results are retrieved, the page will automatically refresh.
The header section of the lag issue list displays summary information of query results, allowing users to see the number of issues meeting the criteria and the proportion of Top N issues.
Query results are sorted by the reported time of Issues by default. Each Issue includes characteristics, last reported time, average lag duration and its percentile values, average key stack time consumption and its percentile values, maximum leaf node time consumption percentile values, etc. Based on actual needs, users can freely select fields to display via Set.
Clicking on the issue ID allows users to go to the issue details and view the reporting specifics of an Issue.
When the list displays a large number of statistical fields, the result list becomes too wide to display completely. Users can swipe left or right to view all parts.
Users can also export the content of this page directly as data in table format.
Issue Details
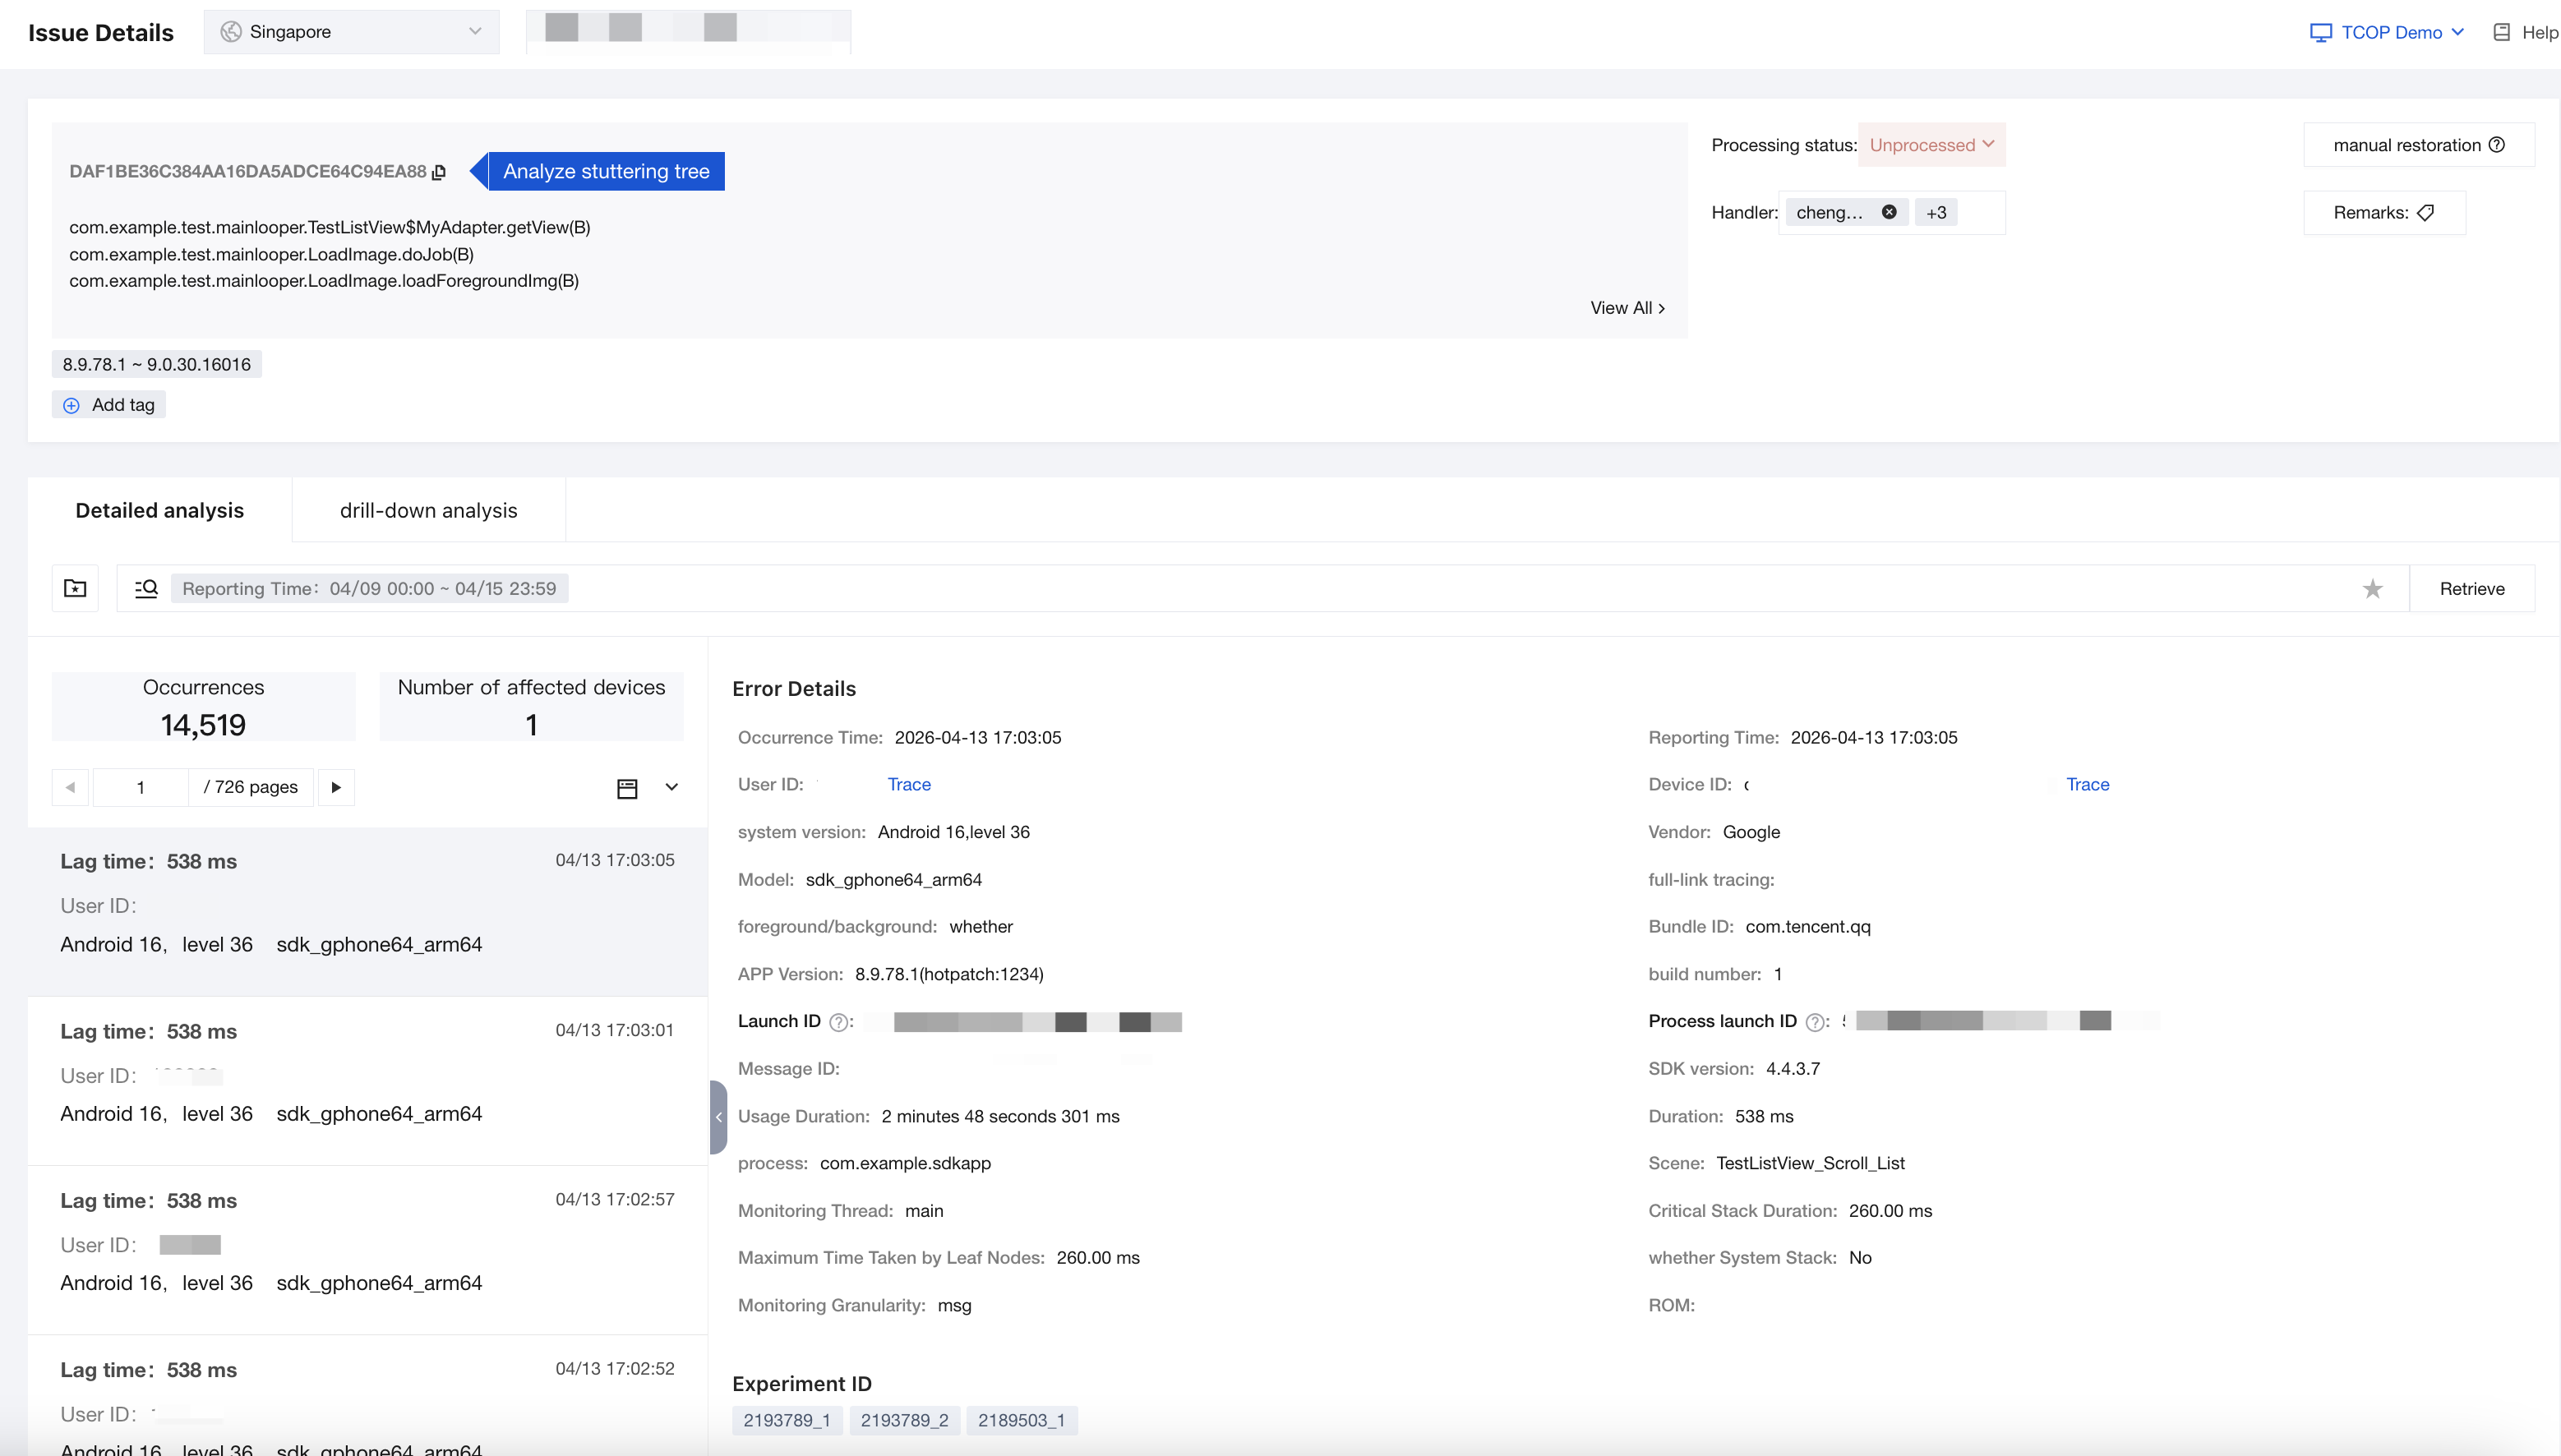
The issue details are divided into three parts: the header section, detailed analysis, and drill-down analysis.
The header section: includes descriptions at the Issue level, such as the version tag of the Issue, custom tags assigned by users, processing status, assignee, Issue ID, characteristics, etc.
Case Analysis: focuses on analyzing laglag cases. Users can query cases meeting specific criteria using search conditions.
Drill-down analysis: focuses on analyzing the entire Issue, including trend analysis, statistical distribution, error stack analysis, etc.
Case Analysis
When viewing a lag case, you can focus on the following information:
1. Prioritize viewing the total lag time consumption, key stack time consumption, and maximum leaf node time consumption. This information helps quickly determine the type of lag.
2. Then, proceed to analyze the stack details of the lag. The current stack snapshot of the lag is presented in three different ways: time slices, stack tree, and flame graph.
Typically, start by analyzing the flame graph, as it visually presents an overview of the lag scenario.
Then proceed to analyze stack details using time slices or flame graphs.
The time consumption in flame graphs and stack trees is estimated through stack sampling.
The lag time consumption is accurate, indicating the execution time of a message on the UI thread.
Lag Time Consumption and Stack Time Consumption:
The lag time consumption indicates the accurate execution duration of a message on the UI thread. The stack time consumption is estimated based on stack sampling frequency and intervals. The current lag monitoring system detects application lag by tracking the execution time of UI thread messages.
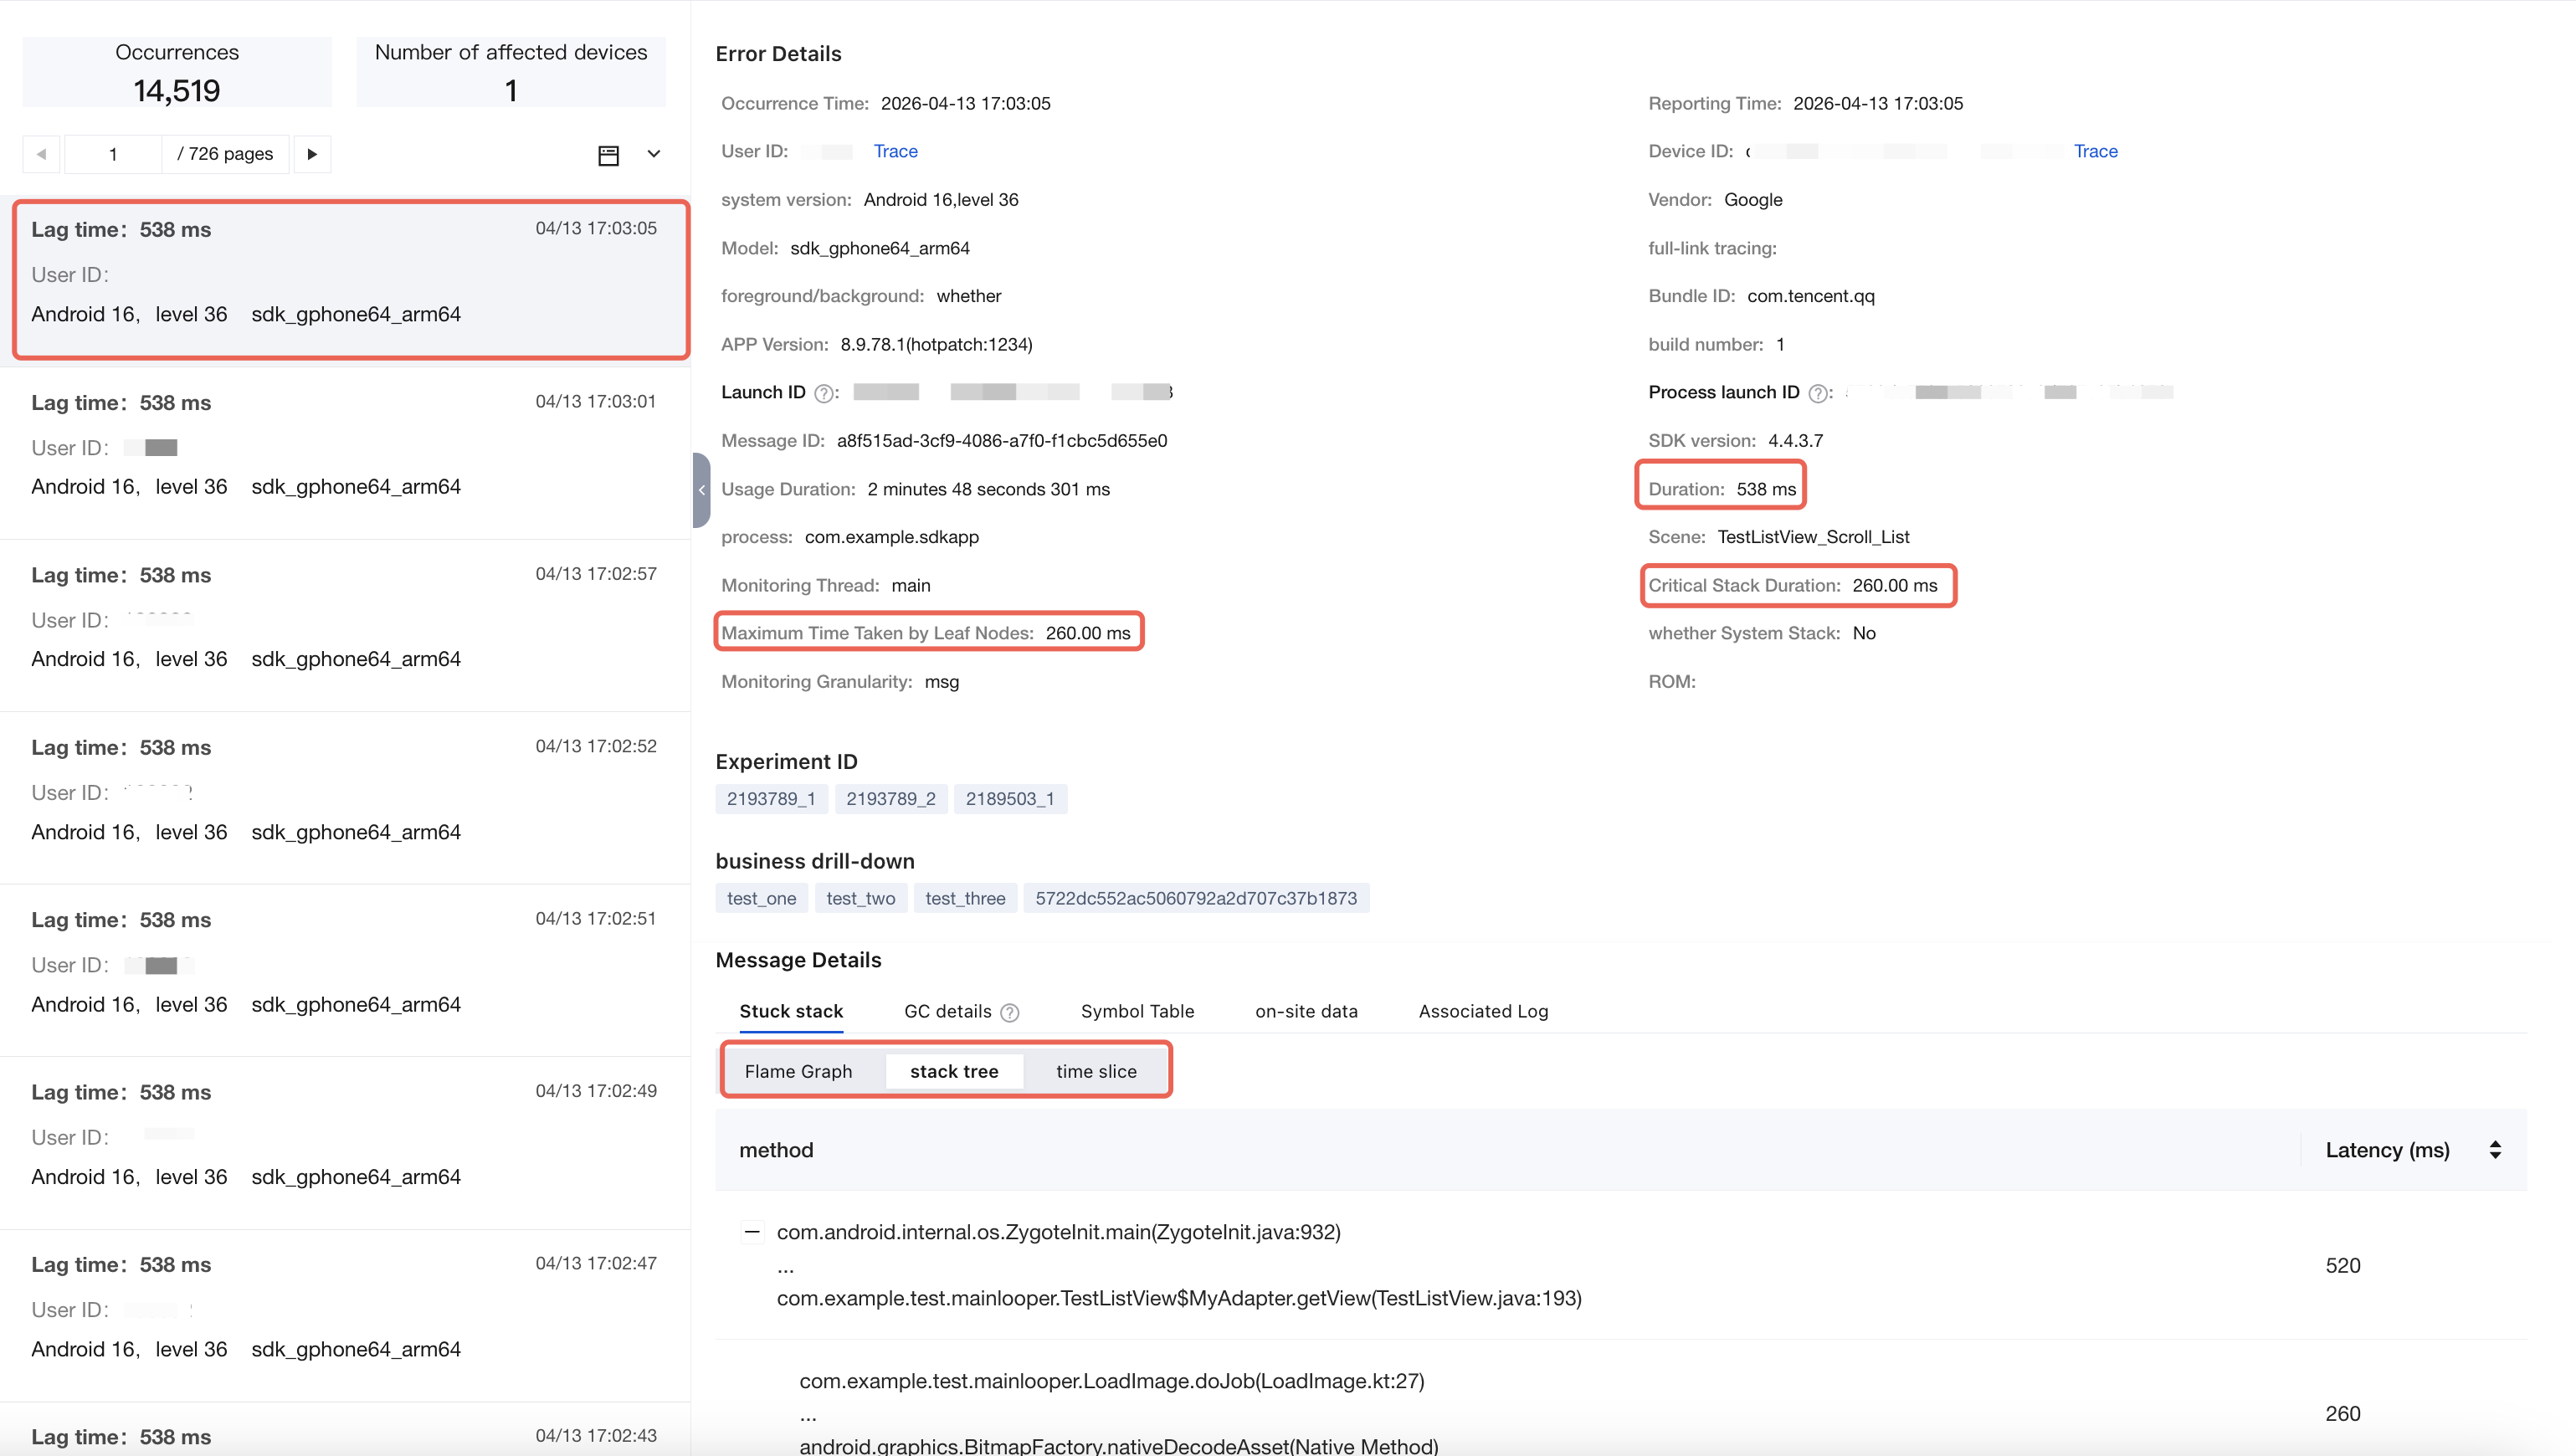
Taking the following figure as an example, this stack was captured in 6 consecutive frames. With the current stack sampling interval of 52ms, the estimated time consumption for the stack is 52 x 6 = 312ms.
Note:
Stack Sampling Interval: Android and iOS devices may have different stack sampling intervals. You can derive the interval for this specific case by combining the number of stack samples shown in time slices with the calculated stack sampling time consumption.
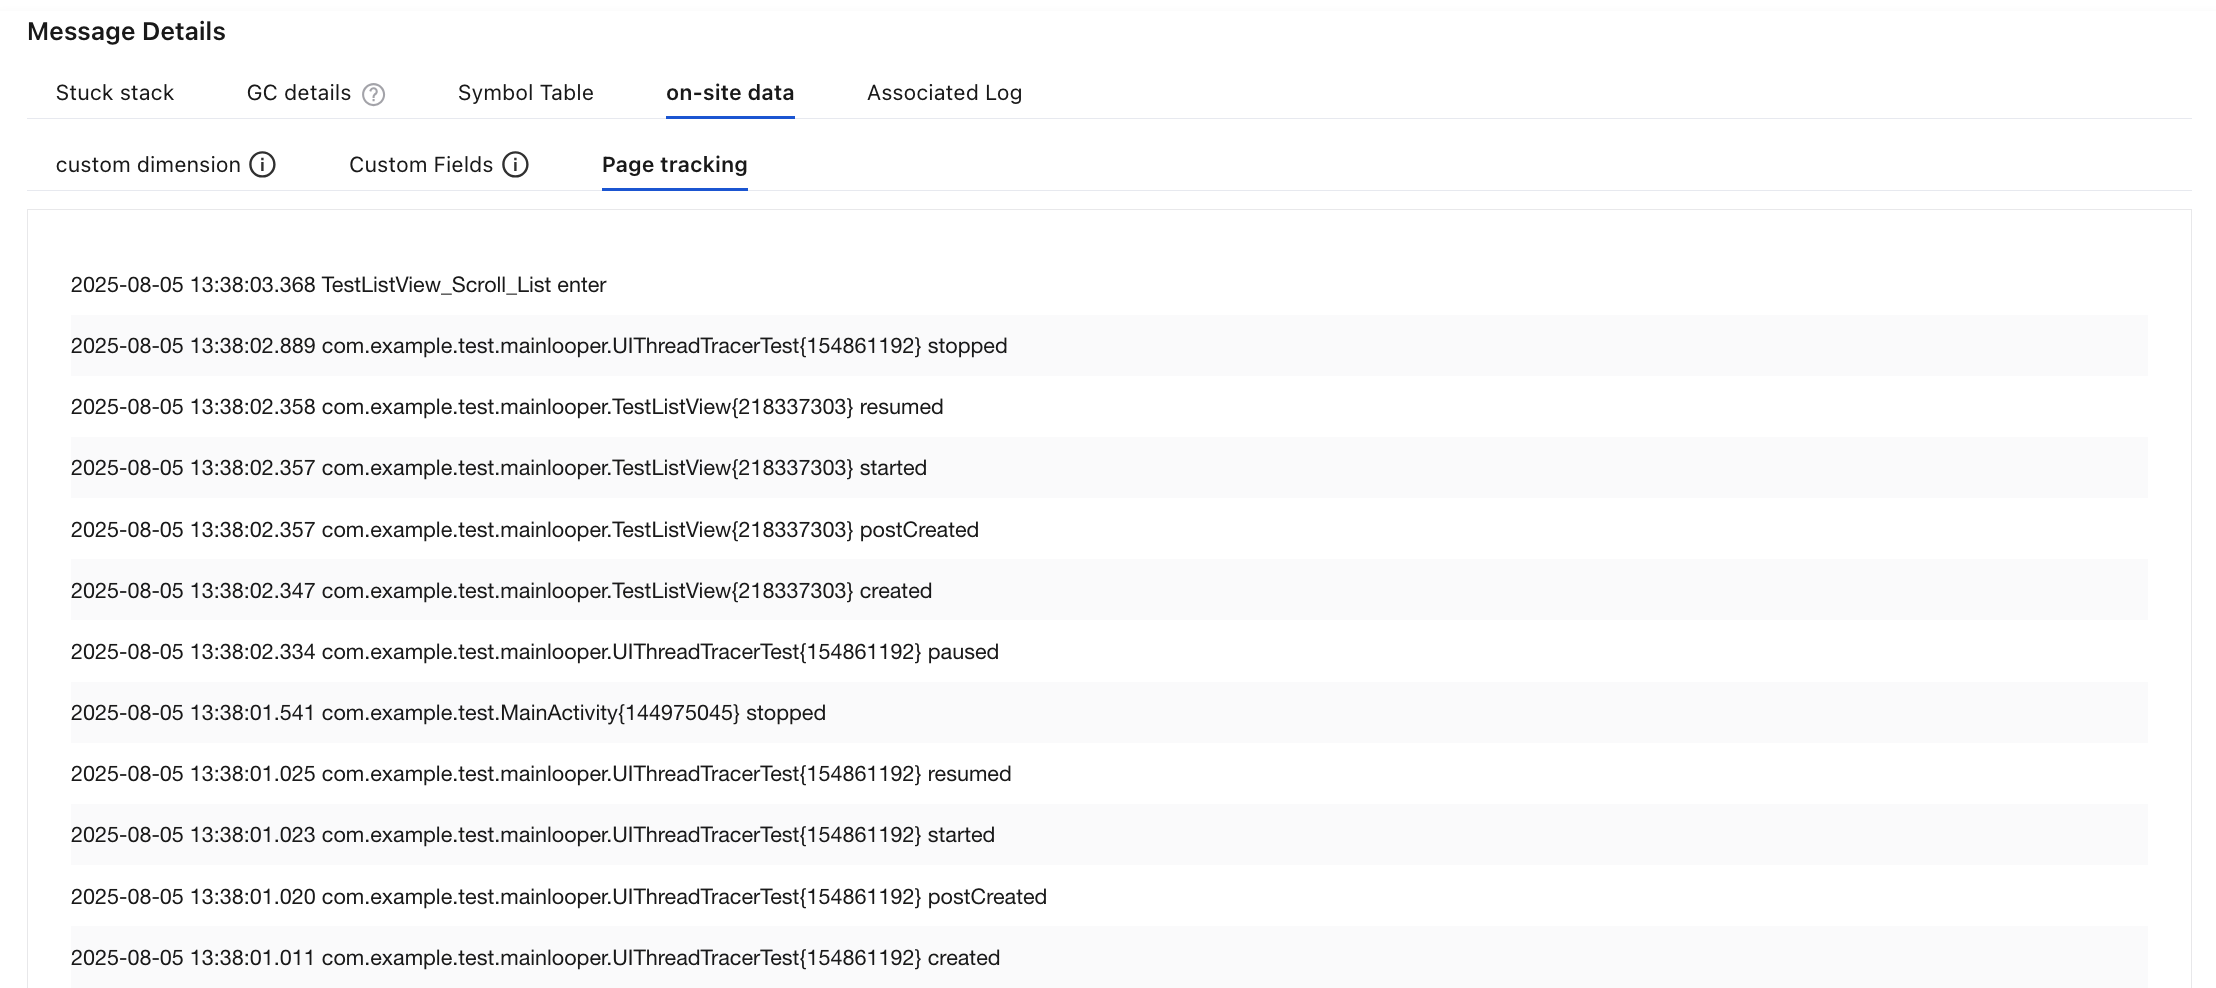
Additionally, users can further analyze the lag scenario by combining operation logs and on-site data.
Drill-down analysis
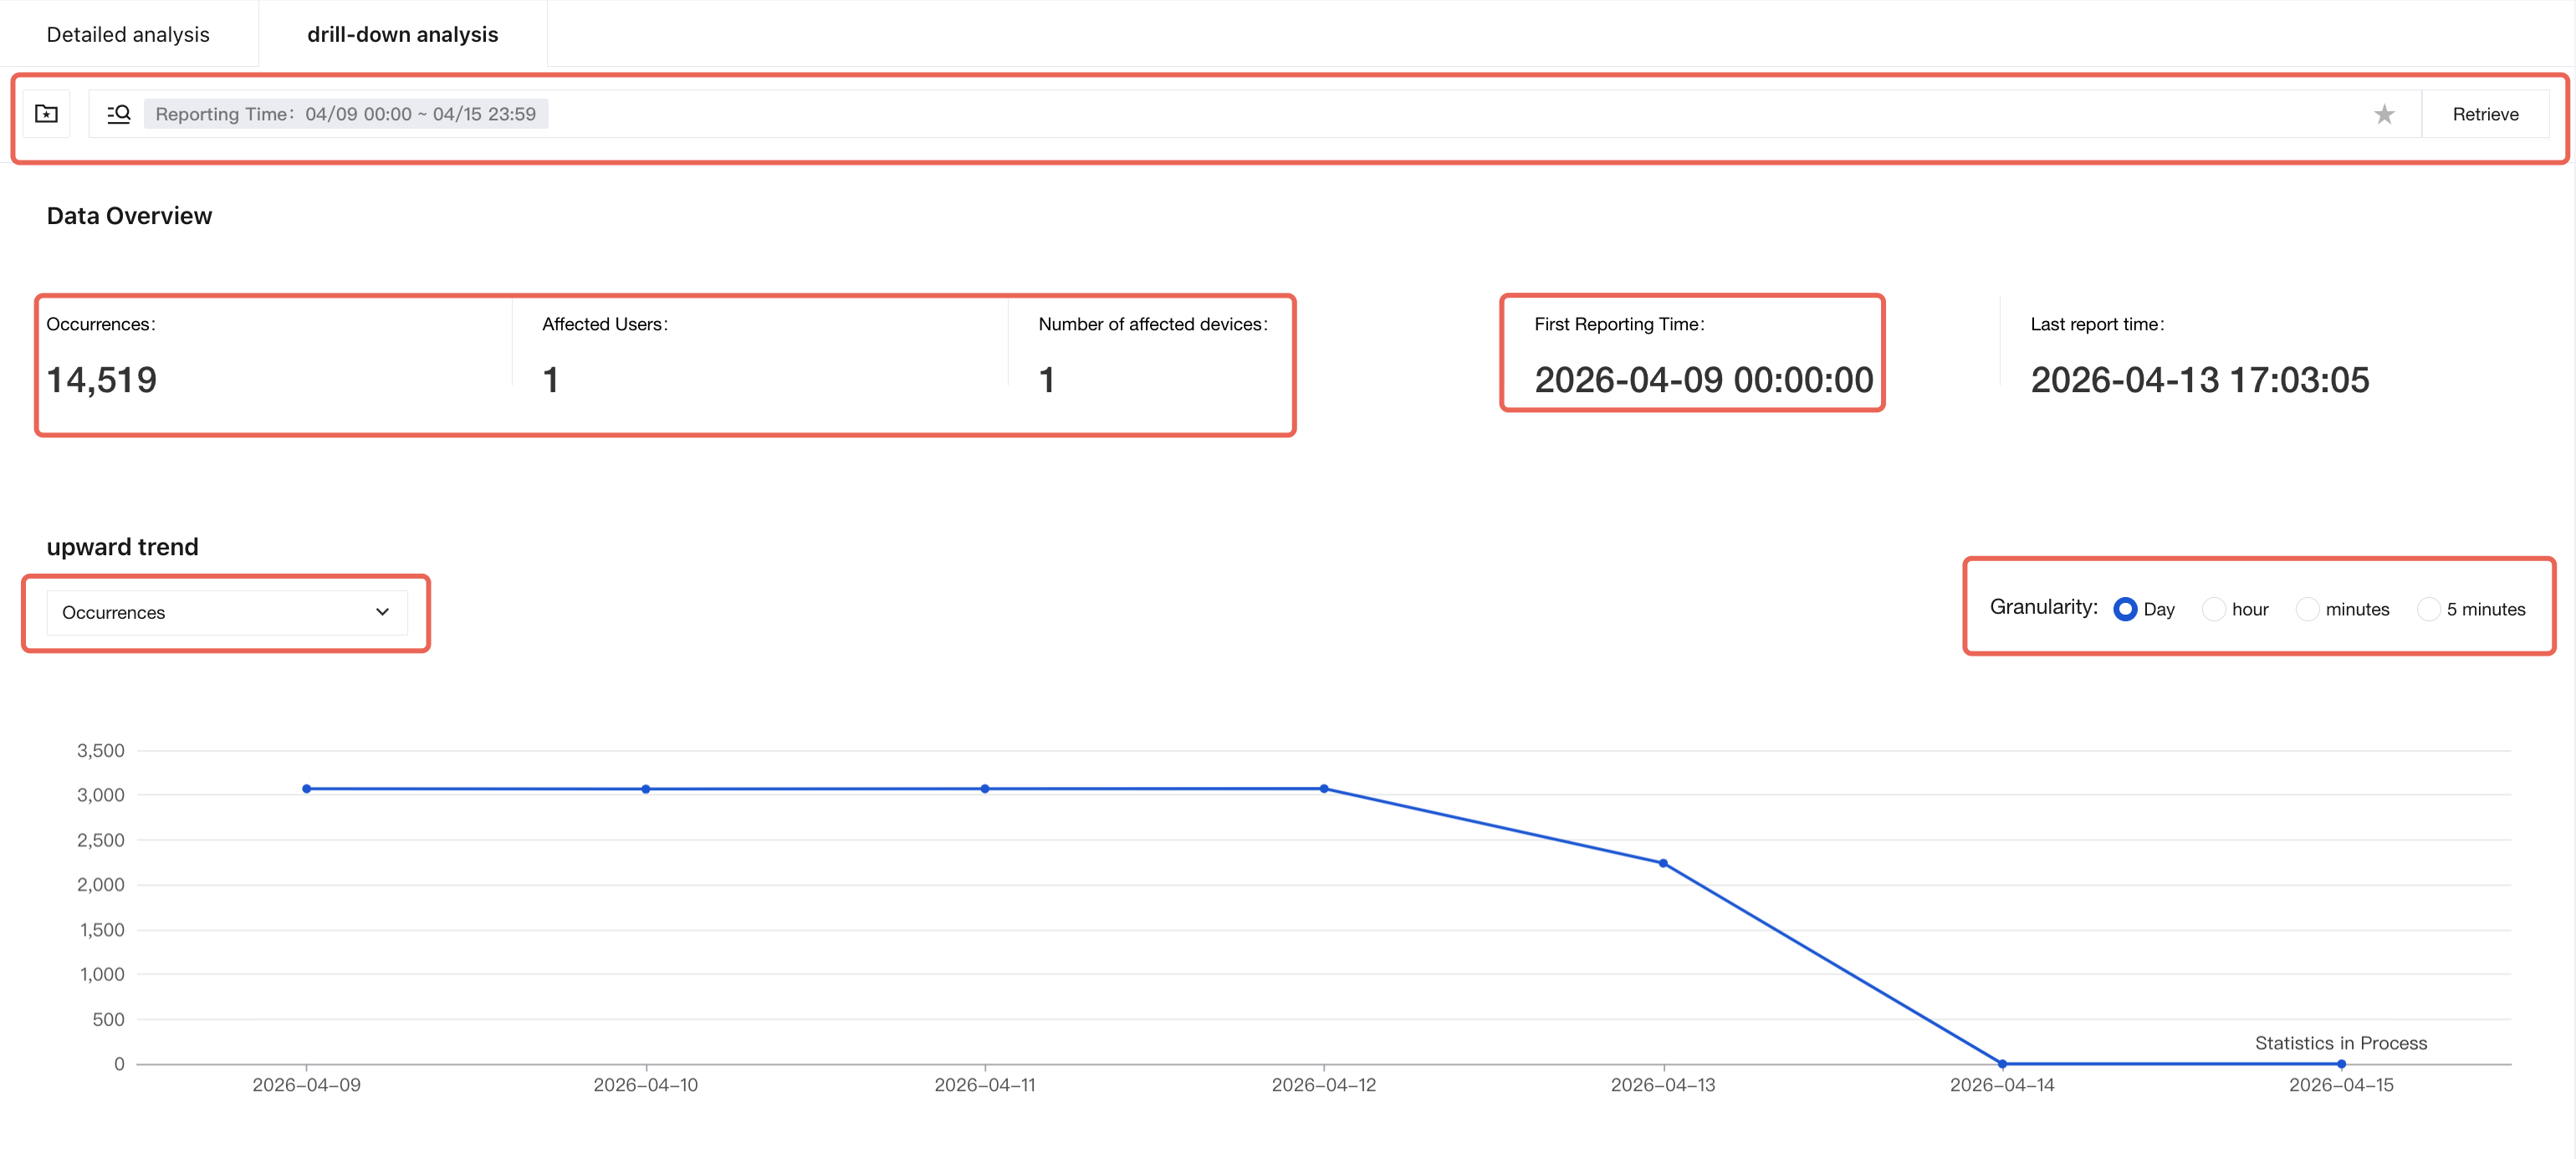
Users can perform drill-down analysis to view the reporting trends of issues and their distribution across various fields.
Drill-down analysis allows users to set search criteria and view statistical results under specified conditions.
The upward trend supports viewing data across different statistical dimensions, including occurrence count, number of affected users (deduplicated by user ID), and number of affected devices (deduplicated by device ID). It supports data viewing at various aggregation granularities, with a minimum granularity of minute-level.
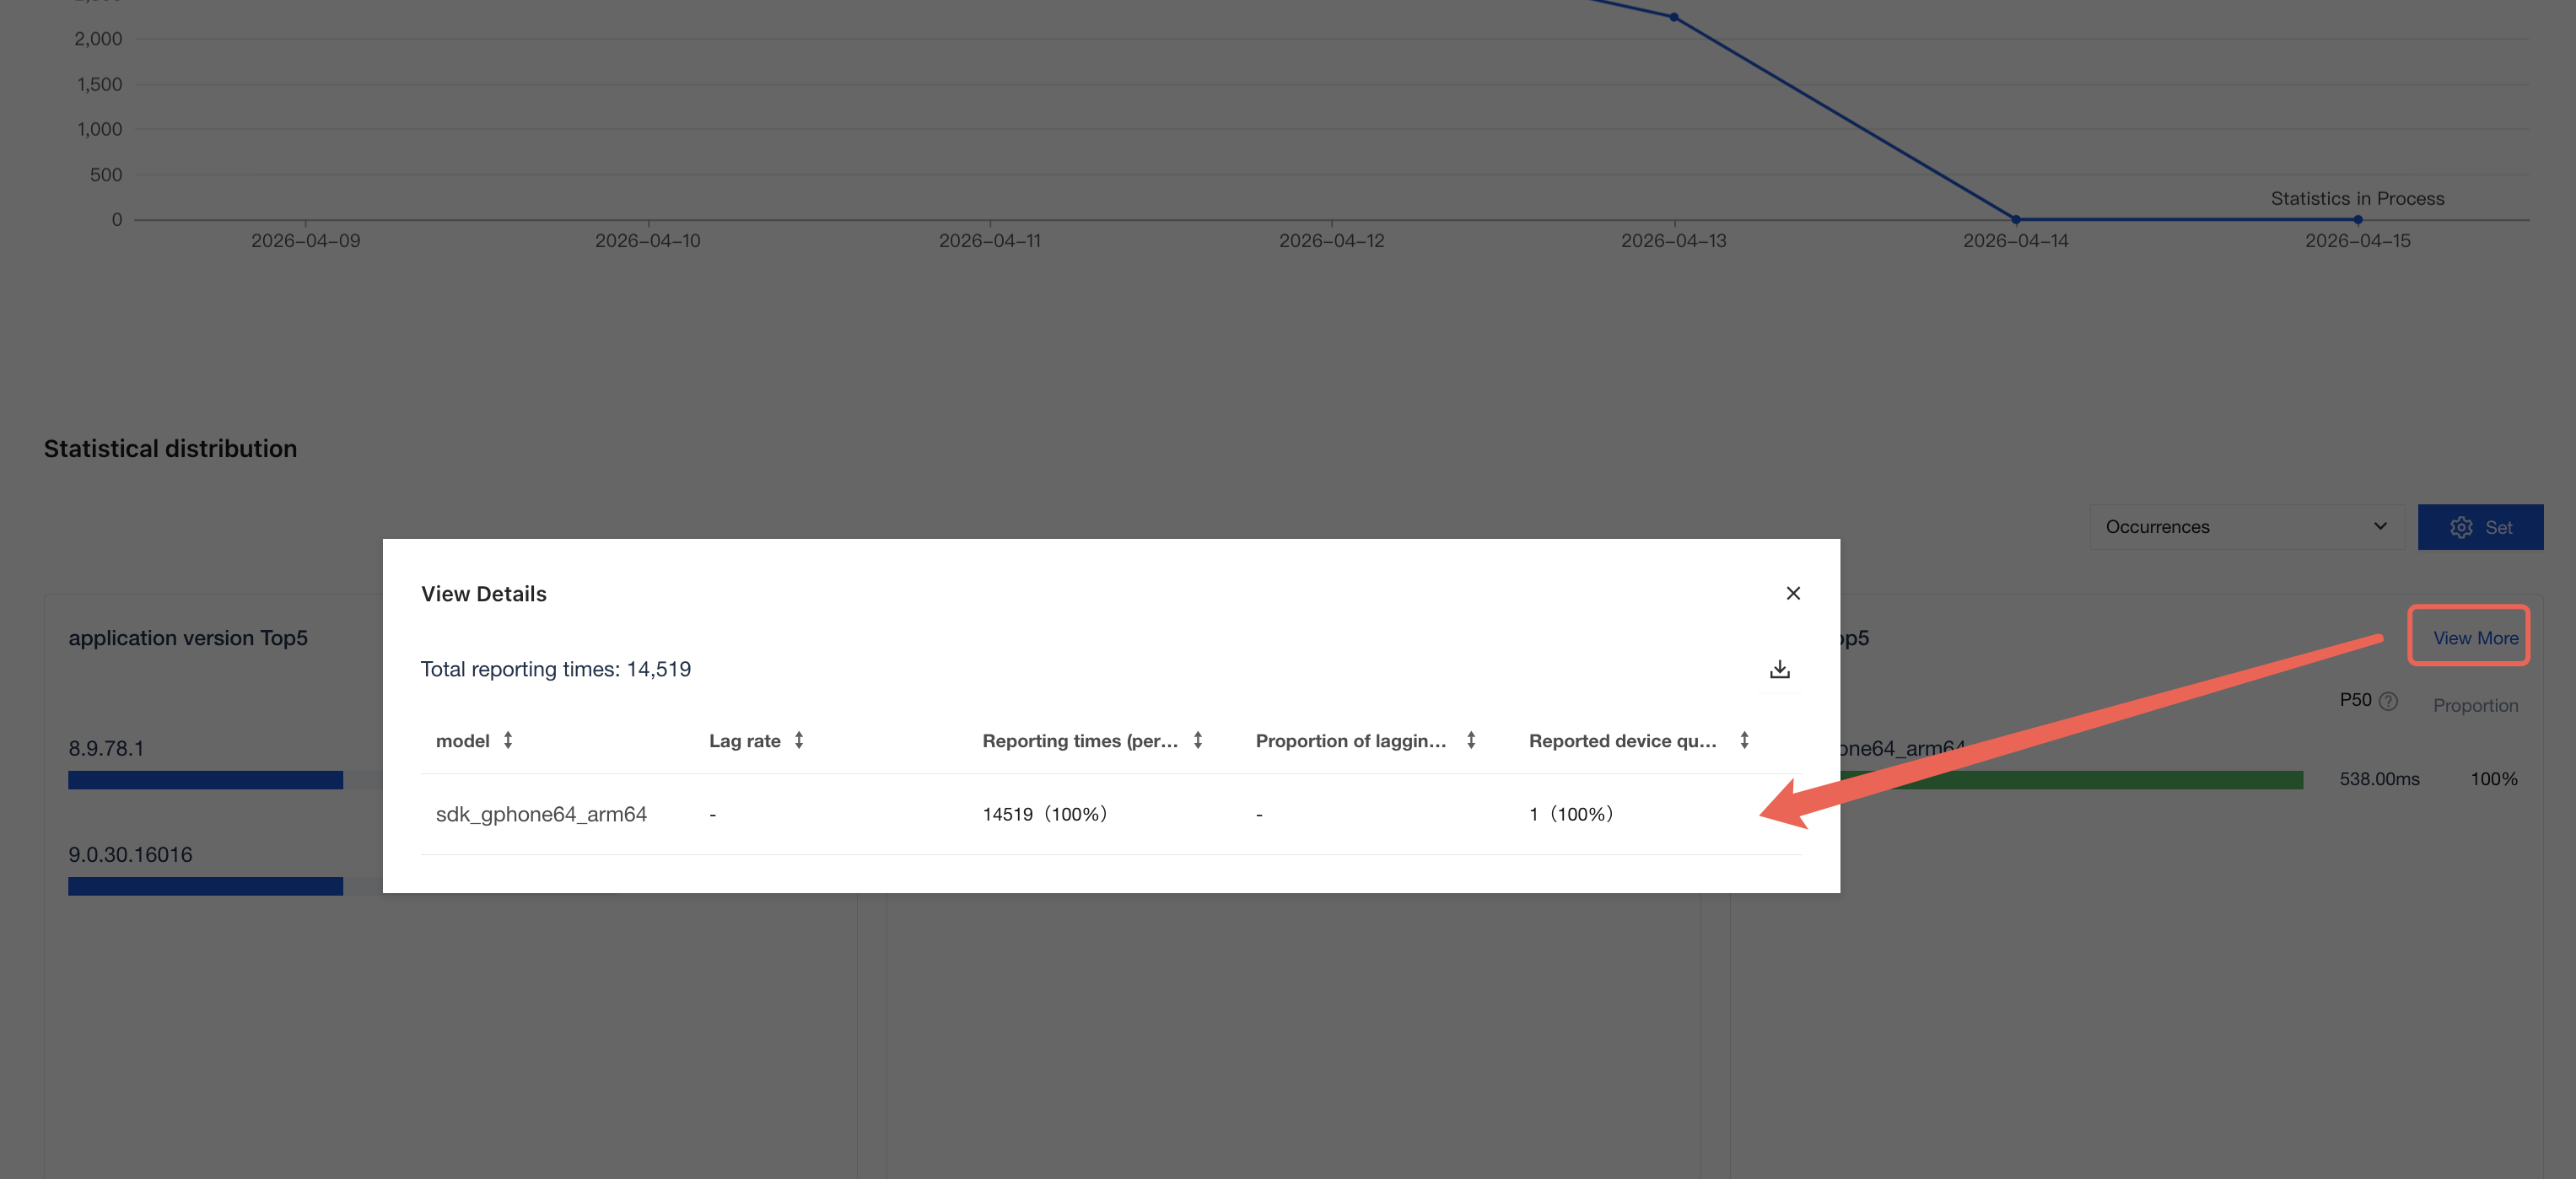
Statistical distribution refers to viewing the distribution status across designated fields under specified search conditions.
Note:
Valid Reports for Statistical Distribution refer to the reporting status where this field contains valid values. In some scenarios, certain fields may have unavailable or invalid values. Therefore, even with identical search conditions, the number of valid reports may vary across different fields.
Help and Support
Was this page helpful?
You can also Contact sales or Submit a Ticket for help.
Help us improve! Rate your documentation experience in 5 mins.
Feedback