Memory
Download
Focus Mode
Font Size
This article introduces the types of metrics supported by the platform memory monitoring module, how to enable monitoring configurations, and the analysis of various indicators.
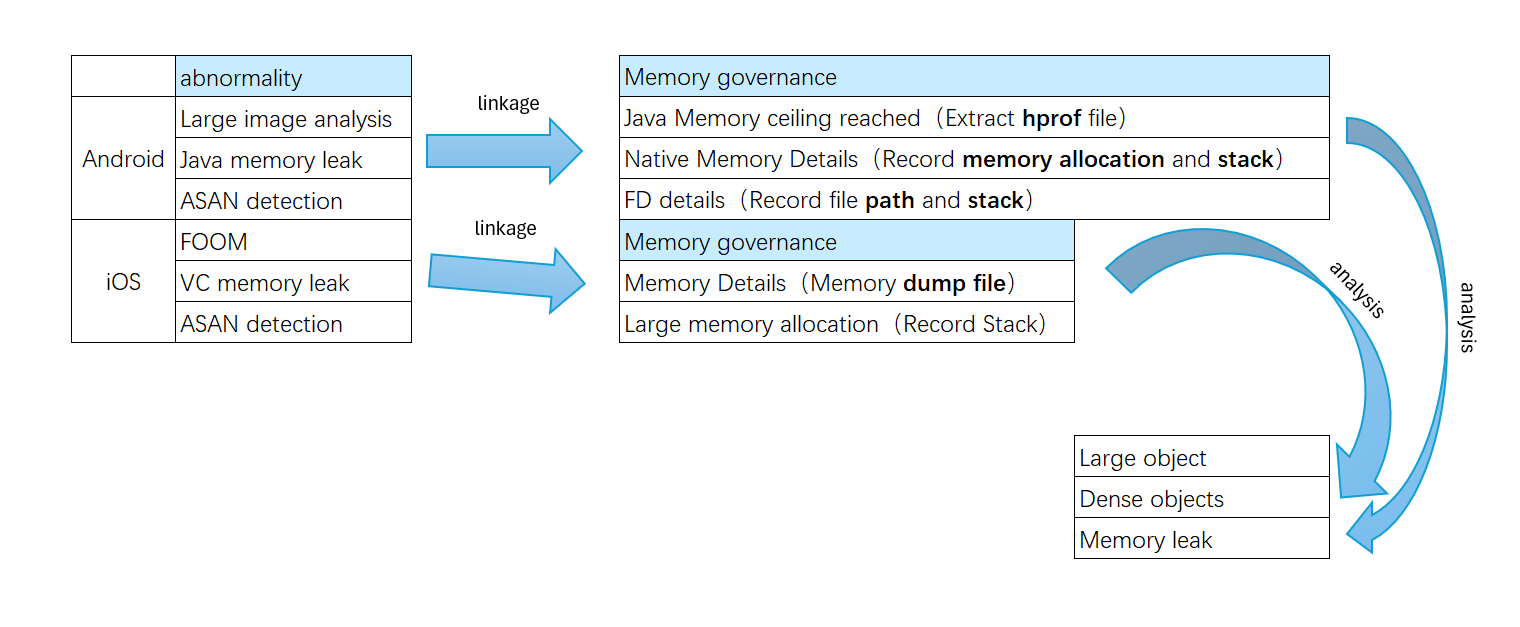
The following figure illustrates the correlation and analysis logic in memory anomaly and memory governance for the Android and iOS platforms.
Android
Overview
In software development activities, memory management is a particularly complex task, and most tricky bugs are fundamentally related to memory. Memory issues can be categorized into the following three types: memory leaks, memory abuse, and memory access exceptions.
Memory Leak: When memory that should be released is not freed, it causes a memory leak issue. After a leak occurs, the process memory continues to grow, eventually leading to problems such as OOM.
Memory Abuse: Using mechanisms like caching to enhance program performance is a common optimization technique. However, its effectiveness generally depends on the management of cached objects. Slight abnormalities may cache many unused objects, which not only fails to optimize performance but also prevents other modules from allocating memory, thereby causing memory-related performance issues such as GC stuttering.
Memory Access Exception: Memory access exception refers to common issues such as segmentation faults and memory out-of-bounds access. These types of problems are generally difficult to analyze. For instance, in memory out-of-bounds access, there might be no immediate exception at the time of access; it simply corrupts the value at certain addresses. Later, when other modules use this memory, it may trigger issues like segmentation faults. However, since it's unknown who corrupted the memory, even knowing the stack trace of the segmentation fault is usually of no help.
Memory issues can severely impact fundamental user experiences, such as crashes, black screens, and stuttering, making monitoring for such problems crucial. Due to frequent usage scenarios and memory abuse, monitoring and identifying memory issues pose significant challenges. To address this, the platform's memory monitoring is primarily divided into abnormal monitoring and memory governance.
Exception Monitoring: For abnormal situations, the platform provides precise log information, allowing users to directly submit tickets for follow-up, such as Activity leaks, memory out-of-bounds access, large bitmaps, etc.
Memory Governance: Provides capabilities focused on memory governance, such as Java memory details, FD details, and Native memory details. Examples include leakage chains of Activities or stack traces for memory out-of-bounds access. Capabilities like Java memory details and FD details capture log information and report to the backend when resources such as Java memory or FD resources are nearly exhausted. This allows analysis of suspected issues, such as reference chains of oversized Java objects or stack traces indicating excessive FD resource consumption. Based on this information, users can directly identify or further analyze the root causes of problems.
Metric Analysis
Memory metrics are statistical data for overall users, allowing observation of the application's overall memory usage. Additionally, by comparing metrics horizontally or vertically, users can detect whether memory indicators show deterioration. Currently, Android memory monitoring metrics primarily include two data points: memory peak and FD peak touch rate. These can be viewed on the Metric Analysis page under Memory on the left side of the interface.
Memory Peak
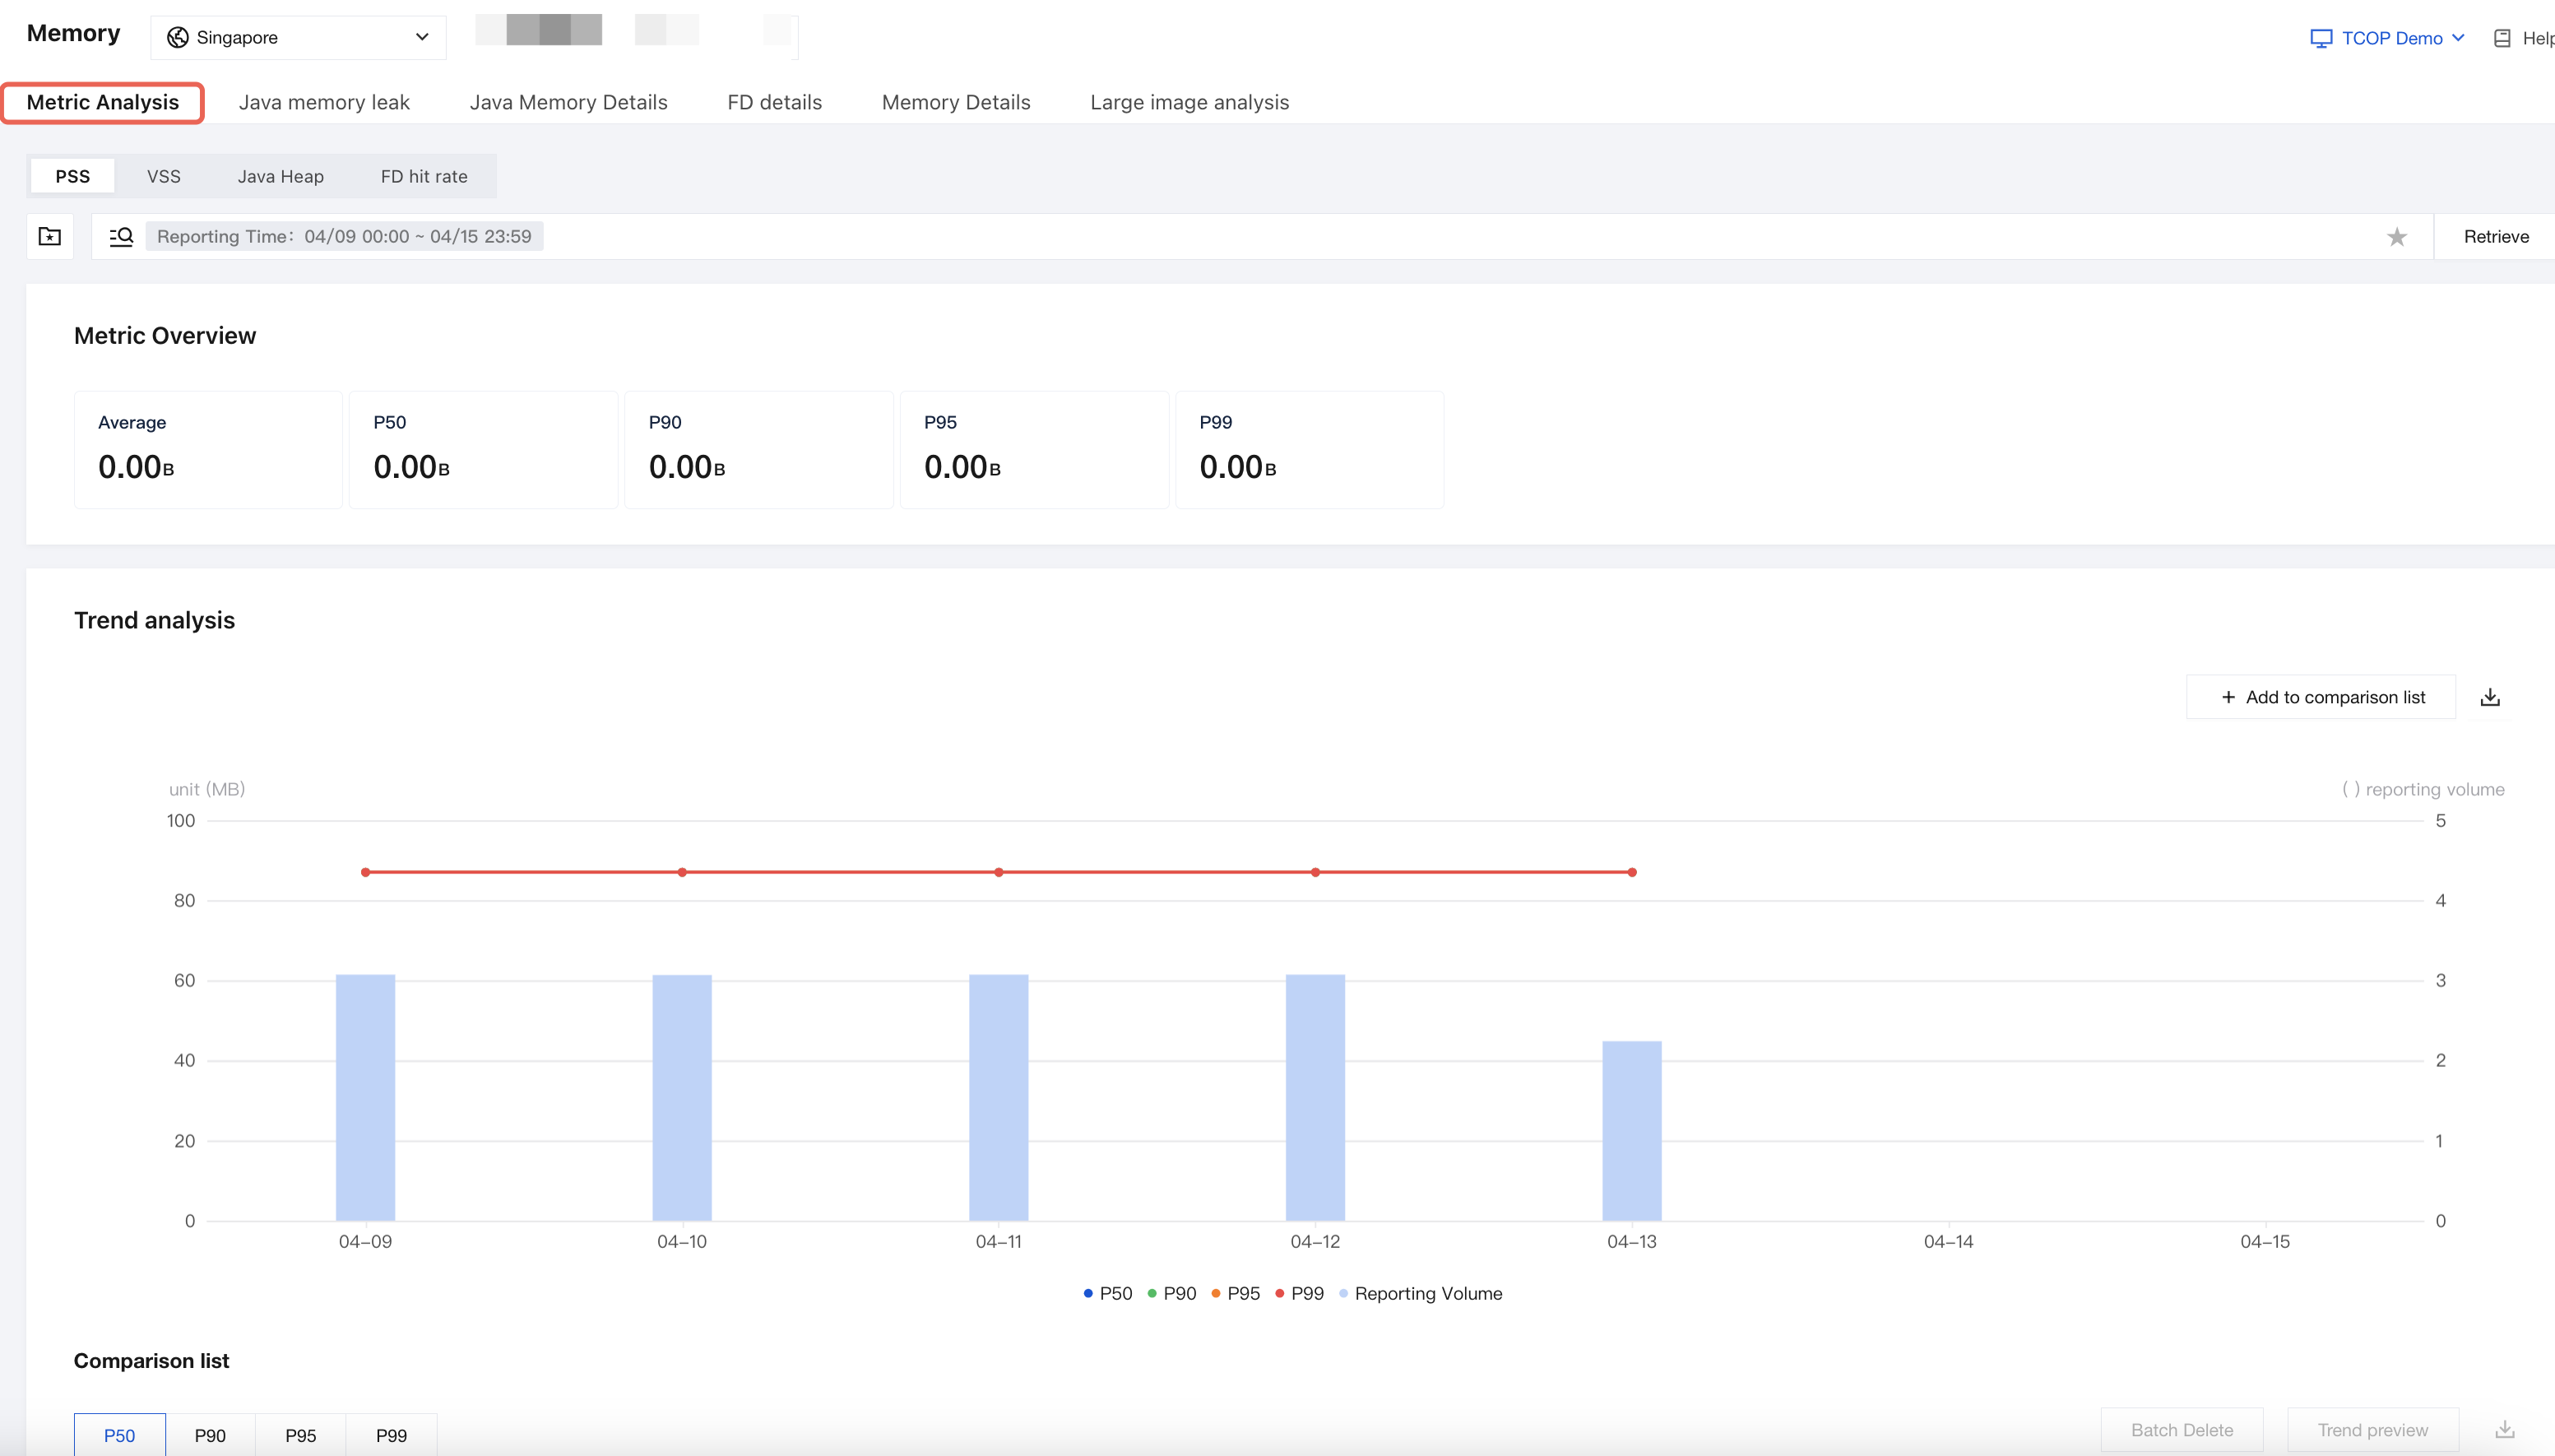
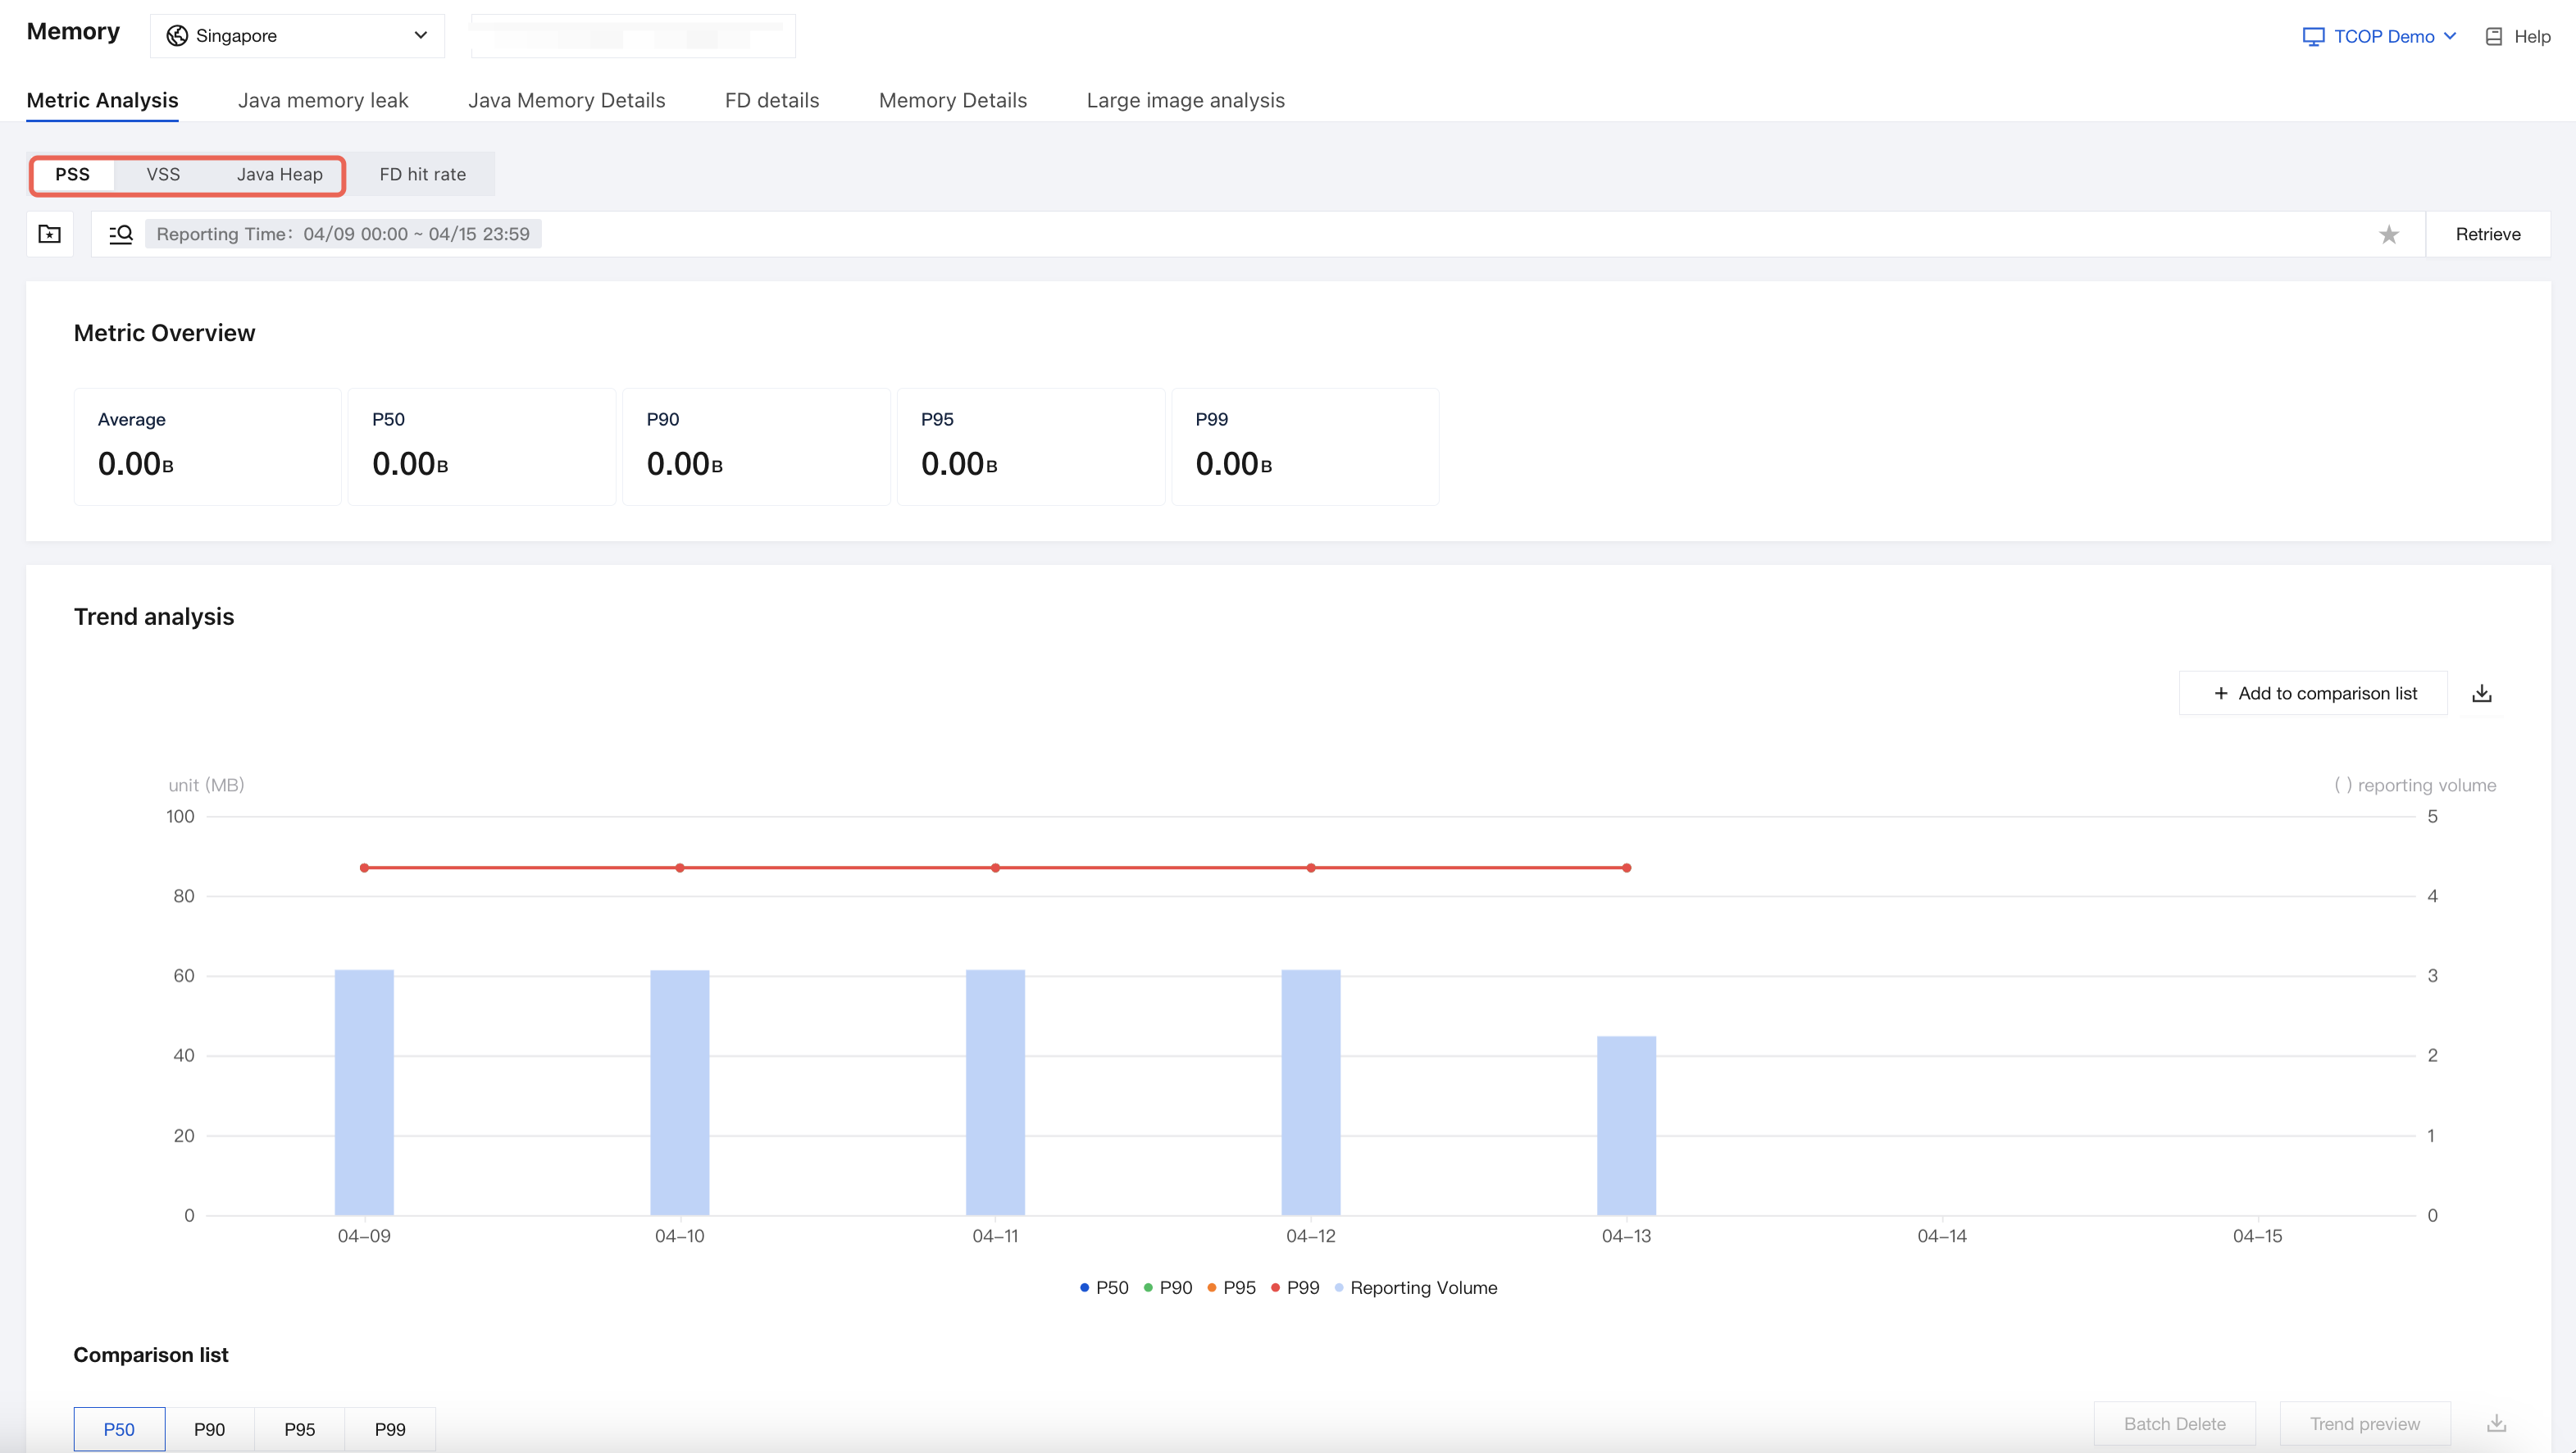
Memory peak refers to the maximum memory usage during a process's lifecycle, categorized into three types: PSS, VSS, and JavaHeap (totalMemory - freeMemory). Available memory on any mobile device is limited. The more memory a process consumes, the higher its risk of being terminated by the system in the background, and the more performance issues caused by GC may arise. The memory peak metric can, to some extent, gauge the severity of these issues. By default, the platform collects memory peak data for the main process. To obtain memory peak data for child processes, enable it via the following configuration on the Setting > SDK configuration Edit Configuration page:

Go to the memory indicator analysis page to view memory peaks, including three metrics: PSS, VSS, and Java Heap, with support for multiple drill-down methods.
FD hit rate
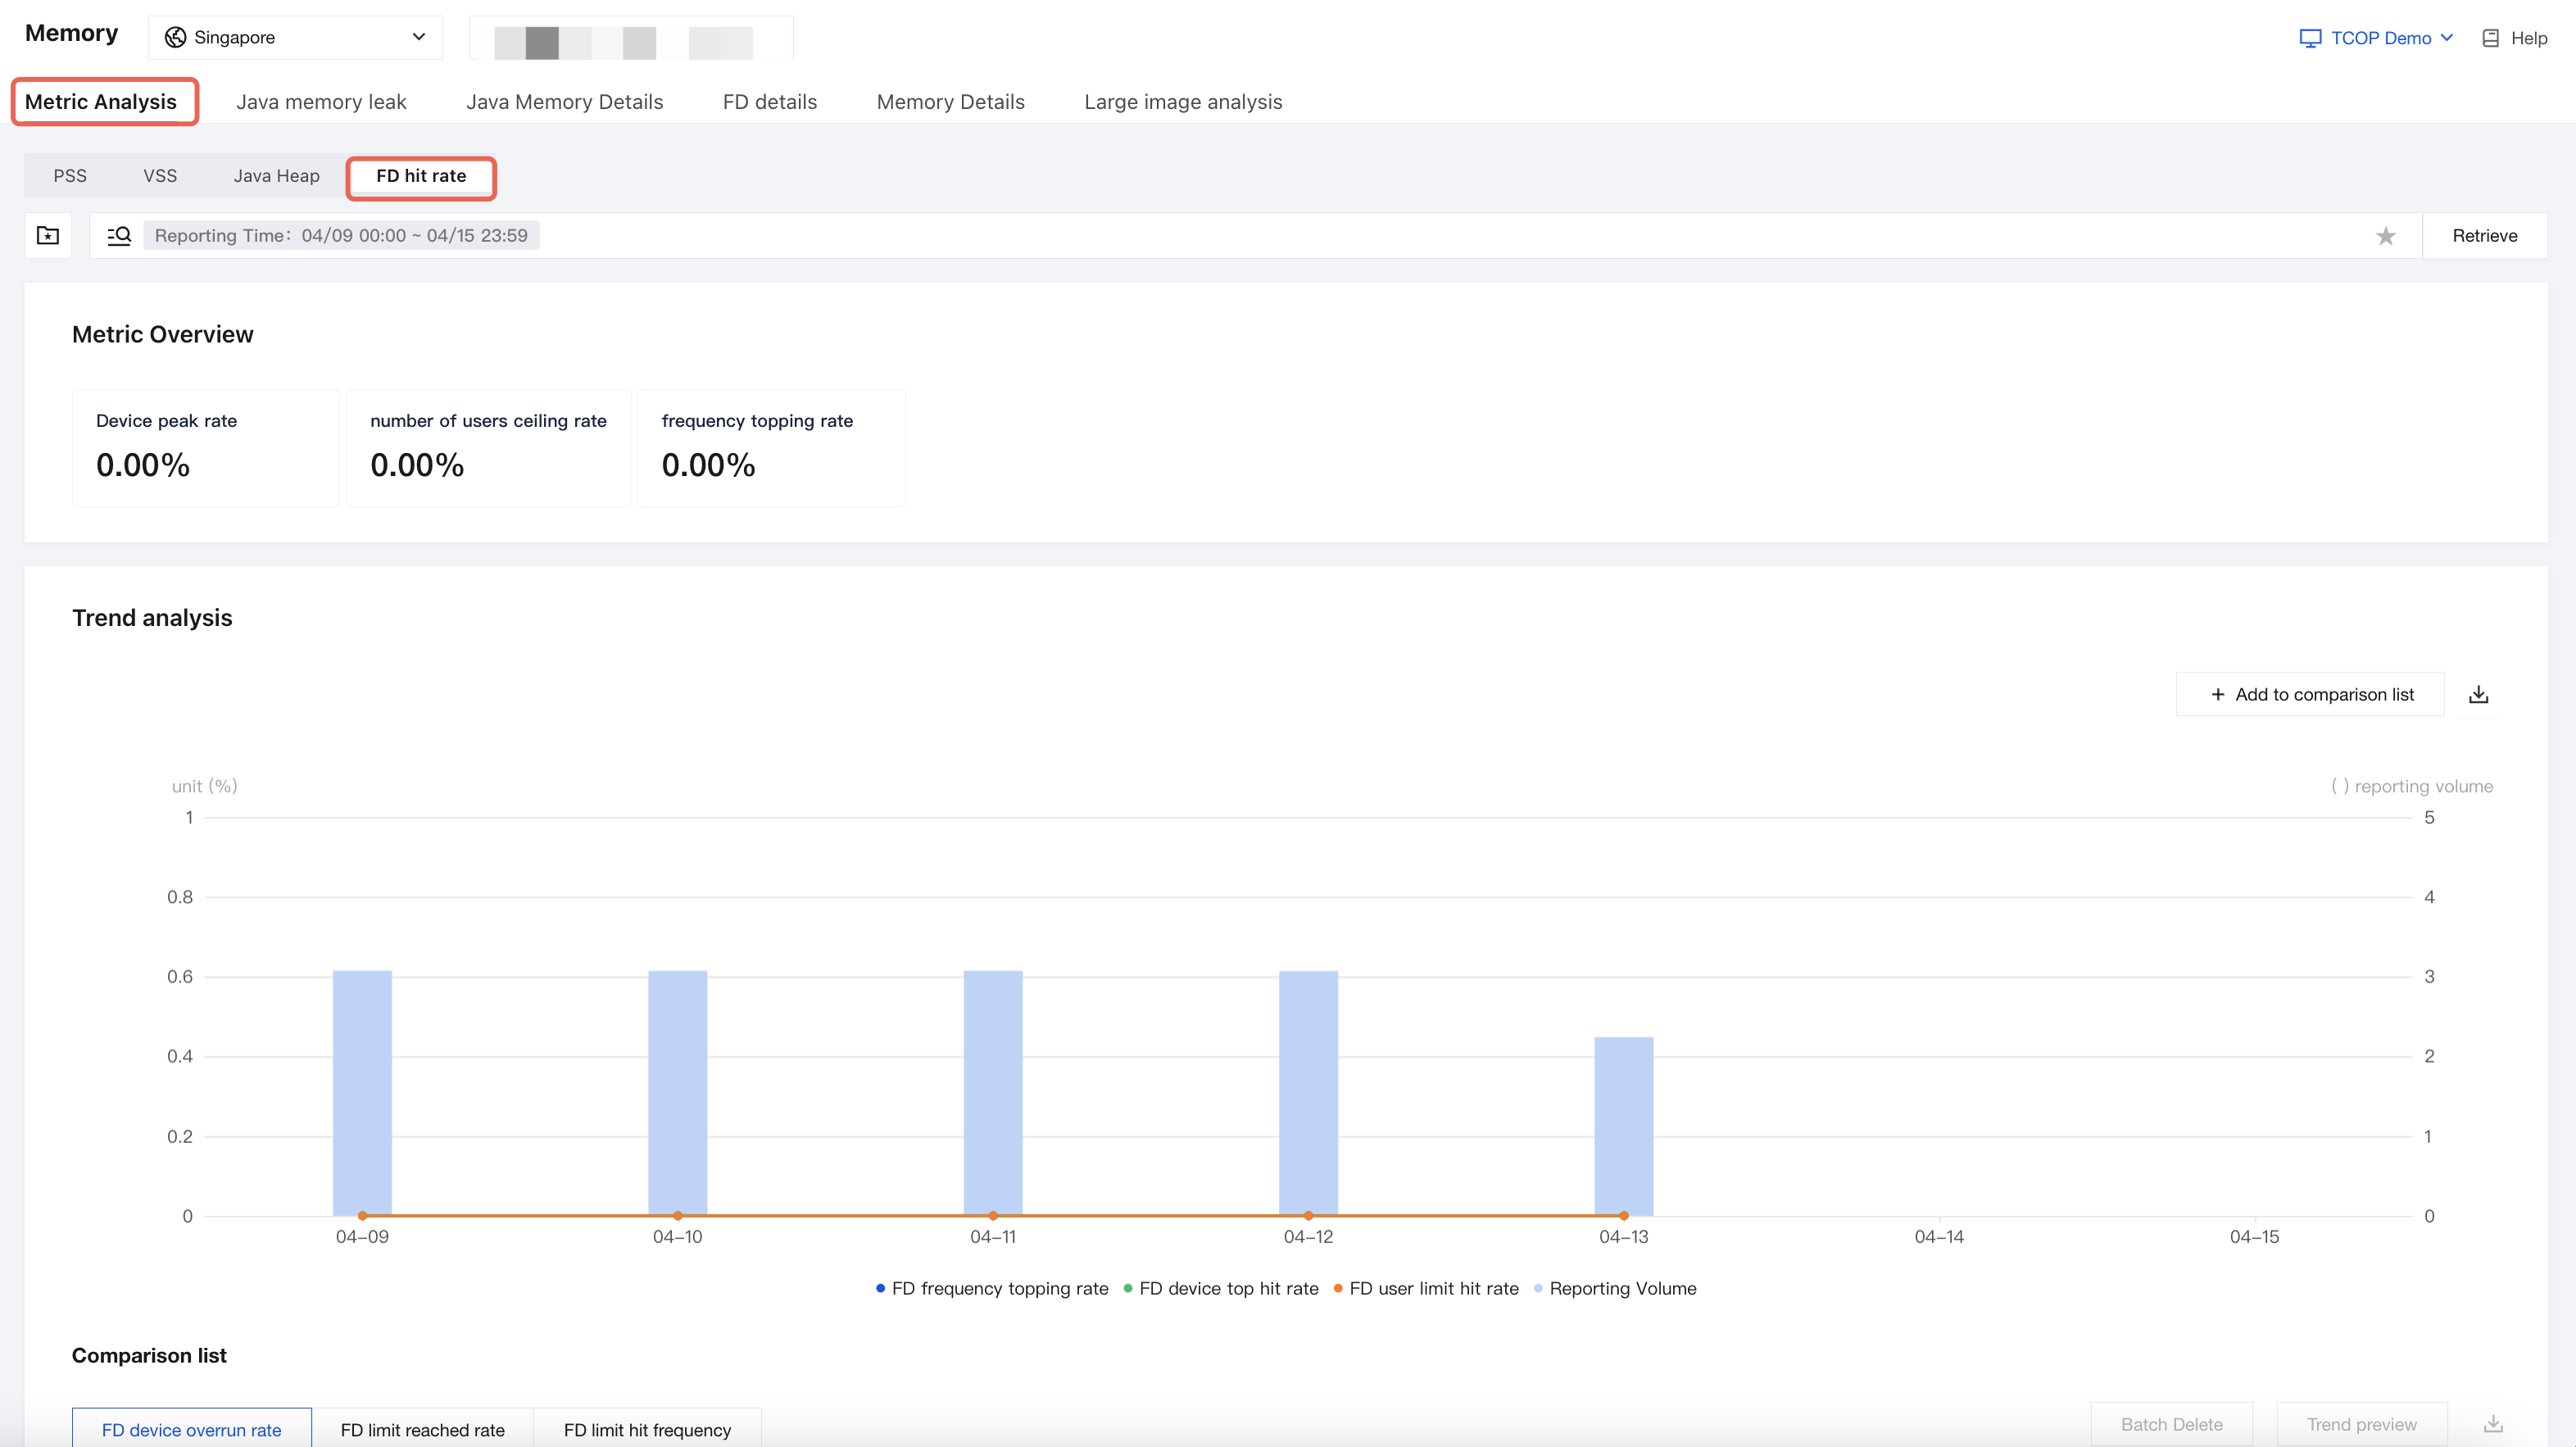
Like memory, FD is also a finite resource. Once a process exceeds the maximum FD resources, it can no longer obtain additional FDs, leading to issues such as crashes and black screens. Particularly in some lower Android versions, the available FD resources for a process are limited to 1024. For large-scale applications, 1024 FD resources are often insufficient to meet demands. Therefore, it is necessary to monitor FD resource usage in our processes. The FD peak touch rate measures the probability of the number of FDs reaching a predetermined threshold after enabling the FD details feature. This metric is reported only when the FD details monitoring feature is enabled.
Java memory leak
Enabling Method
The client adds the following code during initialization.
RumProBuilder builder = new RumProBuilder(appID, appKey);build.addMonitor(RumProMonitorName.MEMORY_JAVA_LEAK);
On the Setting > SDK configuration Edit Configuration page, configure according to the following configuration items.
In the backend, configure the sampling rate for the Java memory leak monitoring feature. Users can adjust the user sampling rate and event sampling rate via the Java memory leak configuration.
sample_ratio: The user sampling rate for the Java memory leak detection feature. 0 disables the feature for all users, 1 enables the feature for all users.
event_sample_ratio: The event sampling rate for the Java memory leak detection feature. 0 indicates no memory leak events are reported, 1 indicates all memory leak events are reported.

API Description
After enabling the Java memory leak monitoring feature, the platform automatically monitors two types of objects: Activity and Fragment.
For Activity: By registering an ActivityLifecycleCallback, Activity objects that have executed the onDestroy callback are collected.
For Fragment: By registering FragmentManager.FragmentLifecycleCallbacks, Fragment objects that have executed the onDestroy callback are collected.
Finally, for the collected destroyed objects, they are detected in a monitoring thread. If the object is still not reclaimed after multiple detections, it is determined that a memory leak has occurred. In addition to Activity and Fragment objects, you can monitor any object through the following platform APIs.
RumPro.startInspectLeakObj(leakObj);/*** Set objects for Java memory leak detection** @param leakObj Object to be detected*/public static void startInspectLeakObj(Object leakObj) {......}
Log Description
To monitor multiple leak objects in the same log file, the platform will delay for a period after detecting an object leak before capturing the hprof dump file. This allows multiple leak objects to be detected in the same log file. When capturing the hprof dump file, if logging is enabled, the following log output will be generated.
Note:
You can use the adb command to filter logs when capturing the hprof dump file. If there is log output, it indicates that detection has been successfully enabled:
adb logcat -s RMonitor_MemoryLeak_LeakInspector RMonitor_Heap_MemoryDumpHelper.Logs indicating whether objects are leaked:
06-08 21:03:03.700 25492 25535 D RMonitor_MemoryLeak_LeakInspector: Inspecting com.example.test.memory.TestActivityLeak@73988249-e8b3-4f5b-a880-01f41cb7dc3c Time=1686229383700 count=106-08 21:03:04.032 25492 25535 D RMonitor_MemoryLeak_LeakInspector: Inspecting com.example.test.memory.......06-08 21:04:33.796 25492 25535 D RMonitor_MemoryLeak_LeakInspector: Inspecting com.example.test.memory.TestActivityLeak@73988249-e8b3-4f5b-a880-01f41cb7dc3c Time=1686229473796 count=1906-08 21:04:38.968 25492 25535 D RMonitor_MemoryLeak_LeakInspector: Inspecting com.example.test.memory.TestActivityLeak@73988249-e8b3-4f5b-a880-01f41cb7dc3c Time=1686229478968 count=2006-08 21:04:44.138 25492 25535 D RMonitor_MemoryLeak_LeakInspector: Inspecting com.example.test.memory.TestActivityLeak@73988249-e8b3-4f5b-a880-01f41cb7dc3c Time=1686229484138 count=21
Logs when dumping the hprof file:
06-08 21:07:31.882 25492 29639 D RMonitor_Heap_MemoryDumpHelper: ReportLog dumpHprof: com.example.test.memory.LeftFragment@51fa088b-b1f2-464c-8d70-972a1f26c36006-08 21:07:33.791 25492 29639 D RMonitor_Heap_MemoryDumpHelper: dump used 1885 ms06-08 21:07:35.304 25492 29639 D RMonitor_Heap_MemoryDumpHelper: leakFlag=true,ZipFile=true,leakName=com.example.test.memory.LeftFragment@51fa088b-b1f2-464c-8d70-972a1f26c360,dumpPath=/storage/emulated/0/Android/data/com.example.sdkapp/files/Tencent/RMonitor/main/Log/dump_com.example.test.memory.LeftFragment@51fa088b-b1f2-464c-8d70-972a1f26c360_leak_23-06-08_21.07.33.z
After capturing the log files, they will be uploaded immediately in a Wi-Fi environment. In other cases, the upload will occur after the next process startup. The logs when uploading are as follows:
06-09 15:58:39.618 23814 23875 I RMonitor_report_File: url: ******* sub_type: activity_leak
Console Feature Description
The Java memory leak Web pages mainly consist of two pages: Issue List and Issue Details.
Issue List
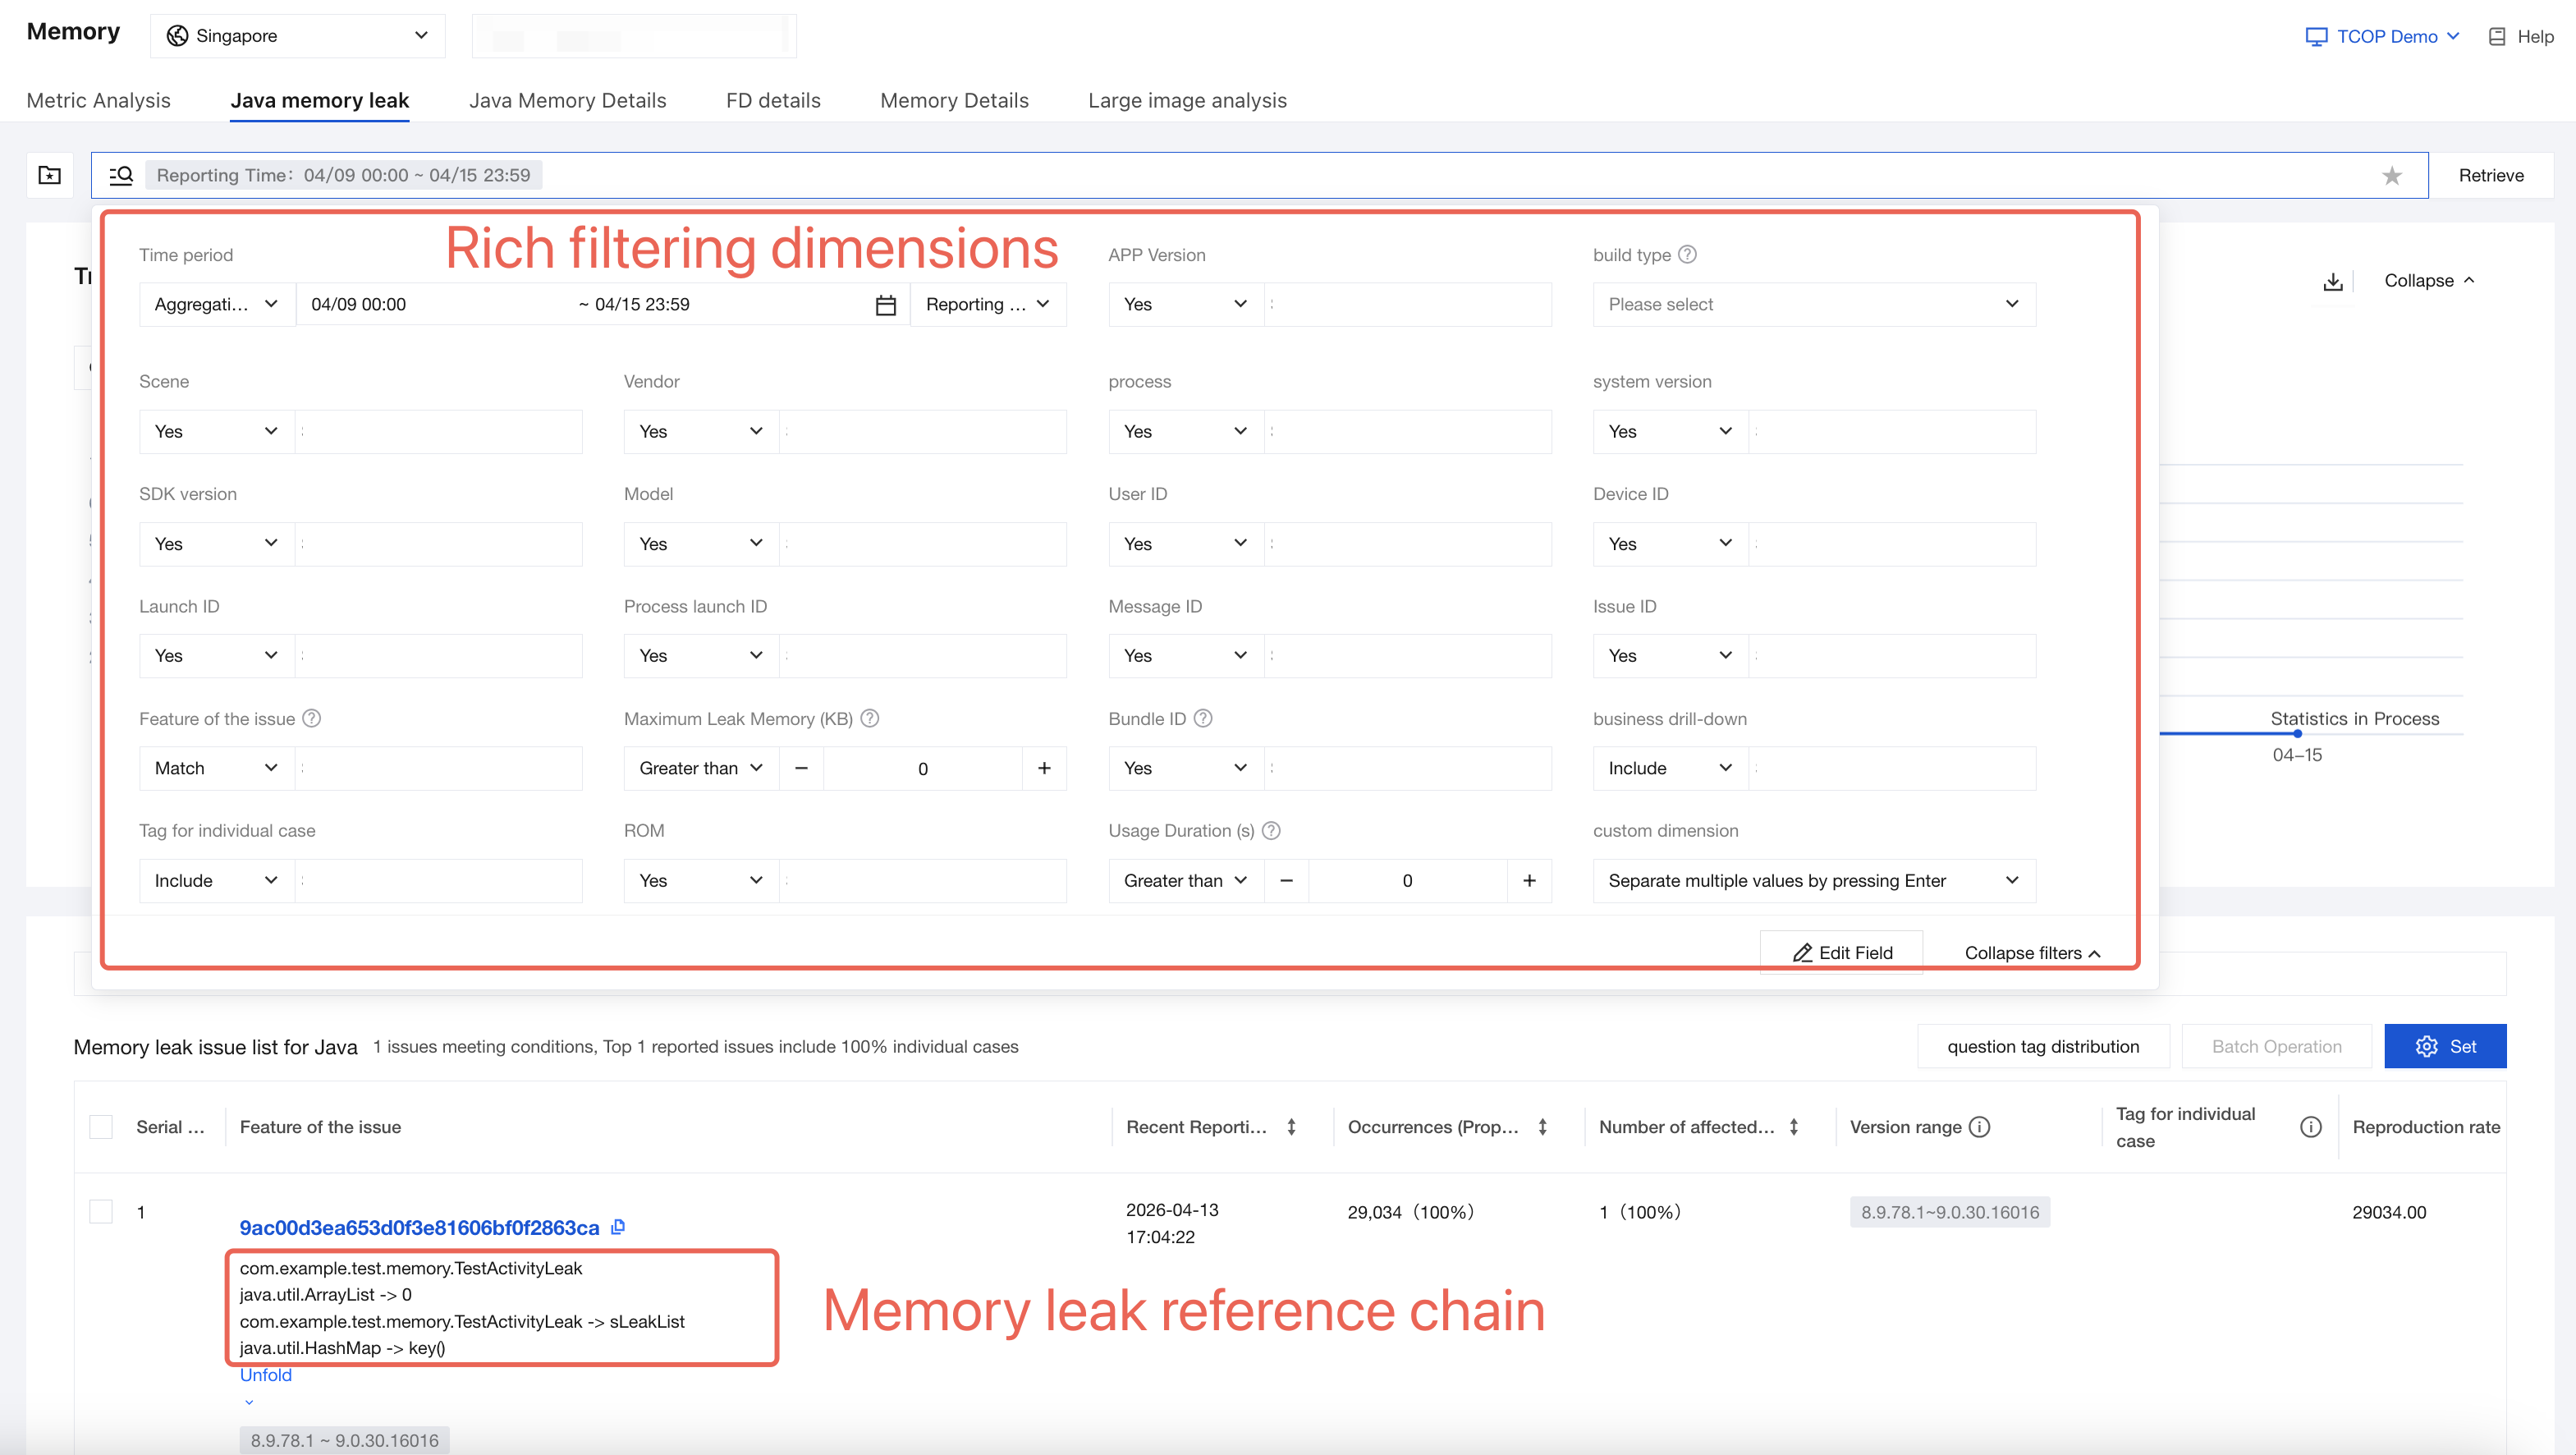
The issue list for Java memory leaks is formed by using memory leak reference chains as features to group cases with the same characteristics.
The issue list supports rich filter criteria. For specific usage, see Query.
Issue Details
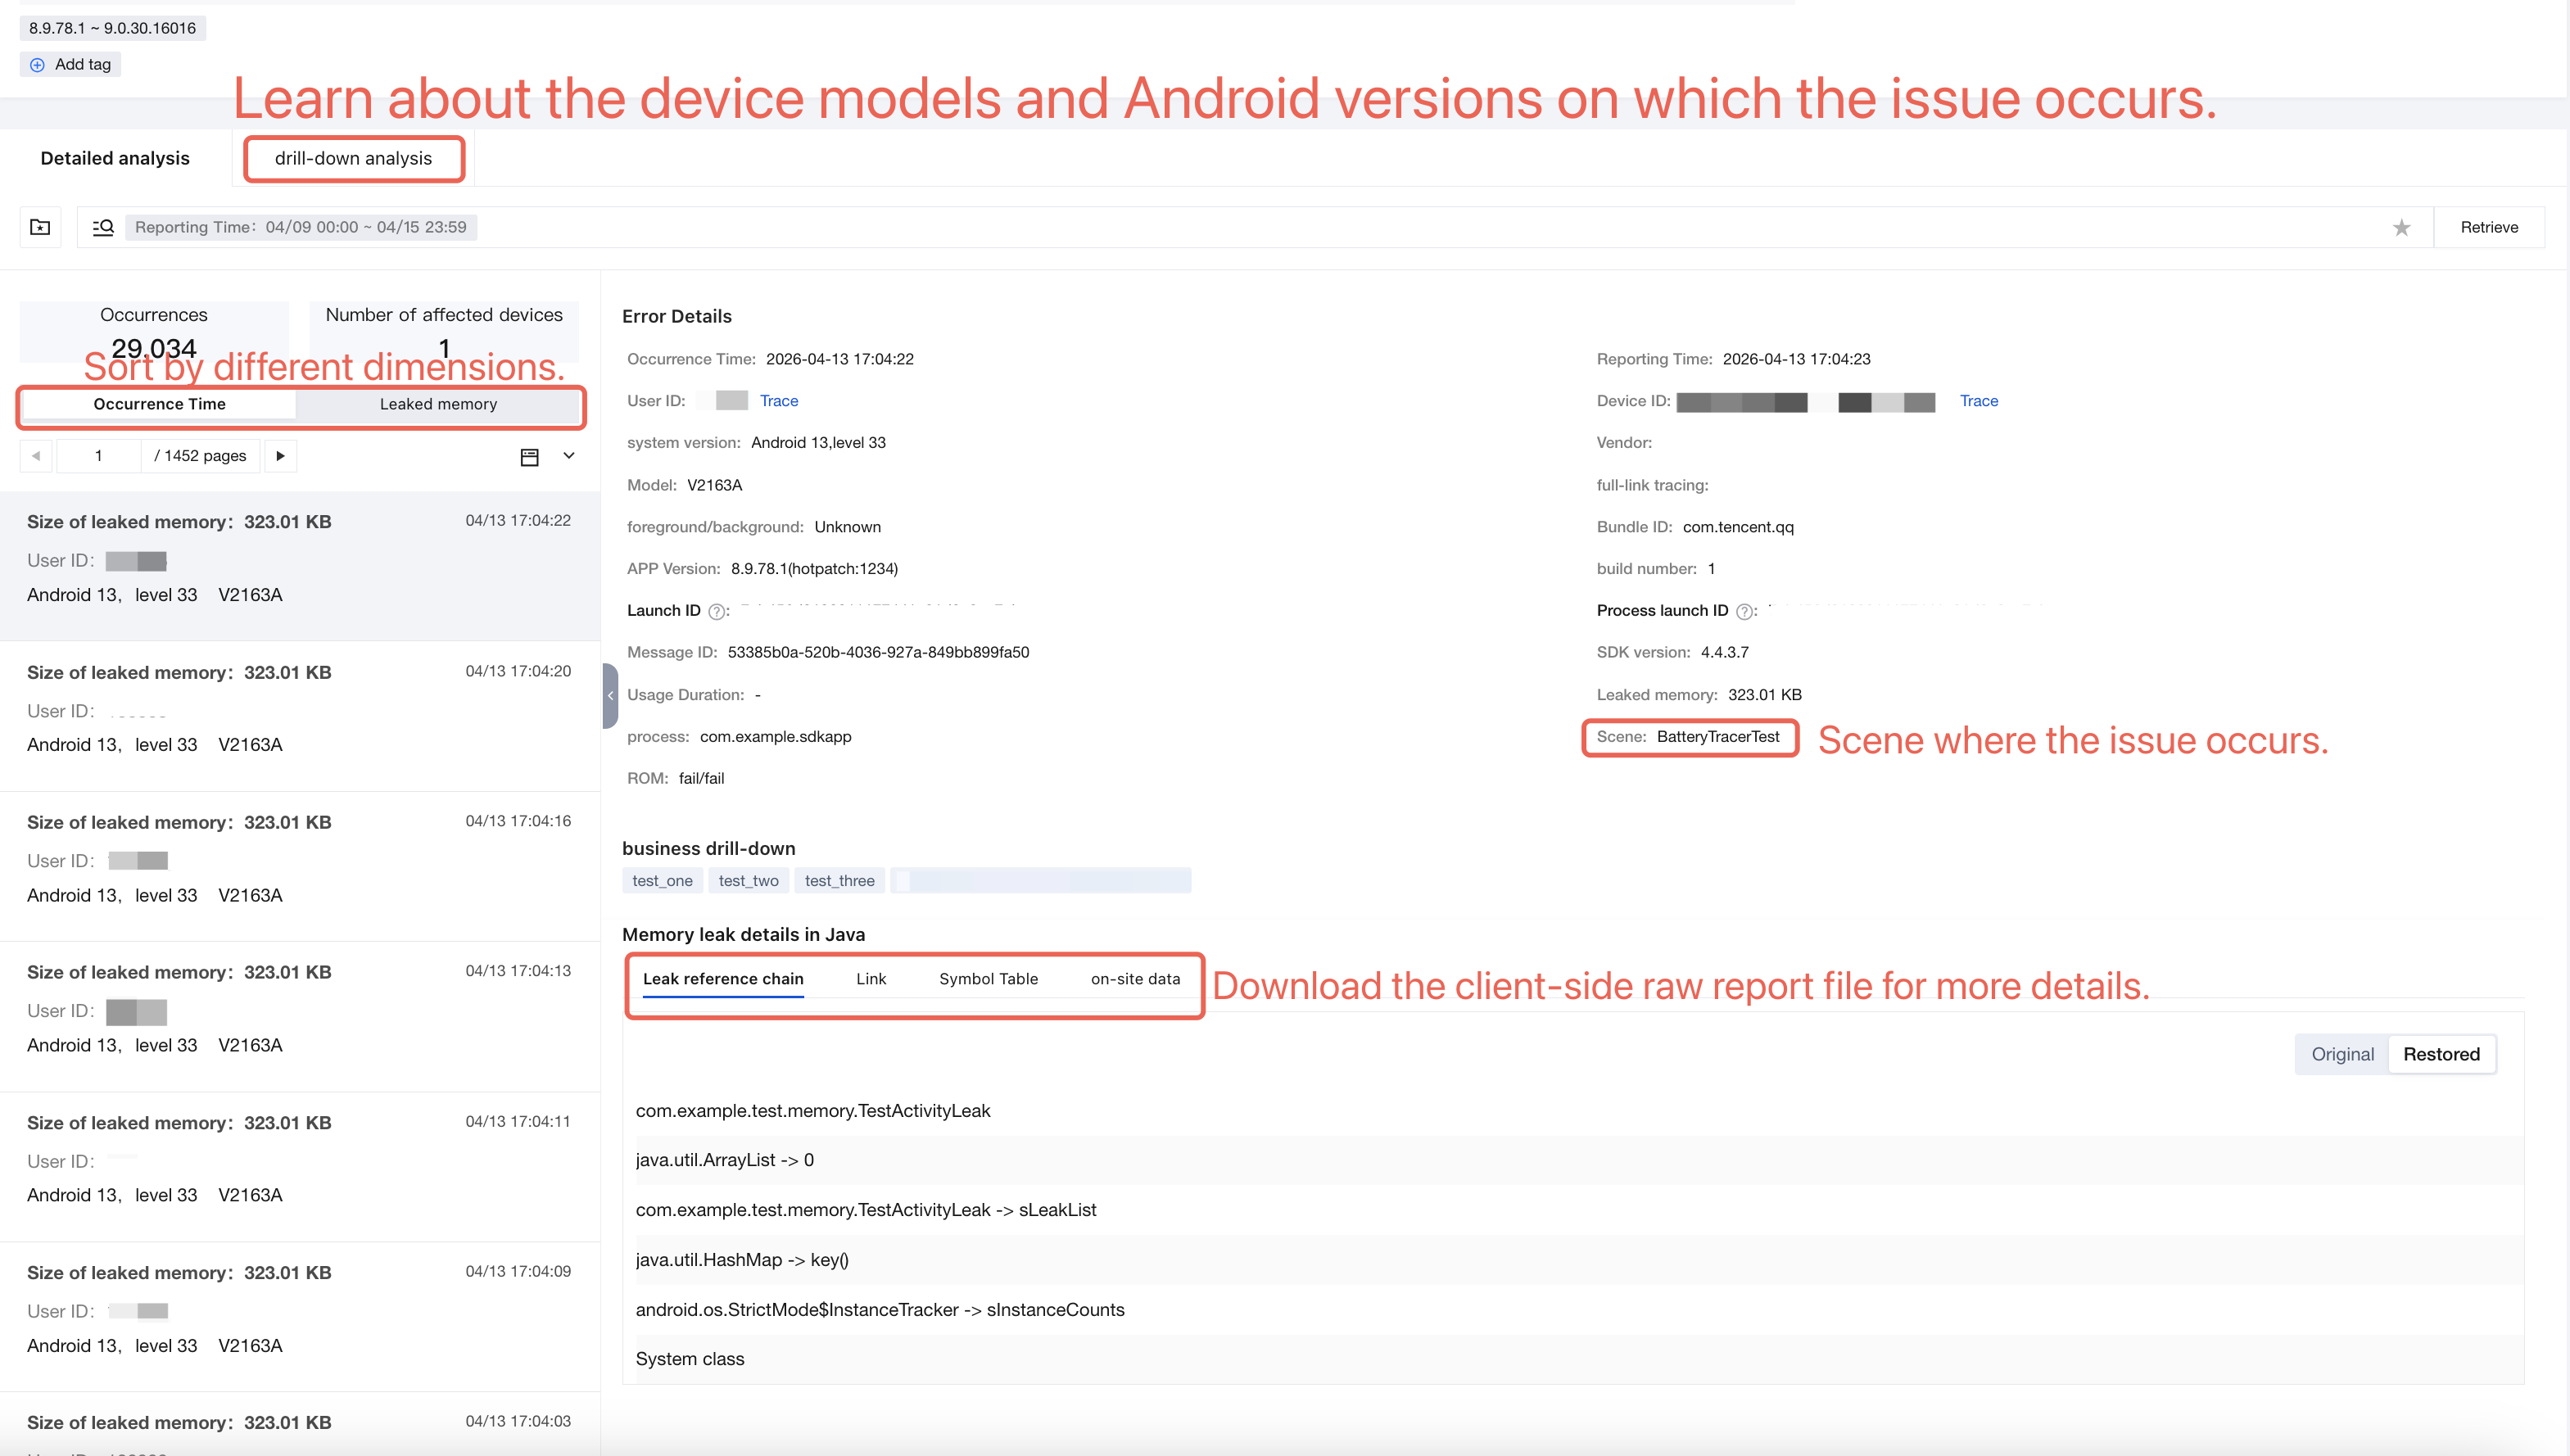
The issue details page provides a clear display of the leak reference chain and enables users to download the memory snapshot at the time of leakage for detailed analysis.
Java Memory Details
As mentioned earlier, after excessive Java memory usage, it not only triggers GC, causing issues such as stuttering and ANR, but more severely, it can directly lead to OOM crashes, severely affecting user experience. The Java memory details feature, after enabling, continuously monitors the current virtual machine heap memory usage. When it exceeds a preset threshold, it automatically collects relevant log information and reports it to the backend. This feature mainly provides the following services:
The feature implements a capability similar to MAT's "Top Consumers." After log information is reported to the backend, it can analyze issues of concern to the business, such as Single Report Analysis, a single large object, and intensive objects. This eliminates the need for users to manually capture hprof files and drag them to the PC-side for analysis using MAT tools, significantly improving analysis efficiency.
When frequent GC occurs or the Java heap memory usage continuously exceeds a certain threshold of its maximum value multiple times, a child process automatically dumps the Java heap memory dump file on the mobile end. Dumping heap memory dump files in the background has minimal impact on the user experience.
It can be used online, leveraging the platform's existing translation capabilities to translate class names and member variable names. Afterward, it intelligently extracts clustering key features to group similar issues together. This automated translation and clustering allow users to easily focus on Top issues, eliminating the cumbersome operations of manual translation required by tools like MAT.
Term Explanation:
Single report analysis: Currently supports detecting leaked Activity objects.
Individual large objects: Analogous to MAT's "Biggest Objects" feature, this refers to a single Java object or class whose Retained Size exceeds a certain threshold. The threshold is currently specified by the platform backend.
Clustered objects: Analogous to MAT's "Biggest Top-Level Dominator Classes" feature, this refers to a Java class where, although individual objects are small, the total Retained Size of all its Java object instances exceeds a certain threshold. The threshold is currently specified by the platform backend.
Enabling Method
Upgrade to SDK 4.4.2.2 or later is required to support the Java memory details monitoring feature. On the client side, execute the following code and enable it by adjusting the sampling rate configuration in the backend.
1. The client should add the following code when initializing the SDK.
public static void initRumPro(Context context) {// 1. Pre-build initialization parameters. These initialization parameters are required.String appID = "a278f01047"; // [Required] Obtain the appID of the application from the application list on the platform.String appKey = "1e5ab6b3-b6fa-4f9b-a3c2-743d31dffe86"; // [Required] Obtain the appKey of the application from the application list on the platform.RumProBuilder builder = new RumProBuilder(appID, appKey);......// 2. Enable Java memory detailsbuild.addMonitor(RumProMonitorName.MEMORY_JAVA_CEILING);// 3. Initialization. This must be called.RumPro.init(context, builder);}
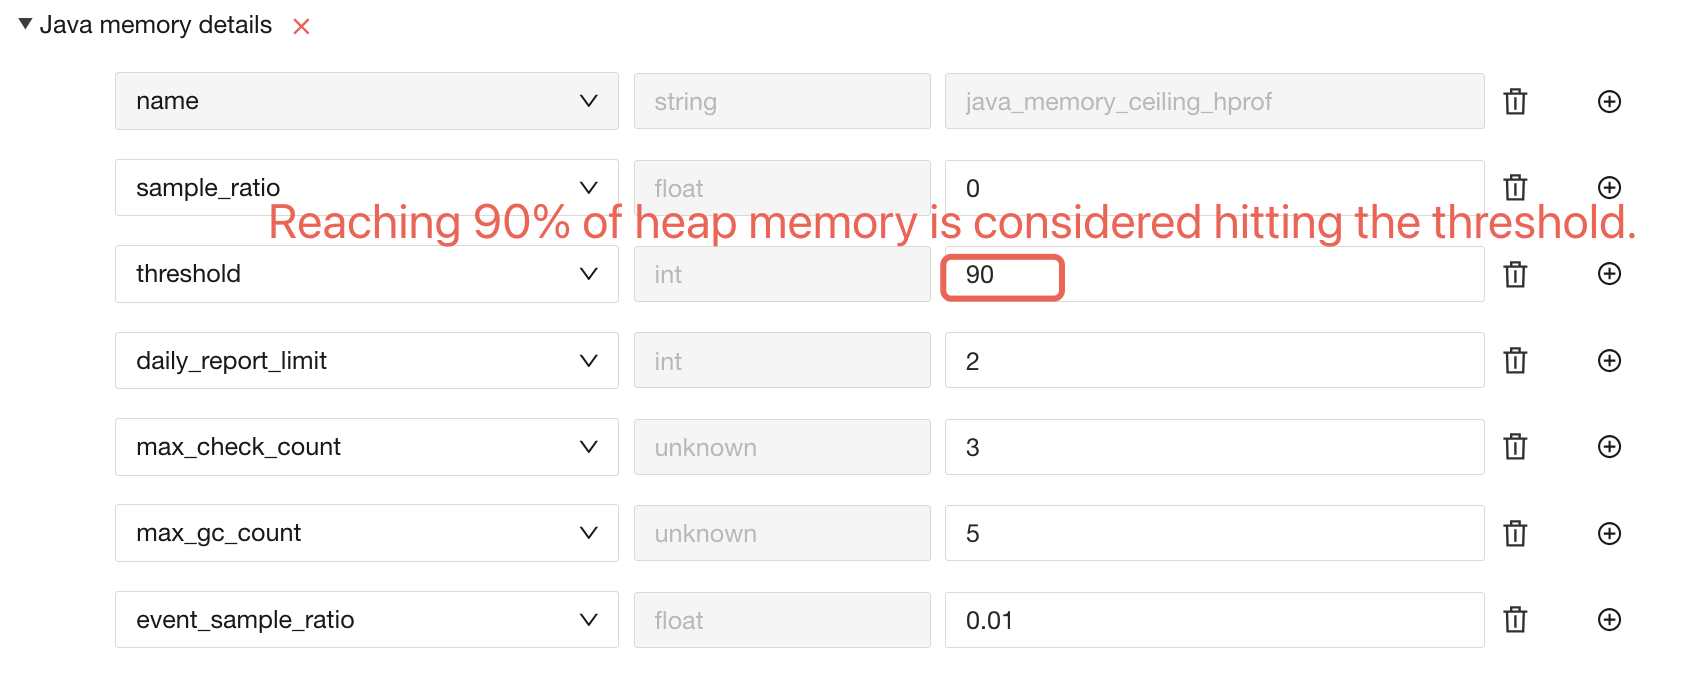
2. On the Setting > SDK configuration edit configuration page, enable the following configuration items:
sample_ratio: Controls the user sampling rate, indicating how many devices will enable this feature.
event_sample_ratio: Controls the event sampling rate, indicating whether to report when the Java memory threshold is reached.
threshold: Sets the timing for log file capture. 90 indicates that log capture starts when the heap memory reaches 90% of its maximum value, where the maximum heap memory corresponds to Runtime.getRuntime().maxMemory().
Log Description
Log for successful feature enabling:
07-04 10:xx:xx.xxx 14546 1819 D RMonitor_MemoryCeiling: Start MemoryCeilingMonitor07-04 10:xx:xx.xxx 14546 1819 D RMonitor_MemoryCeiling: start detect memory ceiling
Detected Java memory threshold reached, starting to dump log files:
07-04 10:xx:xx.xxx 3713 3713 I .example.sdkapp: hprof: heap dump "/storage/emulated/0/Android/data/com.example.sdkapp/files/Tencent/RMonitor/main/Log/dump_LowMemory_24-07-04_10.20.41.hprof" starting...
Logs for reporting log files to the platform backend (reported in real-time under Wi-Fi network; reported after restart under other network conditions):
07-04 10:xx:xx.xxx 14546 1918 I RMonitor_report_File: url: https://xxx.qq.com/v1/xxxx/upload-file?timestamp=1720059647340&nonce=7153357010e6227230d5deb79ce73ed7, sub_type: java_memory_ceiling_hprof
Console Feature Description
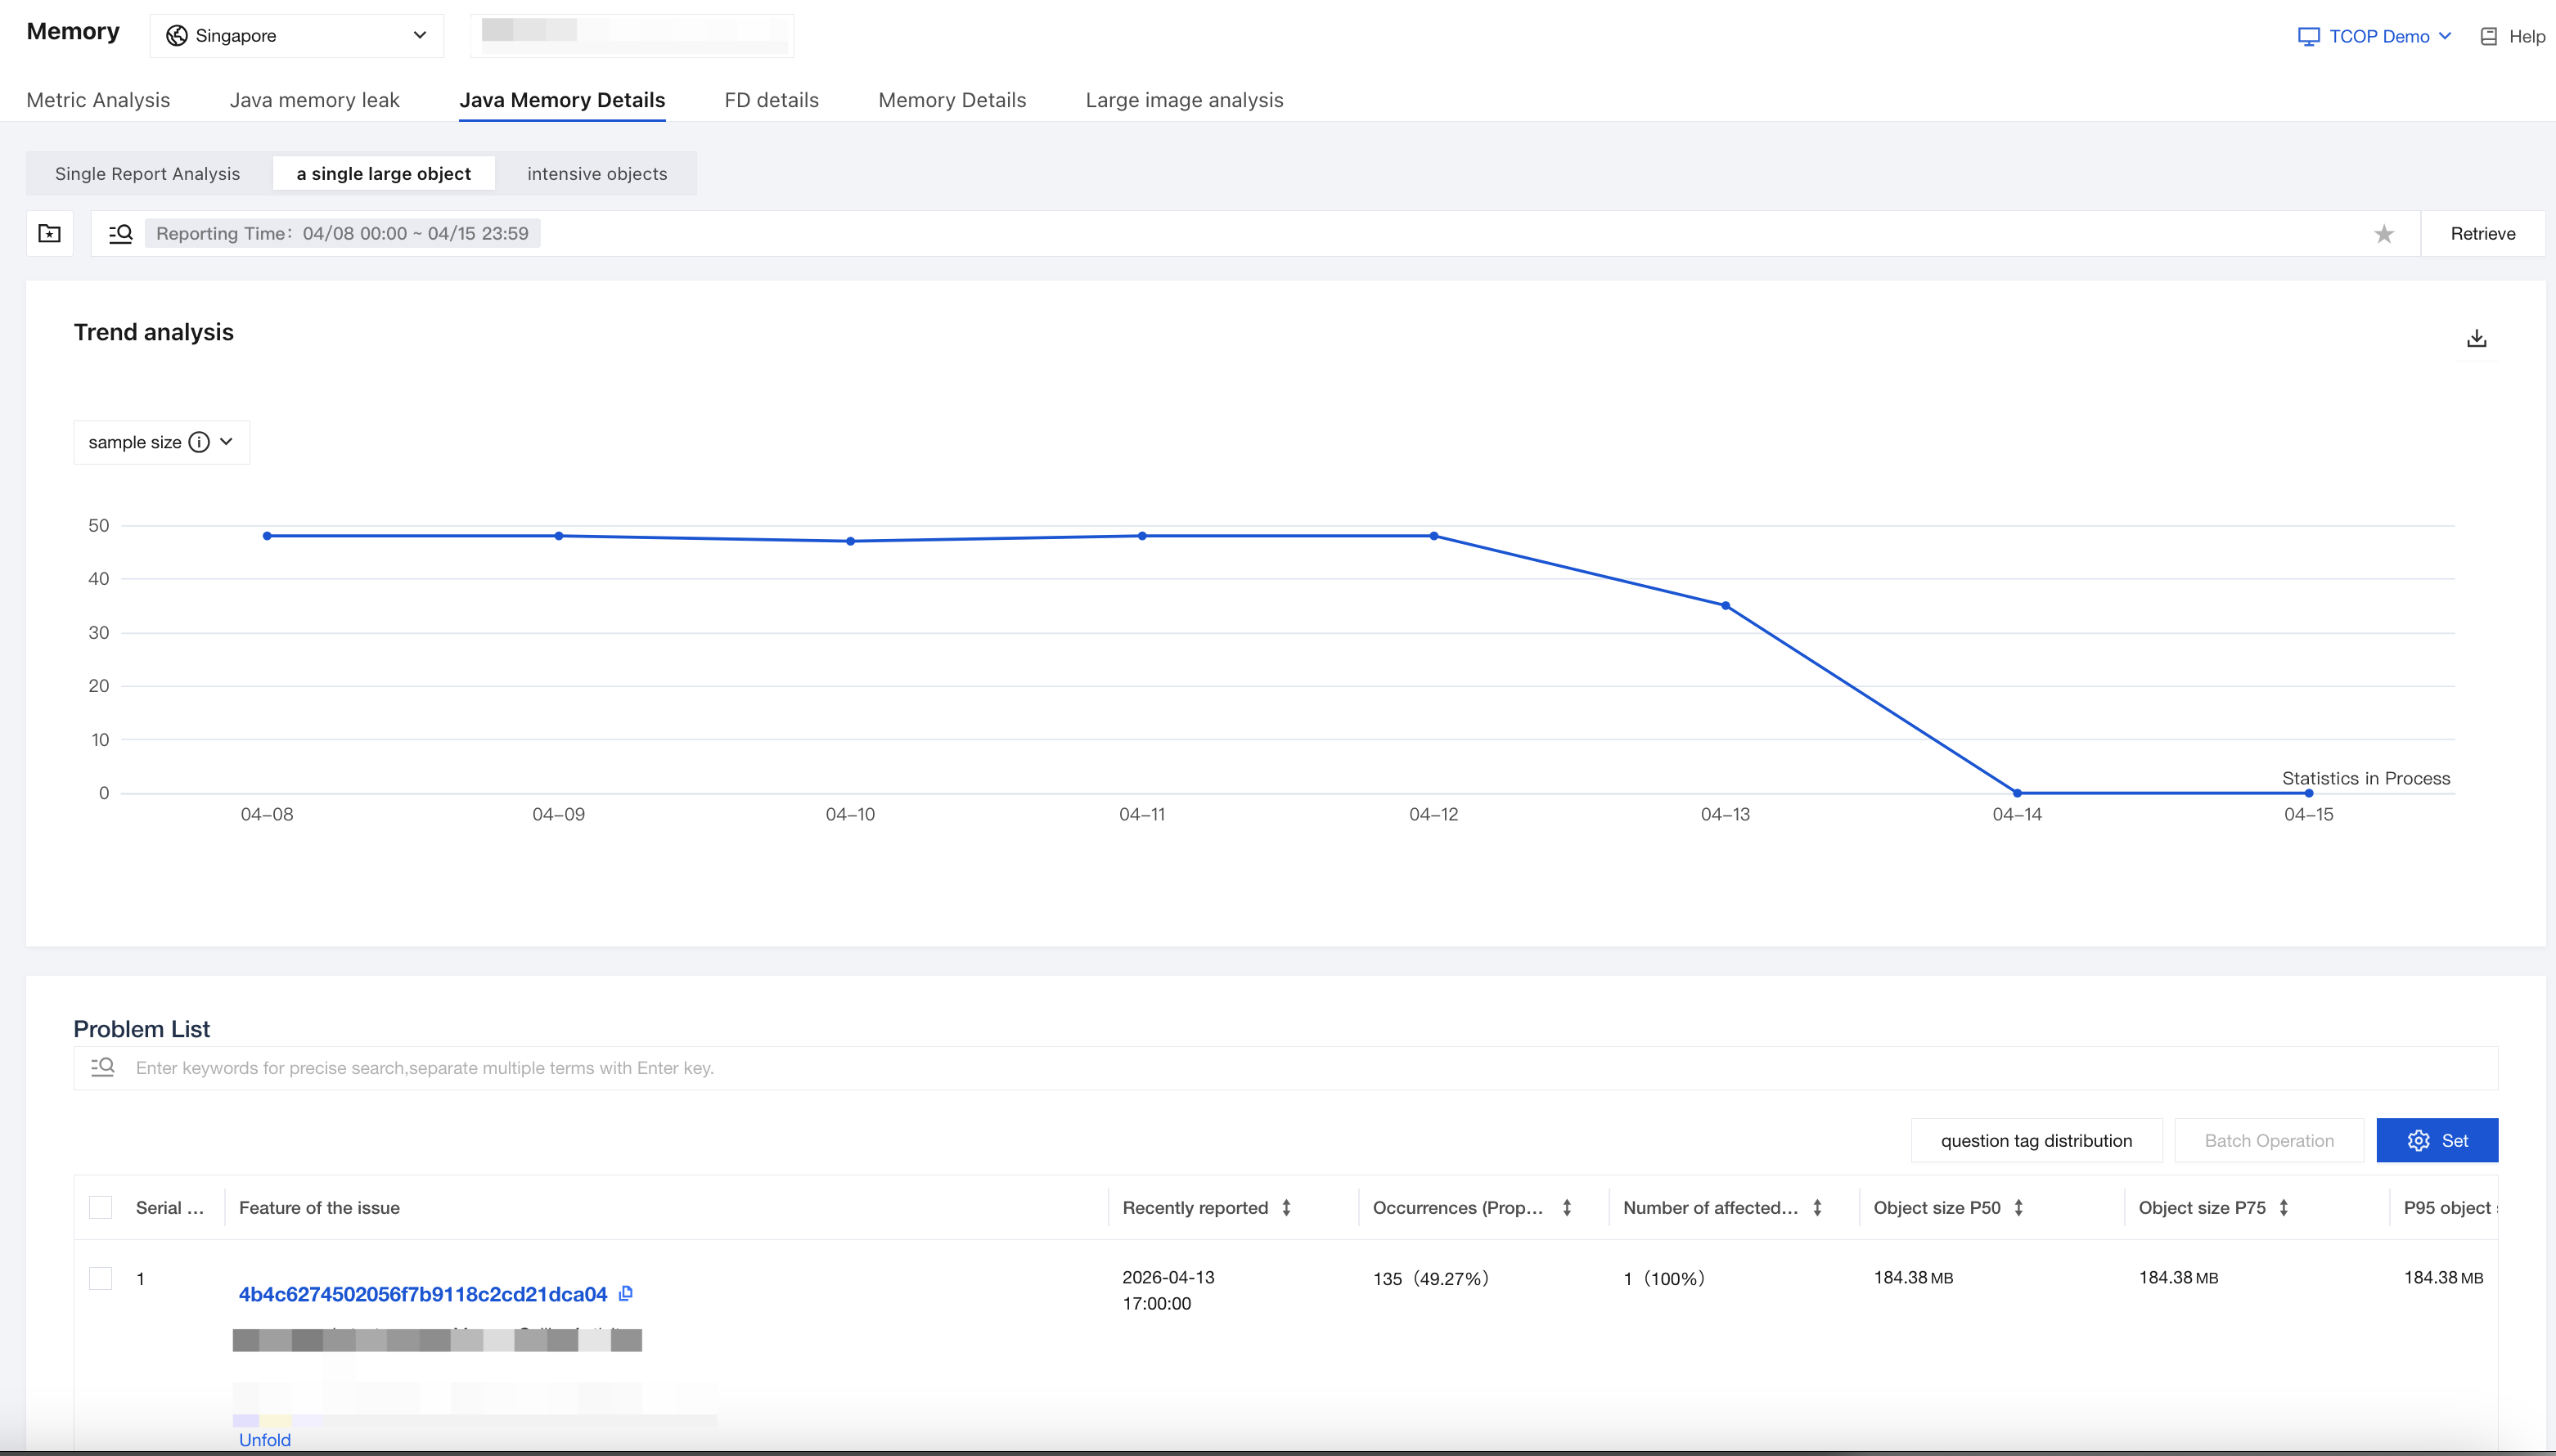
When the platform backend receives a Java memory threshold log from a user, it uses a self-developed heap dump analysis tool to identify issues such as a single large object, intensive objects, and Single Report Analysis. Each issue is characterized by key features used for clustering. Thus, a single report typically corresponds to multiple platform issues. The problem list page for single large objects and dense objects primarily consists of three components: filter options, trend analysis, and the issue list. Among these:
a single large object & intensive objects
In the query area, many filter options are provided. Among them, the maximum heap memory of the virtual machine and problem characteristics can accurately filter out specific issue problems. For other filter options, refer to Query.
Maximum Heap Memory of Virtual Machine (MB): This is a dropdown selection box corresponding to the value of Runtime.getRuntime().maxMemory().
Problem characteristics: Specific issues can be filtered using various methods such as "match".
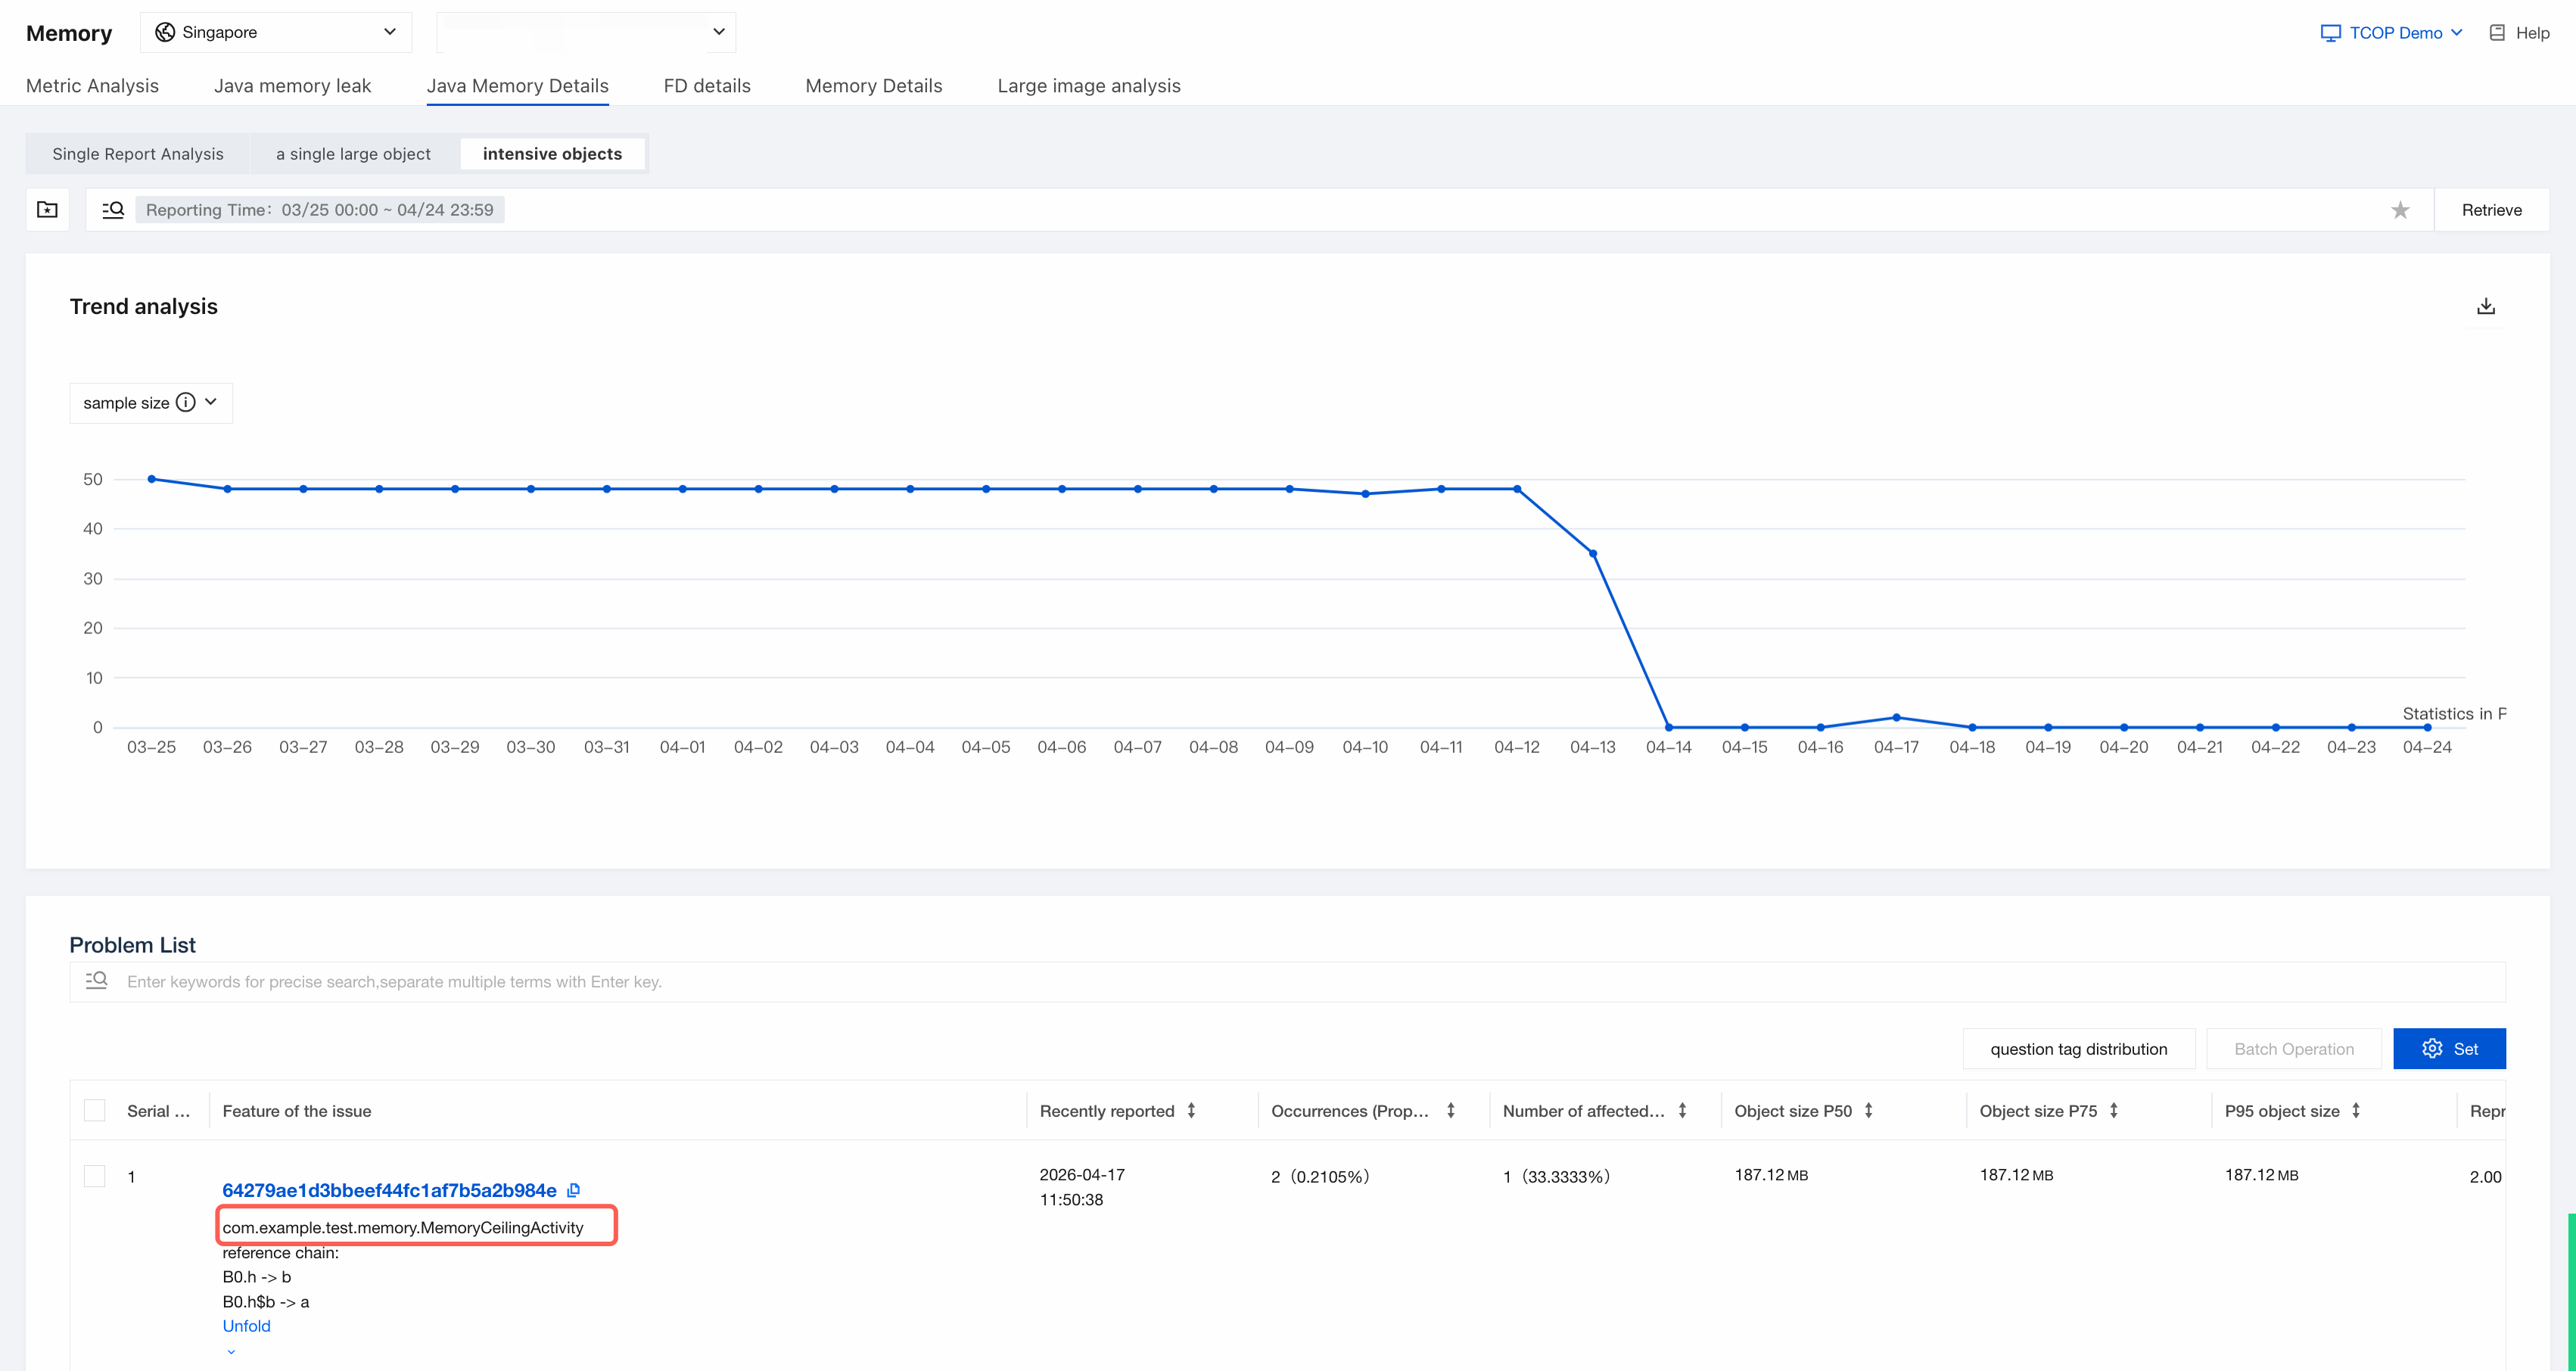
Trend analysis:
Sample size: the number of individual cases in the problem list.
It also supports switching between multiple metrics such as affected device count, affected user count, startup count, and connected device count. Users can select as needed.
Issue list: The issue list is categorized by issue, with each issue having its own key characteristics. The key characteristics mainly fall into three types: "reference chain", "dominator tree", and "plain text". The reference chain represents the shortest path from a large object to the GC Root. For large objects that are files or threads, the file path or thread name is used as the clustering feature.
The clustering feature of dense large objects is the class name of that large object:
Single Report Analysis
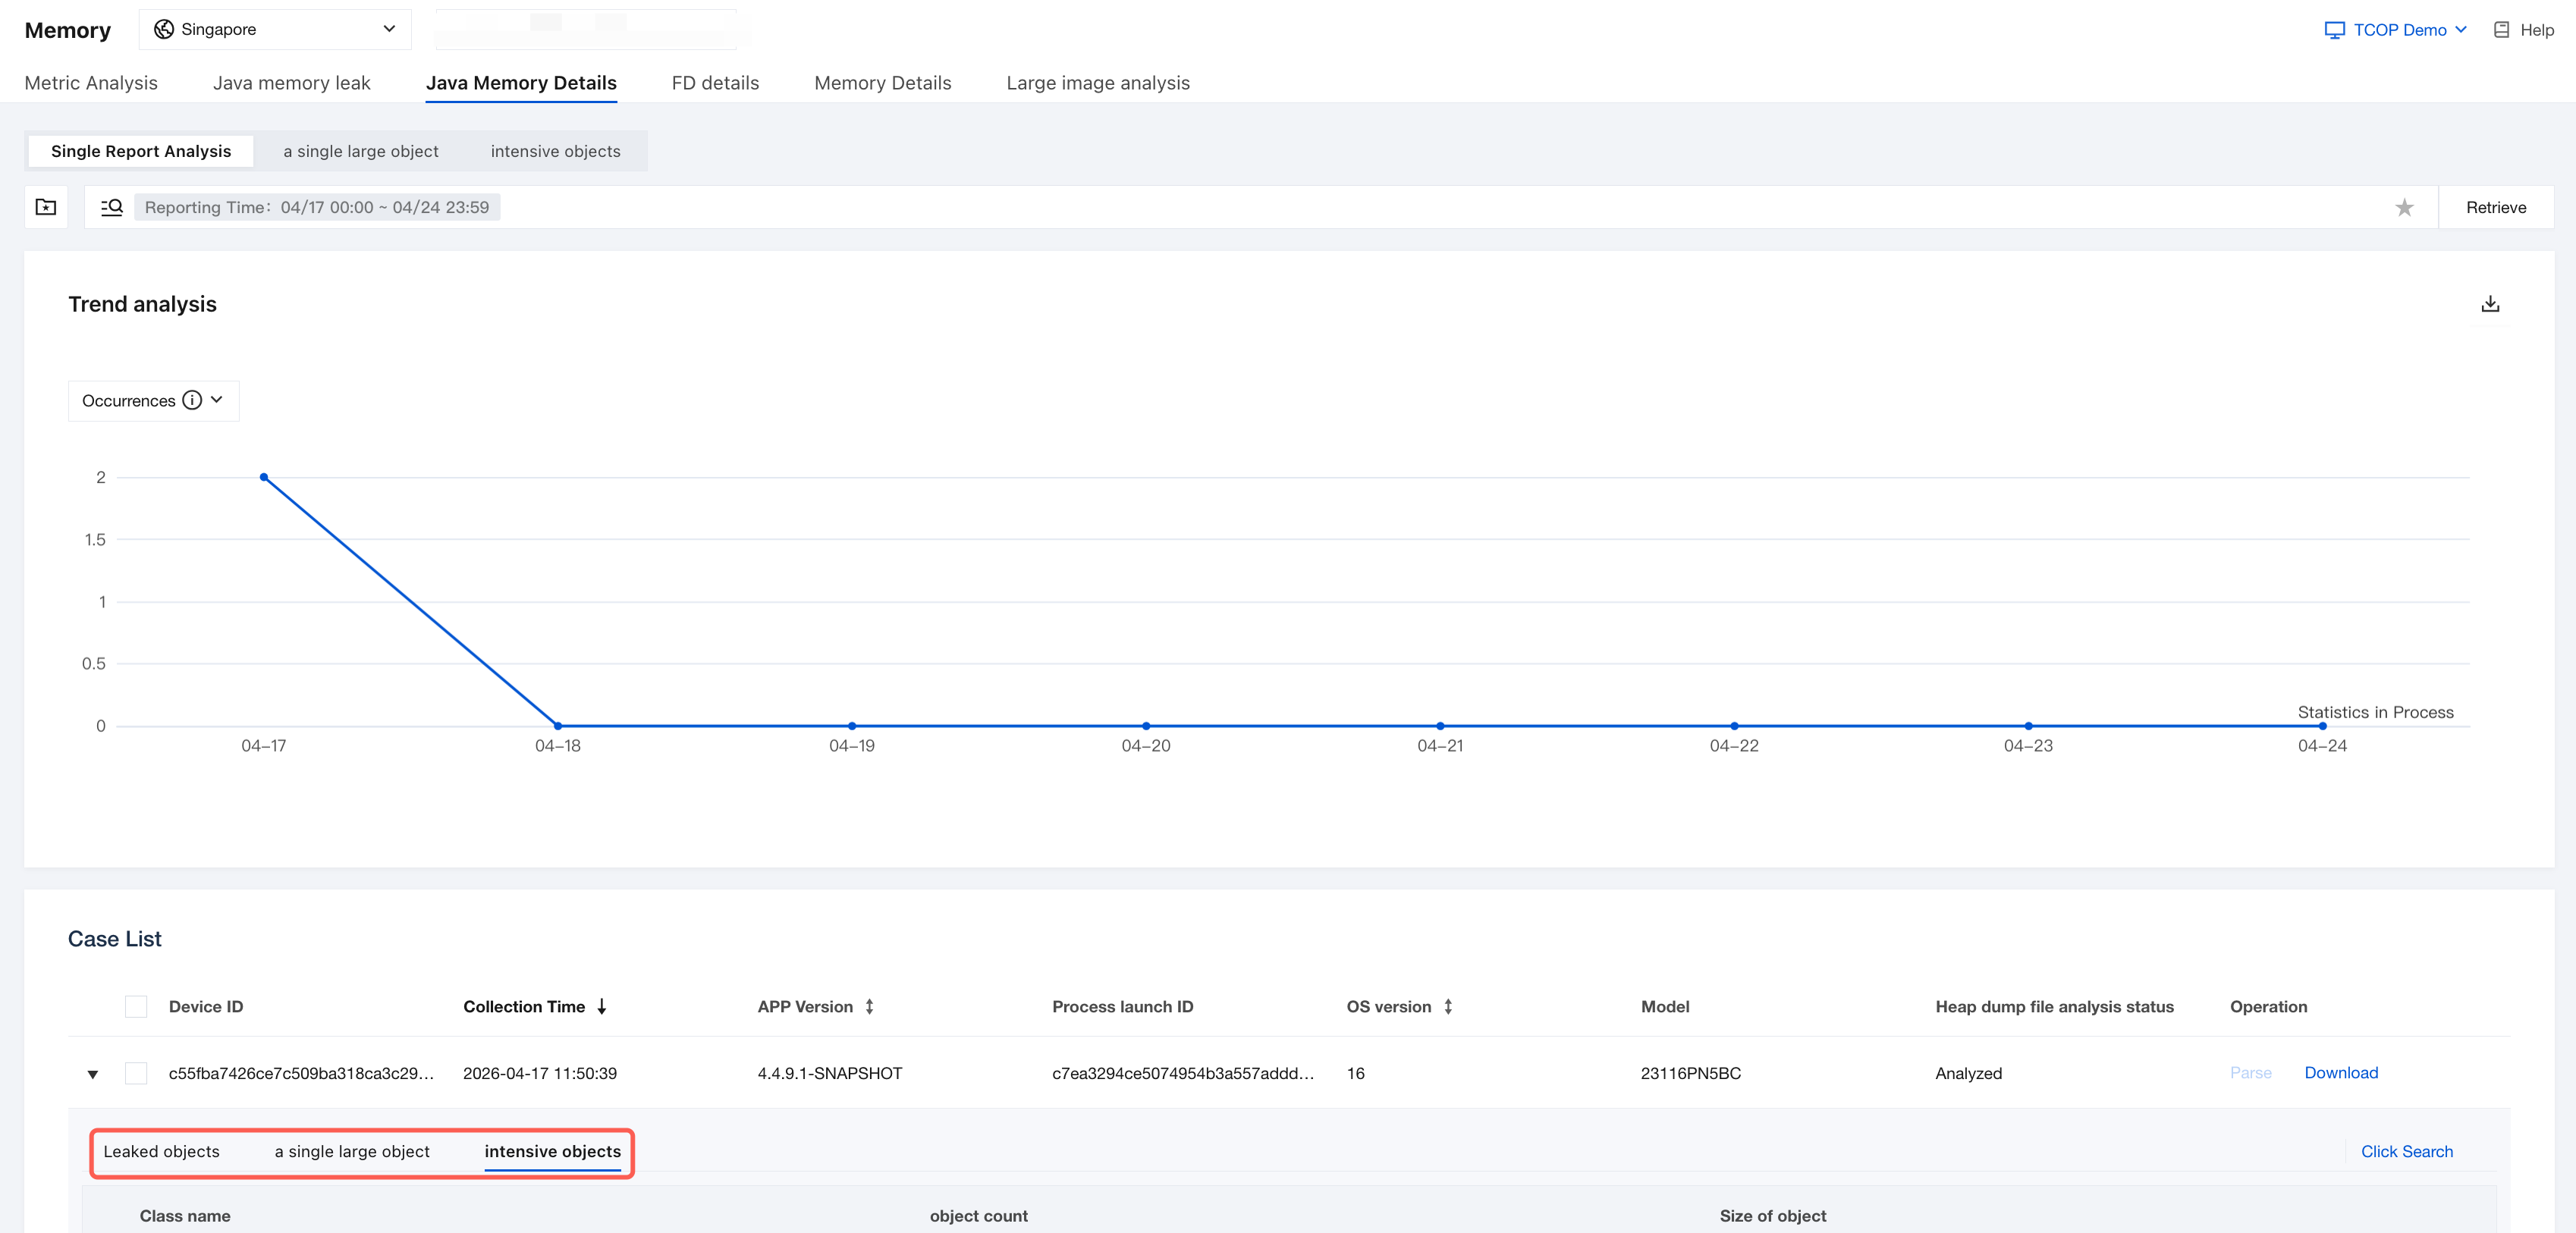
The issue list for single large objects and dense objects displays the results after analysis and clustering, whereas the issue list for single-report analysis is unclustered. Each user report occupies a separate entry in the issue list. Clicking on an entry reveals whether that specific report contains memory leaks, along with all single large object and dense object issues. This allows for convenient inspection of the detailed causes behind a specific Java memory threshold event. Additionally, it provides the feature to batch download heap dump hprof files.
Issue Details Page
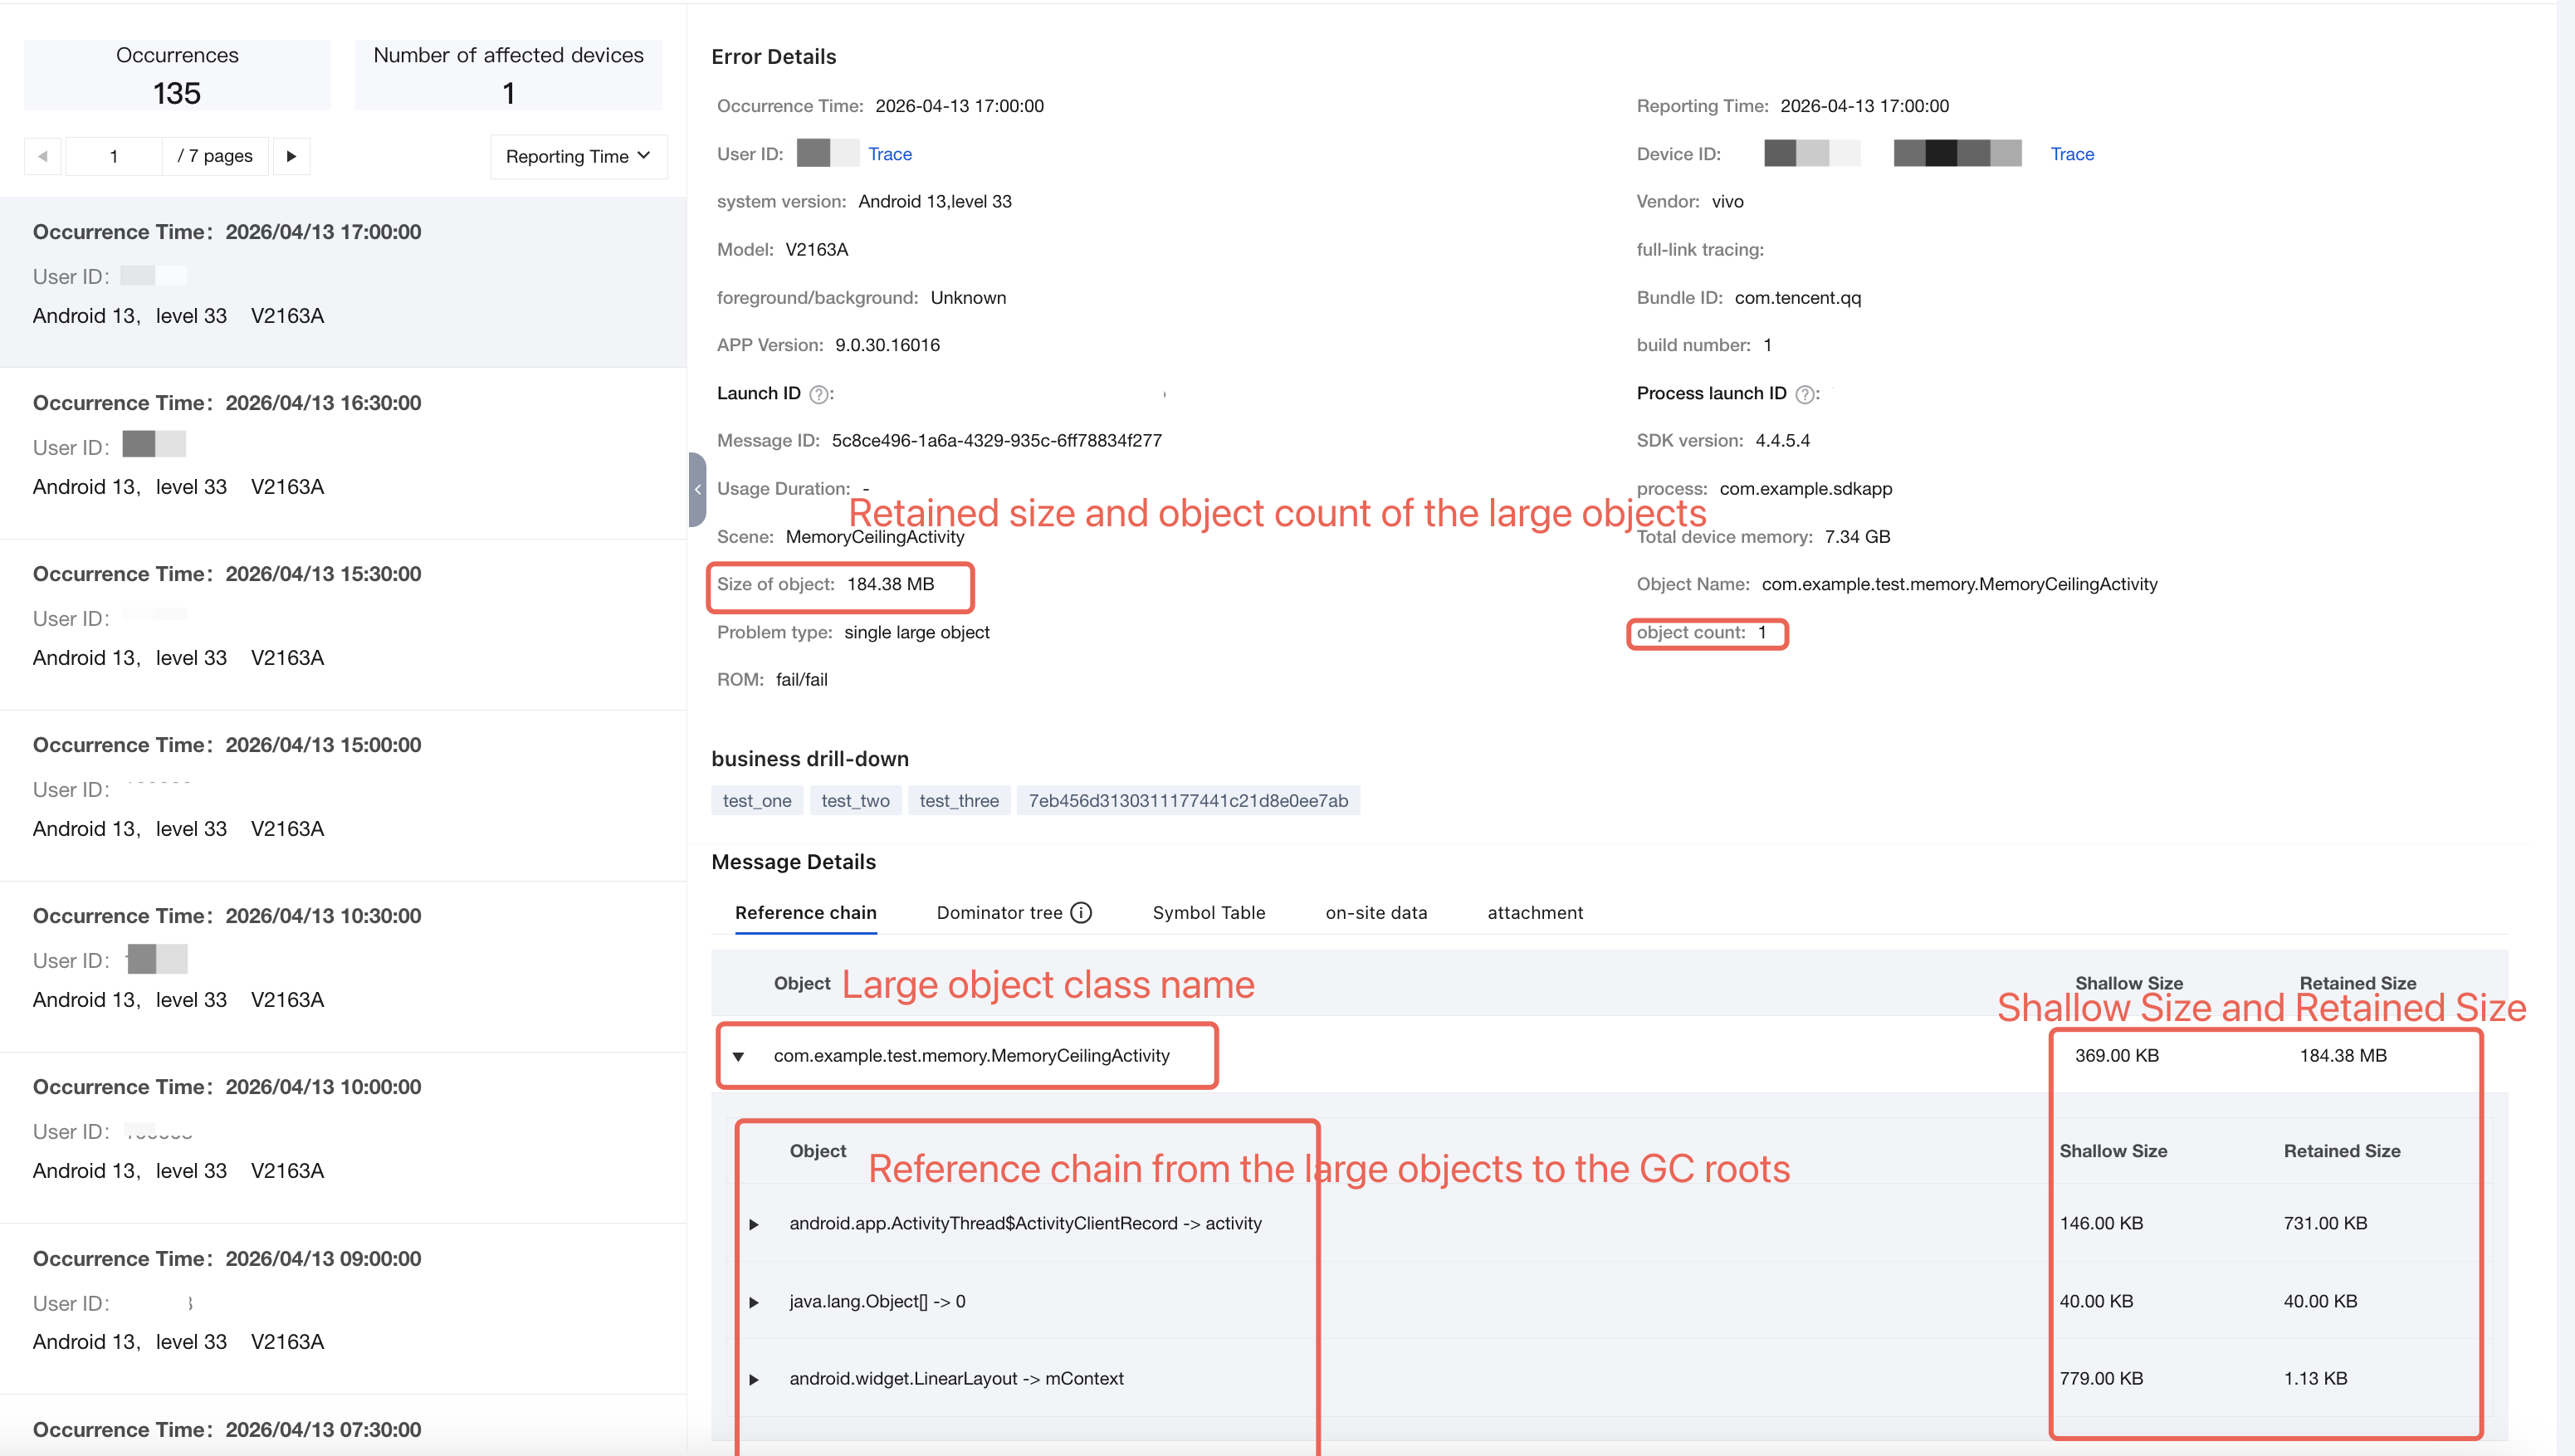
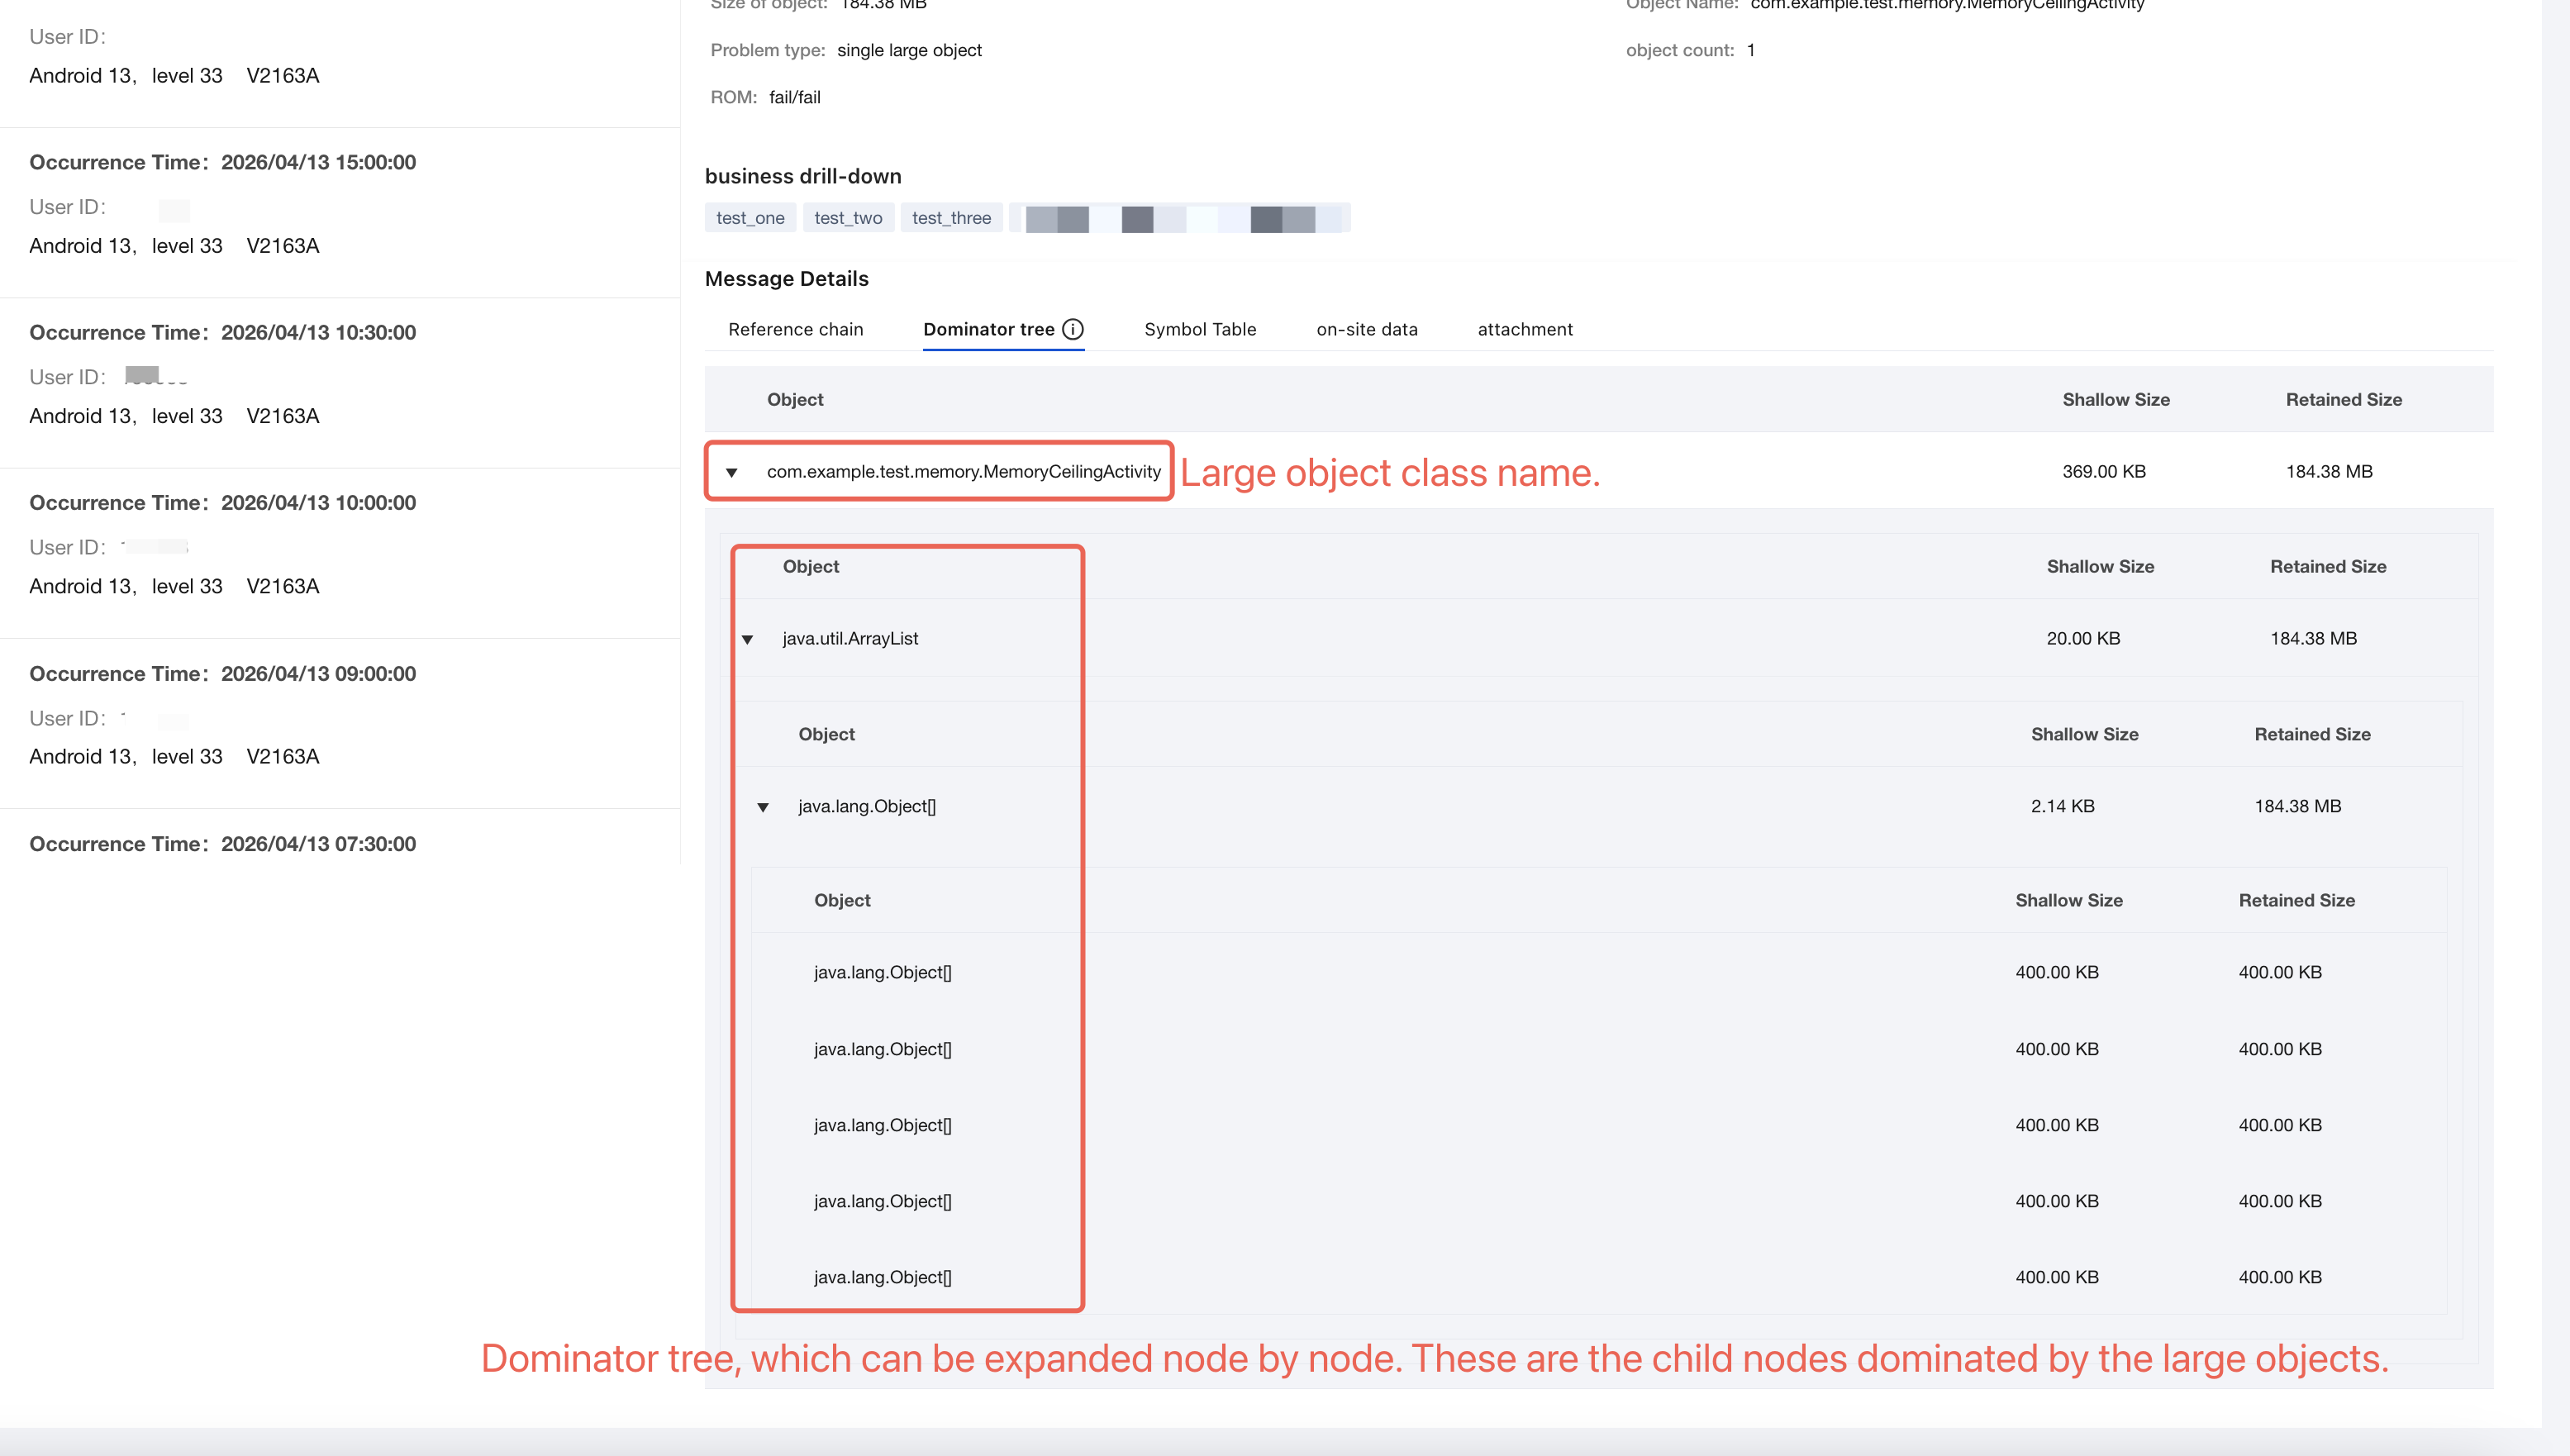
The issue details page for single large objects and dense objects displays all GC Root reference chains and the memory dominator tree of the large object. To reduce display hierarchy, the dominator tree by default only shows child node content greater than 10% of the parent node's size. If a leaf node is an array, its elements will continue to be printed. Additionally, in the Attachments Tab, you can download the original heap dump hprof file. After conversion using the hprof-conv tool, it can be locally analyzed with tools like MAT.
Reference chain:
DominatorTree:
FD Details
The number of FDs a process can use in Android is limited. Once the maximum is exceeded, the process can no longer allocate FD resources. If an FD is opened but not closed promptly, it leads to FD leaks, which can cause issues such as crashes, black screens, and freezes. To address this, the platform has developed a capability to monitor changes in the number of FDs in a process. If a predetermined threshold is reached, detailed FD information at that moment, along with the allocation function call stack for each FD, is reported to the backend.
Enabling Method
The client adds the following code during initialization.
RumProBuilder builder = new RumProBuilder(appID, appKey);build.addMonitor(RumProMonitorName.FD_ANALYZE);
On the Setting > SDK configuration Edit Configuration page, configure according to the following configuration items.
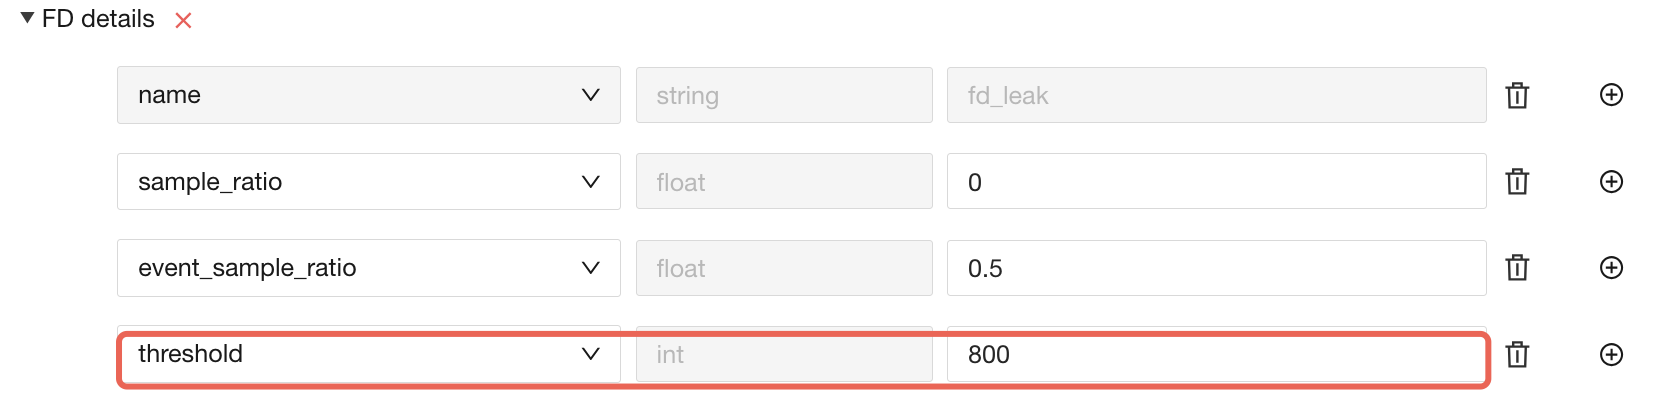
sample_ratio: Only sampled users will have the FD detail monitoring feature enabled. 0 turns off this feature for all users, while 1 enables it for all users.
event_sample_ratio: The probability of reporting when a sampled device reaches the FD threshold. 0 means no FD threshold events are reported, while 1 means all FD threshold events are reported.
threshold: Sets the threshold for FD reaching the limit. For example, if set to 800, logs will be reported when the number of FDs reaches 800.
Log Description
//1. FD threshold monitoring feature enabled successfully log05-16 16:33:38.737 19194 11716 I RMonitor_FdLeak_Monitor: fd leak monitor started.//2. Log when FD threshold reached is detected.05-16 16:33:48.815 19194 11716 I RMonitor_FdLeak_Trigger: top fd: FdStatisticItem{type=8, count=1654}//3. Log for dumping reporting information05-16 16:33:48.863 12359 12359 I .example.sdkapp: hprof: heap dump "/storage/emulated/0/Android/data/com.example.sdkapp/files/Tencent/RMonitor/main/fd_leak/dumpN/A_root/heap.hprof" starting...//4. Log reporting (reported immediately under WiFi; reported after process restart under other conditions)05-16 16:37:17.697 19195 13956 I RMonitor_report_File: url: https://rmonitor.qq.com/v1/*********/upload-file?timestamp=1715848637695&nonce=44ef8384331c486250d430b78a29a18a, sub_type: fd_leak
Console Feature Description
The Web page for FD details is similar to that for Java memory leaks. For specifics, refer to Java Memory Leak Console Feature Description.
Native Memory Details
Native memory usage monitoring has always been a challenge on the Android platform. Google has developed various tools for this purpose, but most are designed for local debugging and often encounter issues such as compatibility problems and crashes. The platform's Native memory reaching the threshold intercepts memory allocation and deallocation in processes, captures function call stack information for memory allocations, and reports these unreleased memory allocations along with their call stack information to the backend when the process's memory (PSS or VSS) reaches a certain threshold. Users can search and analyze these memory threshold issues through the platform's Web page.
Enabling Method
The client adds the following code during initialization.
RumProBuilder builder = new RumProBuilder(appID, appKey);build.addMonitor(RumProMonitorName.NATIVE_MEMORY_ANALYZE);
On the Setting > SDK configuration Edit Configuration page, configure according to the following configuration items.

sample_ratio: The device sampling rate, which indicates the proportion of devices allowed to enable relevant monitoring items.
event_sample_ratio: The event sampling rate, which controls the sampling rate for dumping memory and reporting data when a memory threshold (VSS or PSS threshold) is reached.
Console Feature Description
The Web page for Native memory details is similar to that for Java memory leaks. For specifics, refer to Java Memory Leak Console Feature Description.
Big Graph Analytics
Large bitmaps, also known as over-decoded images, refer to situations where the decoded bitmap's width and height exceed those of the View containing it. The large bitmap monitoring mechanism registers an ActivityLifecycleCallback. When onGlobalLayout occurs for the DecorView, it traverses all Views in the DecorView tree to check whether the width and height of the bitmap corresponding to each View's background or src image exceed the View's actual dimensions. If so, that bitmap is identified as a large bitmap (over-decoded).
Enabling Method
The client adds the following code during initialization:
RumProBuilder builder = new RumProBuilder(appID, appKey);build.addMonitor(RumProMonitorName.MEMORY_BIG_BITMAP);
On the Setting > SDK configuration Edit Configuration page, configure according to the following configuration items.
sample_ratio: The user sampling rate for the large bitmap monitoring feature. 0 indicates that all users disable this feature, 1 indicates that all users enable this feature.
threshold: The large bitmap determination threshold. 150 represents 150%. A bitmap is identified as a large bitmap when (Bitmap width / View width > threshold) or (Bitmap height / View height > threshold).

Log Description
After a large bitmap is detected by the platform, it attempts to immediately report the issue, and typically prints the following log during the reporting process:
06-09 17:00:23.000 31628 31822 D RMonitor_report_Json: url: ***** eventName: BigBitmap, client_identify: ********
Console Feature Description
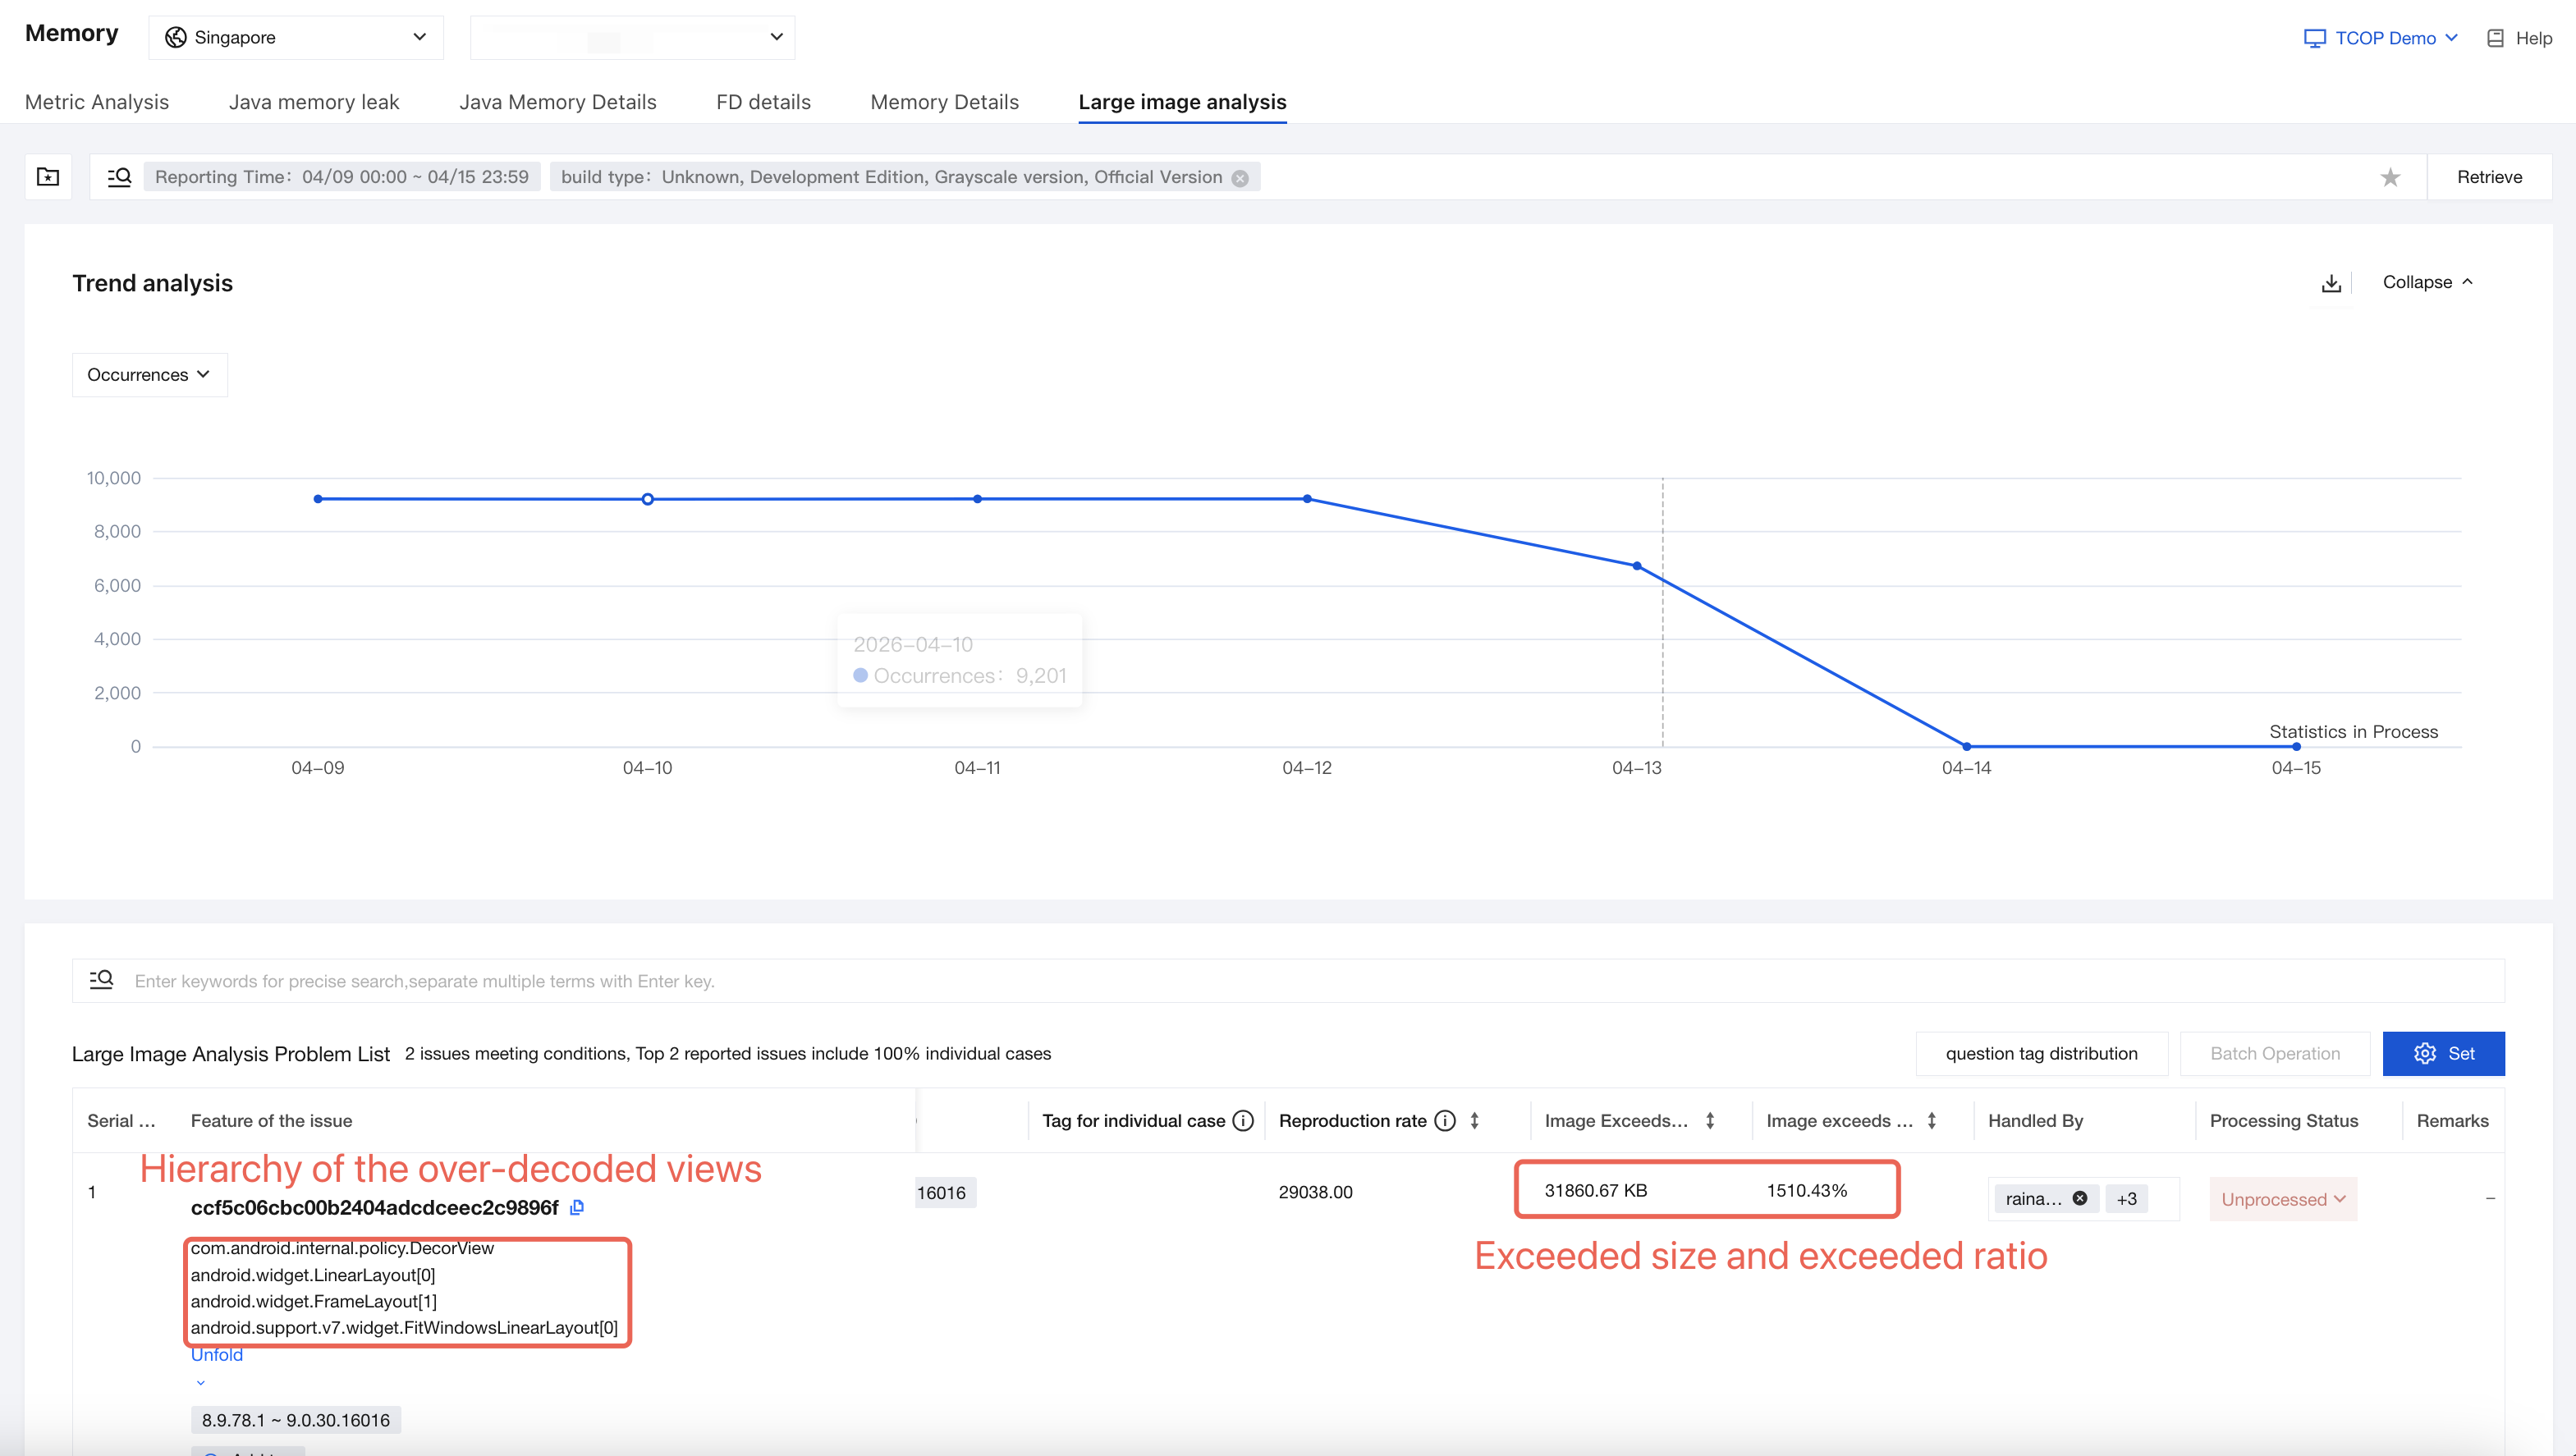
Problem List
By using the layout hierarchy of the over-decoded image's View as a feature aggregation problem.
It supports sorting by exceeding image size and exceeding ratio, allowing for quick identification of images with severe decoding excess.
Issue Details
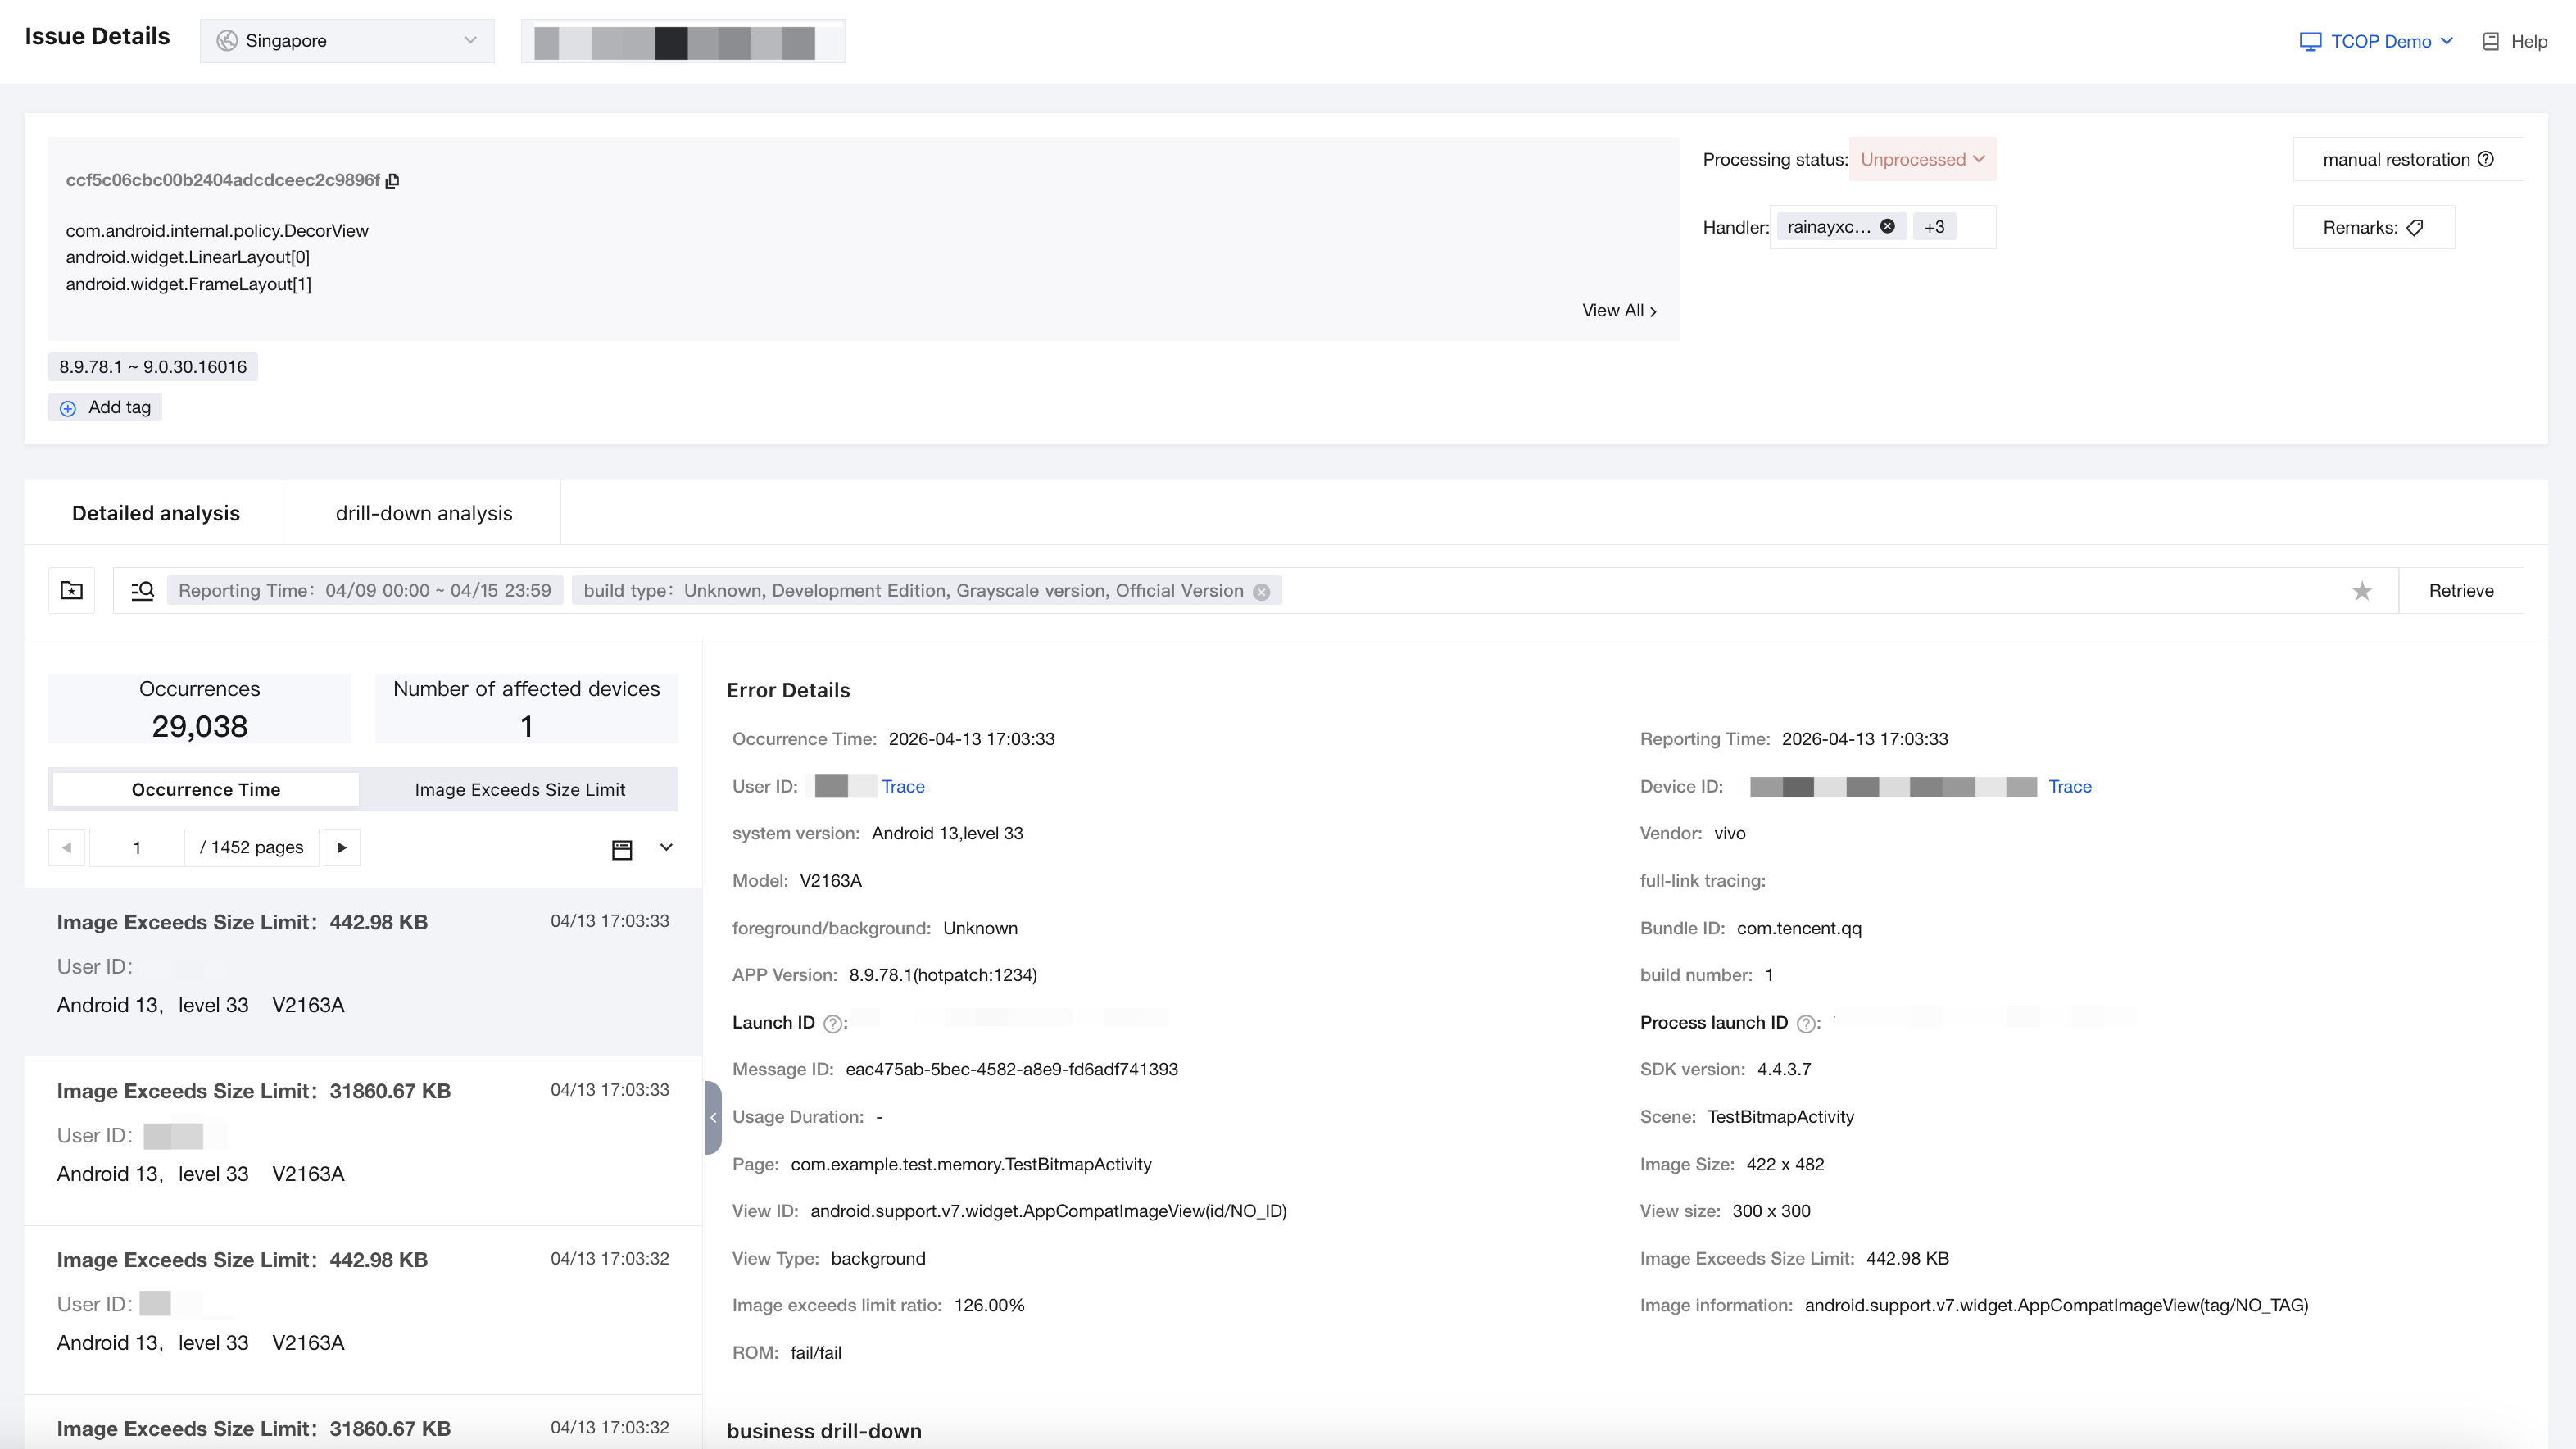
Users can identify corresponding business scenarios based on contextual information and the layout hierarchy of the displayed View.
Field | Description |
Image Size | Refers to the size of the image after decoding, measured in pixels, for example: 422 * 482. |
View Size | Refers to the size of the View that carries the image, measured in pixels. |
Image exceeds limit ratio | Refers to the ratio of the image's pixel count to the View size, calculated as (Image pixels / View pixels) - 1 to derive the excess percentage. For example: ((422*482) / (300*300)) - 1 = 126.00%. |
Image Exceeds Size Limit | It is calculated as (Total image pixels - Total View pixels) / 1024 to obtain the exceeding value in KB. For example: ((422*482*4) - (300*300*4)) / 1024 = (813,616 - 360,000) / 1024 = 442.98 KB. |
View Type | This field has two values: background represents the background image resource obtained by calling View.getBackground. source represents the decoded image resource obtained by calling View.getDrawable. |
Page | From the screenshot above, this case occurs on the com.example.memory.TestBitmapActivity page, which is the Activity hosting the View with exceeding image size and cannot be customized. |
Scene | The scene field defaults to the current Activity, but its value can be customized by the business using Bugly.enterScene and Bugly.exitScene. For example, if an Activity contains multiple Fragment switches, the scenario field can identify which Fragment is active after switching. |
Example Analysis
Taking the issue in the above problem details as an example, the Page field indicates that the image size exceeding occurred on "com.example.memory.TestBitmapActivity". Additionally, the Page field can be combined with the Scenario field to provide more precise contextual information when locating issues.
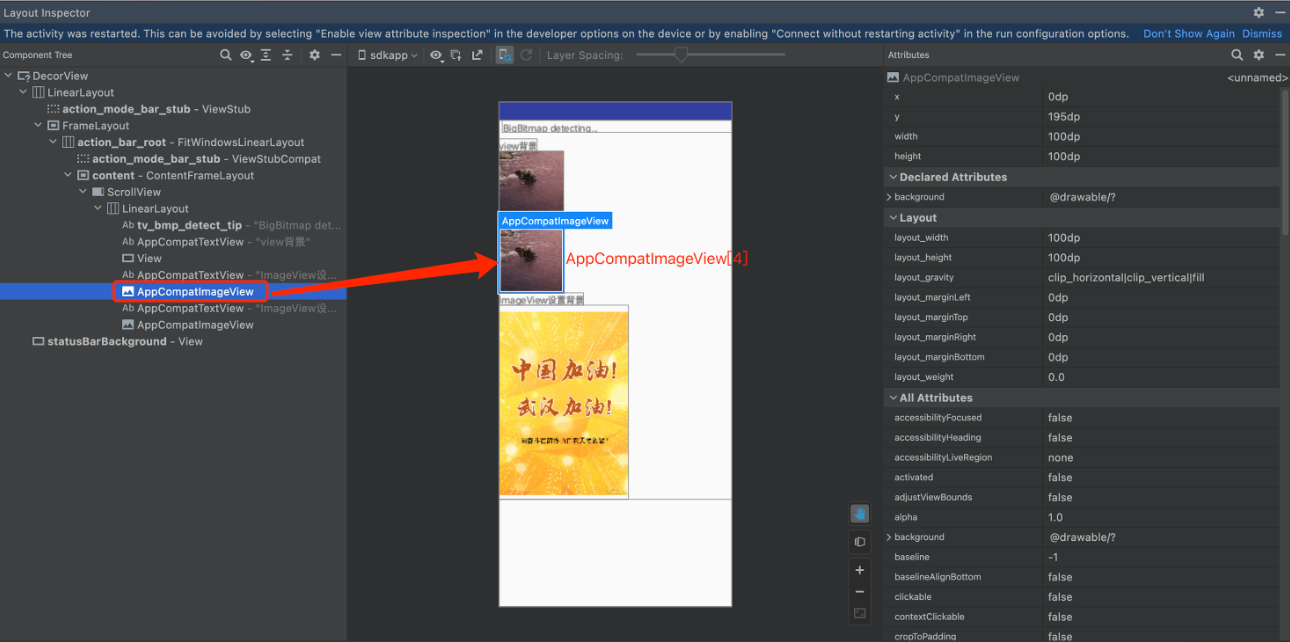
Then, from the stack details, it can be seen that the over-decoded element is an AppCompatImageView, and the hierarchy of the View can be observed.
com.android.internal.policy.DecorViewandroid.widget.LinearLayout[0] // Here, 0 represents the first child View of the DecorView.android.widget.FrameLayout[1] // Similarly, here, 1 represents the second child View of the LinearLayout.android.support.v7.widget.FitWindowsLinearLayout[0]android.support.v7.widget.ContentFrameLayout[1]android.widget.ScrollView[0]android.widget.LinearLayout[0]android.support.v7.widget.AppCompatImageView[4] // The View containing the final large image is the fourth child View of android.widget.LinearLayout.
It is the fourth child View of the LinearLayout. Therefore, we can locate this View using tools such as Android Studio's Layout Inspector, as shown in the figure below:
iOS
Overview
Memory Monitoring is used to monitor and measure the memory usage of apps in production. As a critical resource in devices, memory is shared among various processes within the system. According to iOS system policies, excessive memory usage in the foreground may result in termination by the system; similarly, occupying substantial memory resources in the background can lead to app termination to reclaim resources for foreground apps. Given this, the rational and efficient use of memory resources is particularly crucial. Therefore, the platform provides a memory monitoring module to help businesses evaluate app memory consumption in production, offering essential diagnostic information to identify and optimize memory-related issues.
Metric Analysis
Memory metrics measure the overall memory usage of the App from a holistic perspective, primarily consisting of two indicators.
Front-end/Back-end Memory Peak
Peak Value refers to the maximum physical memory (phys_footprint) used by the App during a single process lifecycle. A higher peak memory value indicates greater memory consumption under extreme conditions. When active in the foreground, a higher peak increases the likelihood of encountering memory limits; similarly, in the background, a higher peak raises the probability of the App being terminated by the system. Therefore, the peak metric is categorized by foreground/background states as Front-end memory peak and Back-end memory peak.
Front-end memory peak: The higher this value, the greater the probability of FOOM occurrence. Generally, its upward trend (especially P99) is positively correlated with the FOOM rate.
Back-end memory peak: The last memory value collected by the SDK when the app moves to the background. Higher background memory usage increases the probability of the app being terminated by the system. Therefore, it is necessary for businesses to optimize the app's memory usage after backgrounding. Since this metric is collected in-process by the SDK, its value tends to be slightly higher than the system's actual measurement, serving primarily as a reference value.
The peak metric, similar to other metrics, supports querying and comparison with different time granularities and filter criteria. For specific operations, please refer to the Integration Guide.
FOOM rate
FOOM (Foreground Out Of Memory): This is defined as the scenario where an App is terminated by a SIGKILL signal after triggering the system's memory limit while in the foreground.
Since FOOM is a Crash caused by the SIGKILL signal from the system, it differs from typical crashes triggered by internal exceptions (which result from abnormal logic execution within the process). Therefore, traditional Crash rate metrics do not account for this type of exit. Additionally, since the SIGKILL signal cannot be directly captured within the process, it is impossible to record accurate FOOM exit events.
In the platform, FOOM events are determined by comprehensively analyzing various states during the App lifecycle, such as whether the App is in the foreground/background, whether any captured exceptions occurred, and the App's last memory usage, to infer whether a FOOM event has occurred. Therefore, FOOM determination results may include some misjudged data (misjudgment refers to incorrect identification of the exit cause, though it always indicates an abnormal exit).
The iOS system terminates apps not only when memory usage is excessively high, but also under conditions such as device overheating, excessive CPU scheduling, or triggering excessive I/O operations.
Note:
The FOOM rate is the ratio of FOOM occurrences to the number of process launches, measuring the frequency of FOOM events. Additionally, metrics are included from both device and user perspectives: Device FOOM Rate and User FOOM Rate. Both rates are calculated after deduplication based on Device ID and User ID.
Despite containing a certain degree of misjudgment, this metric still effectively measures the severity of Apps being terminated by the system in the foreground due to excessive memory usage.
Memory diagnostic information
To help businesses optimize the above metrics, the platform provides relevant diagnostic information alongside the metrics. The primary purpose of diagnostic information is to offer insights into key memory usage patterns, enabling businesses to analyze the main causes of excessive memory consumption and determine how to optimize it. Unlike typical Crash issues, memory usage problems differ in nature. The data collected and provided by the platform does not pinpoint the exact cause of FOOM occurrences.
Note:
In general crashes, the issue occurs when the program encounters an exception during execution at a specific point. Therefore, the captured call stack and contextual data precisely indicate the point of exception occurrence, which can be analyzed and resolved.
The essence of FOOM issues lies in the excessive consumption of memory resources. Therefore, a single memory allocation record cannot conclusively indicate unreasonable memory usage. It requires analyzing all memory allocations within the App to identify business logic that consumes large and unreasonable amounts of memory, followed by optimization based on business requirements. For this reason, diagnosing FOOM memory issues necessitates collecting more information, which inherently introduces performance overhead in the monitoring logic itself. To prevent this monitoring overhead from impacting normal business operations, the platform employs a sampling mechanism (default 1%) during memory diagnostic data collection. Consequently, detailed information is unavailable for the vast majority of individual FOOM cases.
VC memory leak
VC leaks refer to situations where UIViewController and its related child objects in iOS apps are not released after use (e.g., pop, dismiss, remove) (with a default 30-second delay for checks). In native iOS applications, the UIKit framework uses UIViewController as the foundational object for organizing product logic and pages. Consequently, most core app logic revolves around UIViewController. The platform monitors all key behaviors of UIViewControllers and tracks related metric changes. Based on this, unreleased VC objects after use are flagged for abnormal reporting. This allows businesses to verify whether such VC objects are properly released, preventing resource waste from unnecessary retention. You can enable this feature via the following configuration in the Setting > SDK configuration edit page:

In certain scenarios, businesses may intentionally retain specific VC objects without releasing them due to operational requirements. The platform cannot distinguish such cases and will still report them. If businesses wish to exclude these reports, they can add them to the allowlist by following the SDK configuration usage guidelines to filter them out.
Similar to large memory allocations, VC leaks primarily provide the creation call stack and name of the VC, in addition to basic information.
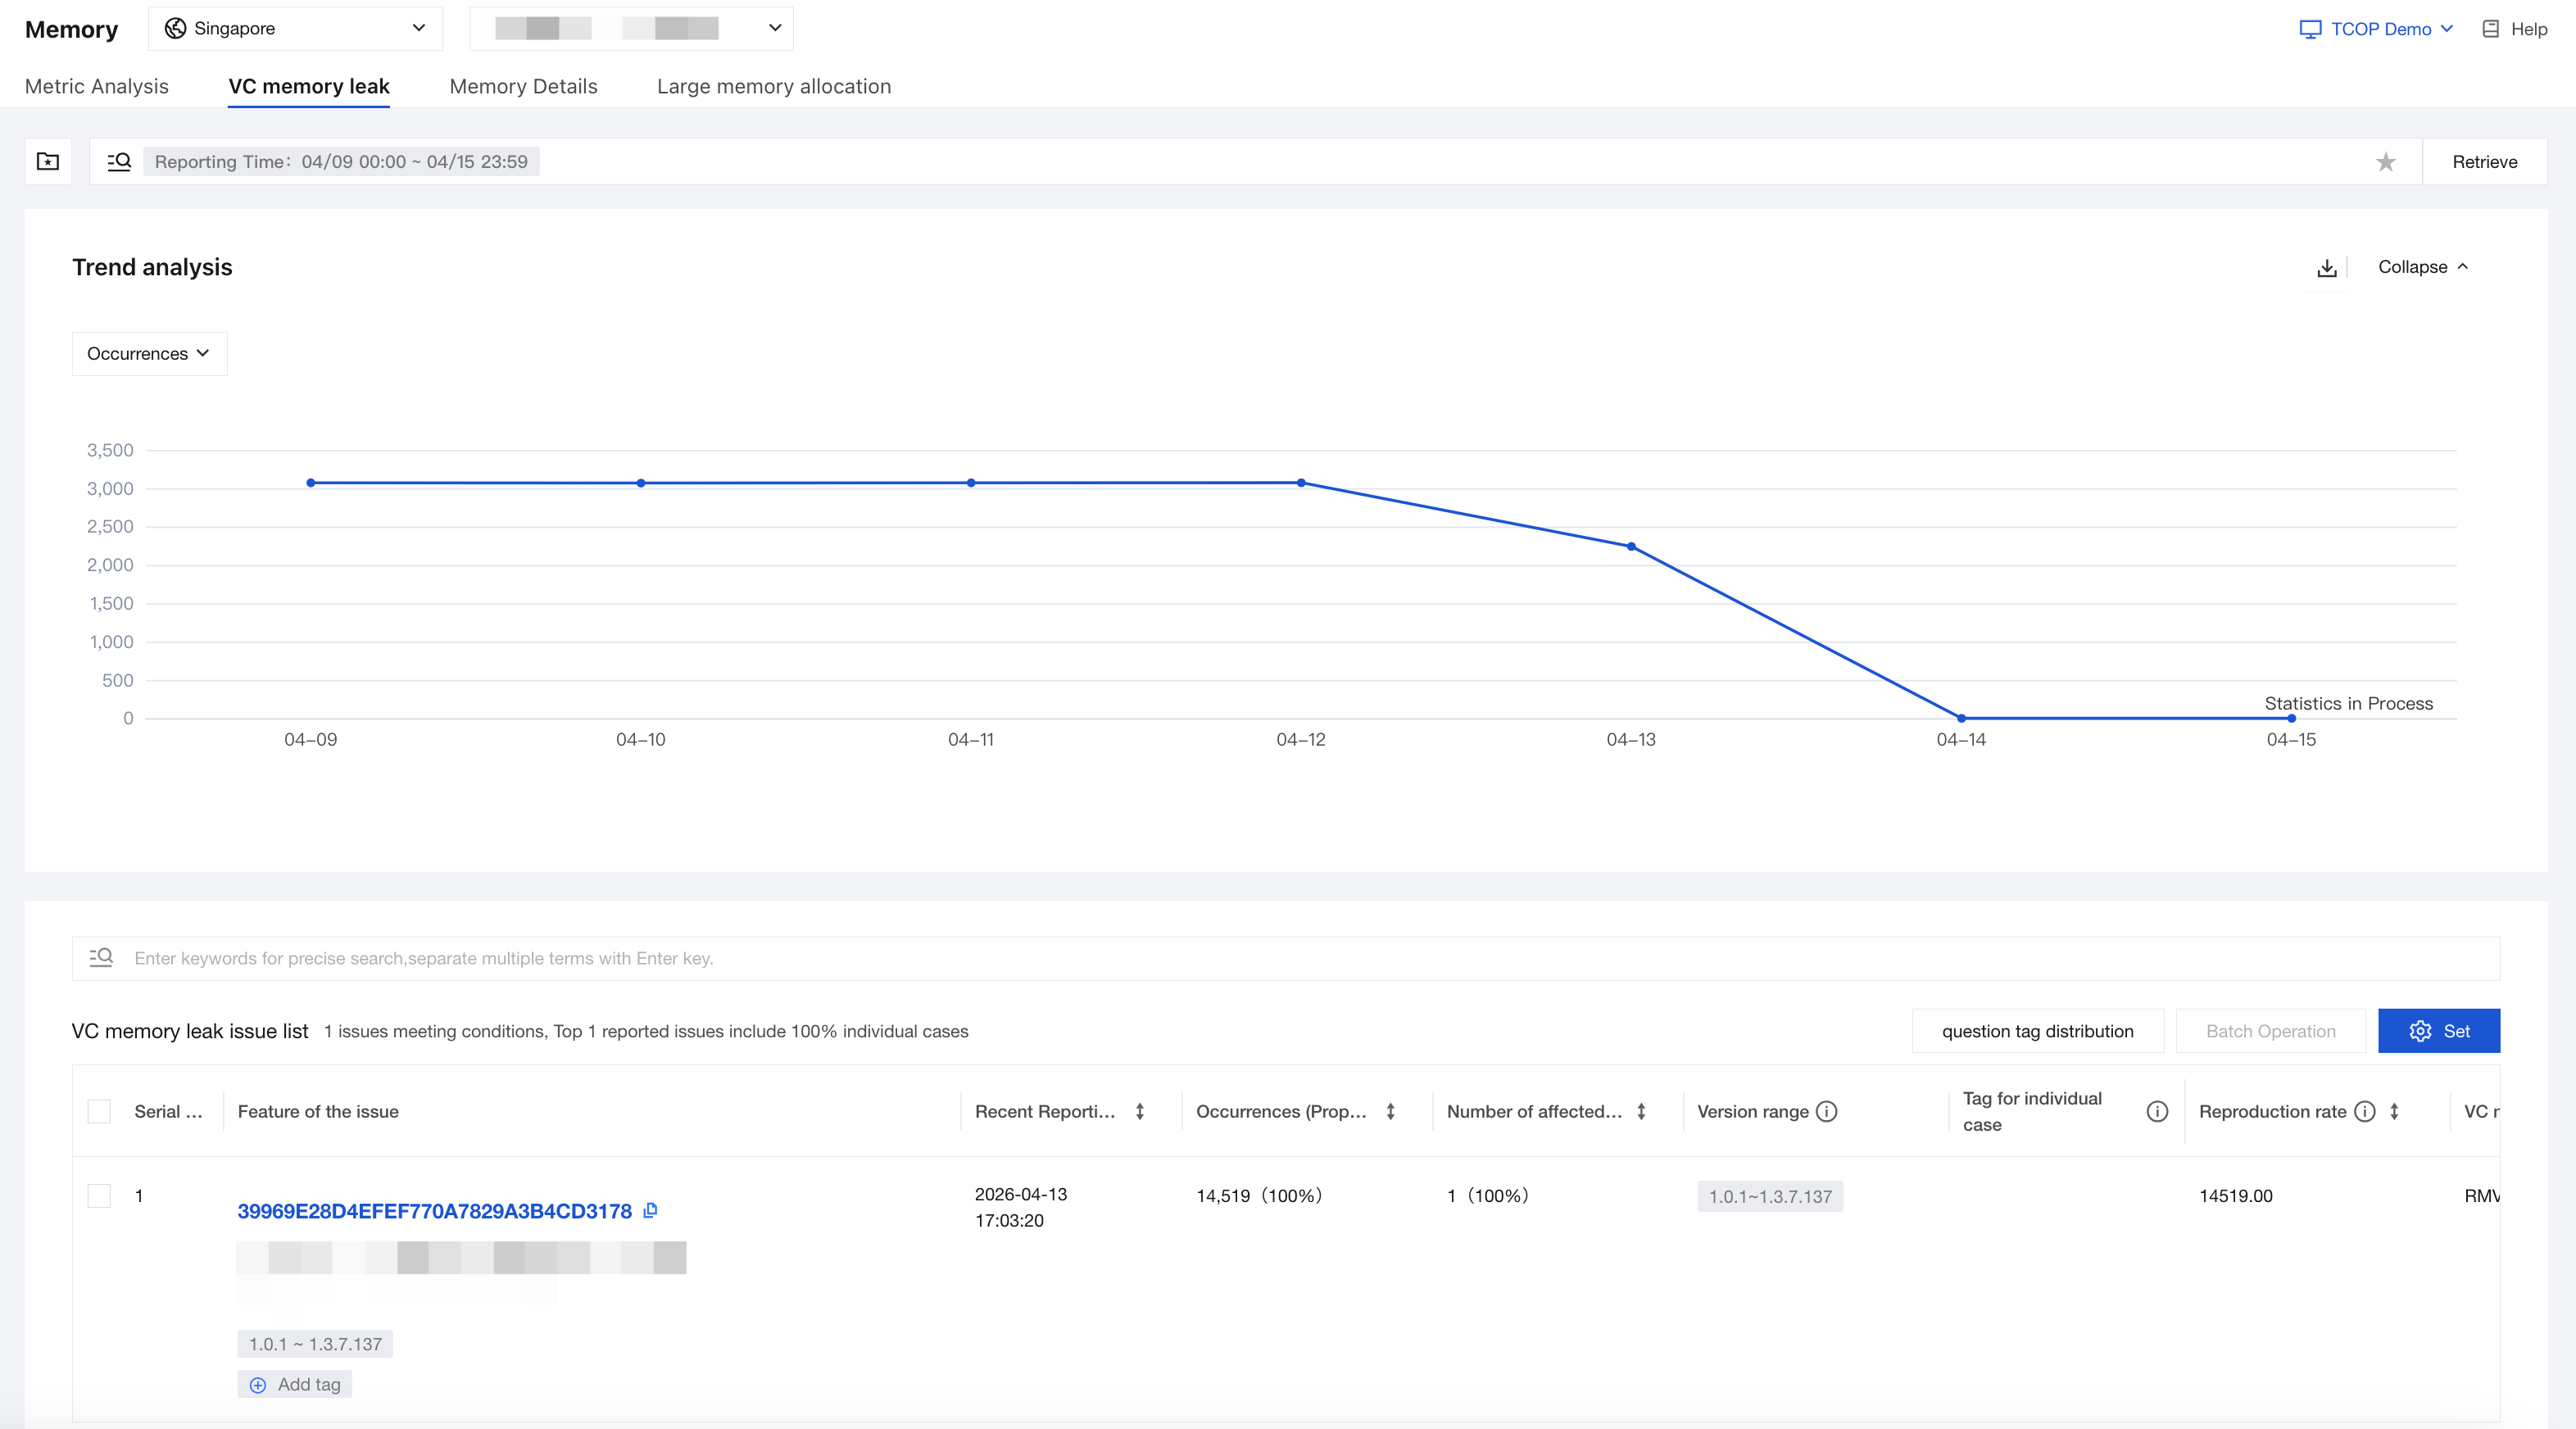
VC Leak Details:
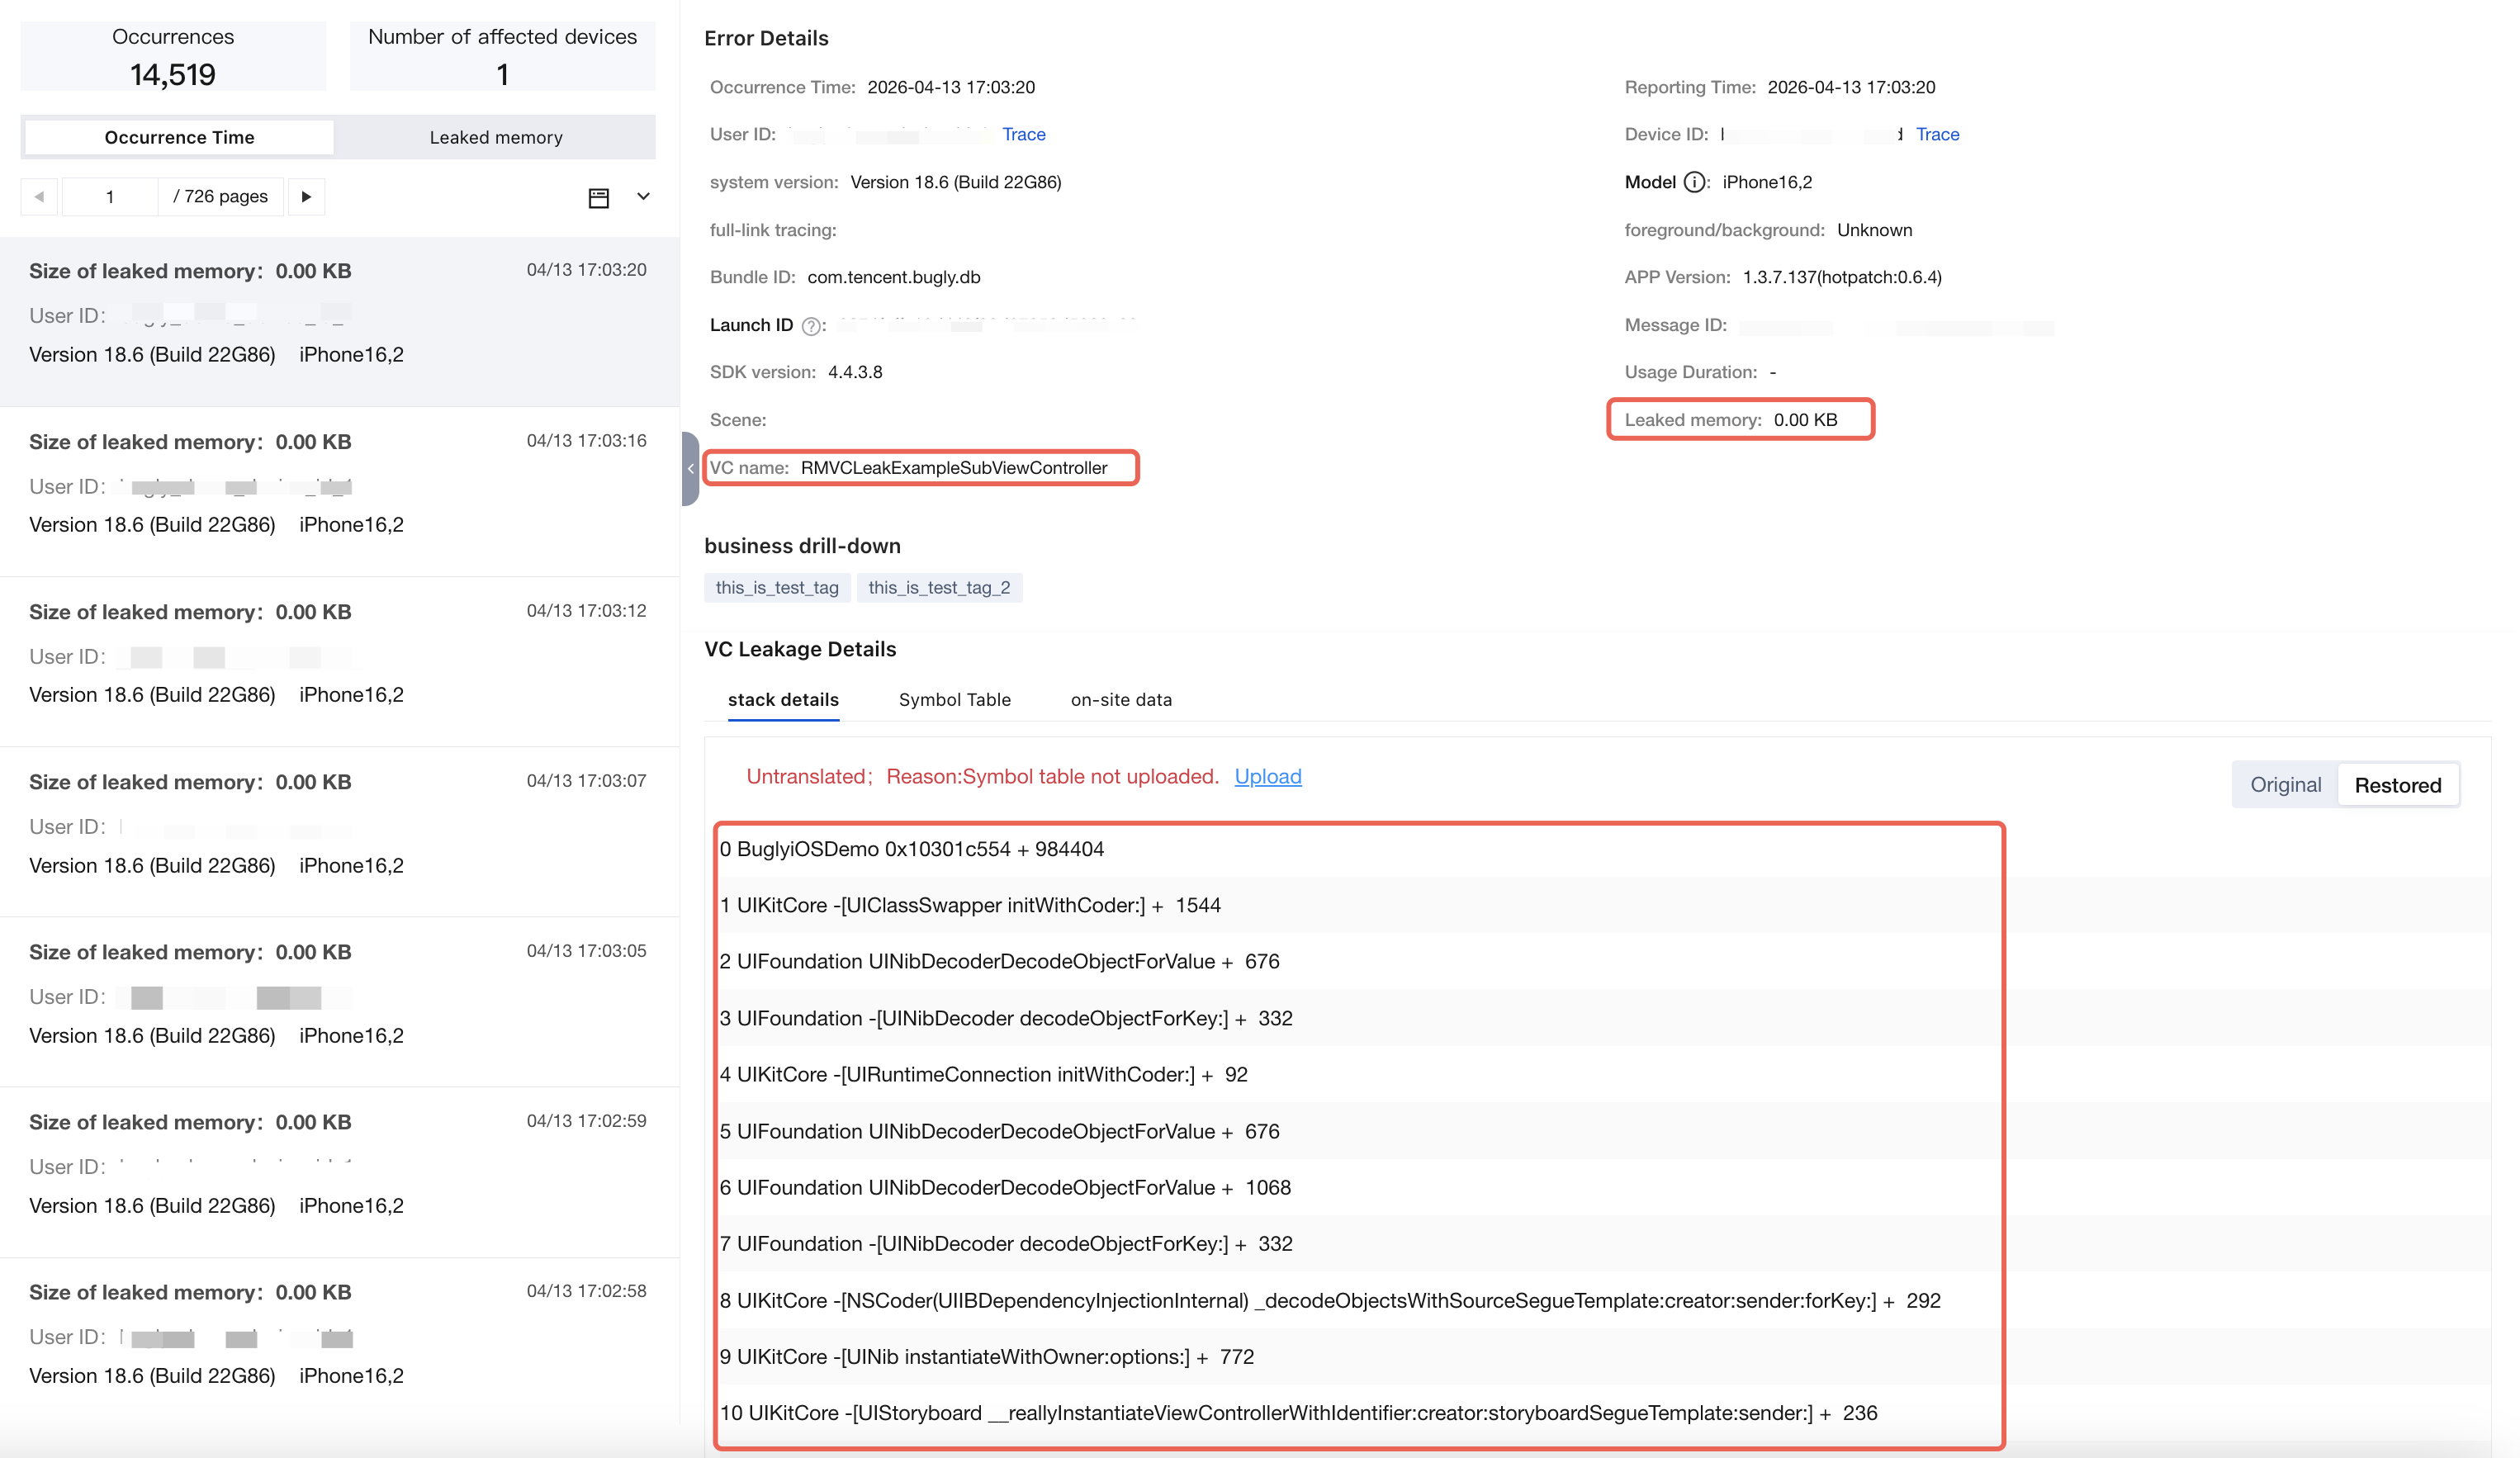
It should be specifically noted that in VC leak cases, the value of "Leaked Memory" represents the difference between the phys_footprint value when the VC was popped (dismissed, removed) and its value at creation time. If the result is negative, it is recorded as 0. Therefore, this serves as a reference value rather than the actual memory leak amount. During usage, more attention should be paid to whether VCs are reasonably retained, and one should not be overly concerned with the specific leaked memory value.
Memory Details
Single-report analysis, single large objects, and dense objects metrics are similar to those on Android. For details, see Android Memory Details.
Reported FOOM cases refer to the detailed information reported by the SDK after detecting a FOOM exit event. The information provided is critical for resolving individual FOOM issues. For details on FOOM case specifics and primary analysis methods, see FOOM Case Details.
Large memory allocation
Large memory allocations serve as an auxiliary monitoring mechanism, primarily tracking abnormal memory allocation events (single allocations exceeding the specified threshold, default 10 MB) during app runtime. Therefore, the reported data is primarily for reference purposes. Businesses should focus on whether such allocations are reasonable rather than assuming they necessarily indicate abnormal issues. You can enable this feature via the following configuration in the Setting > SDK configuration edit page:

In large memory allocations, the platform primarily provides the call stack that triggered the allocation and the allocation size, along with other contextual information such as timestamps and device details. Similar to other case-specific issues, the platform clusters the reported data based on the allocation call stack to form issues, enabling developers to categorize and track problems efficiently.
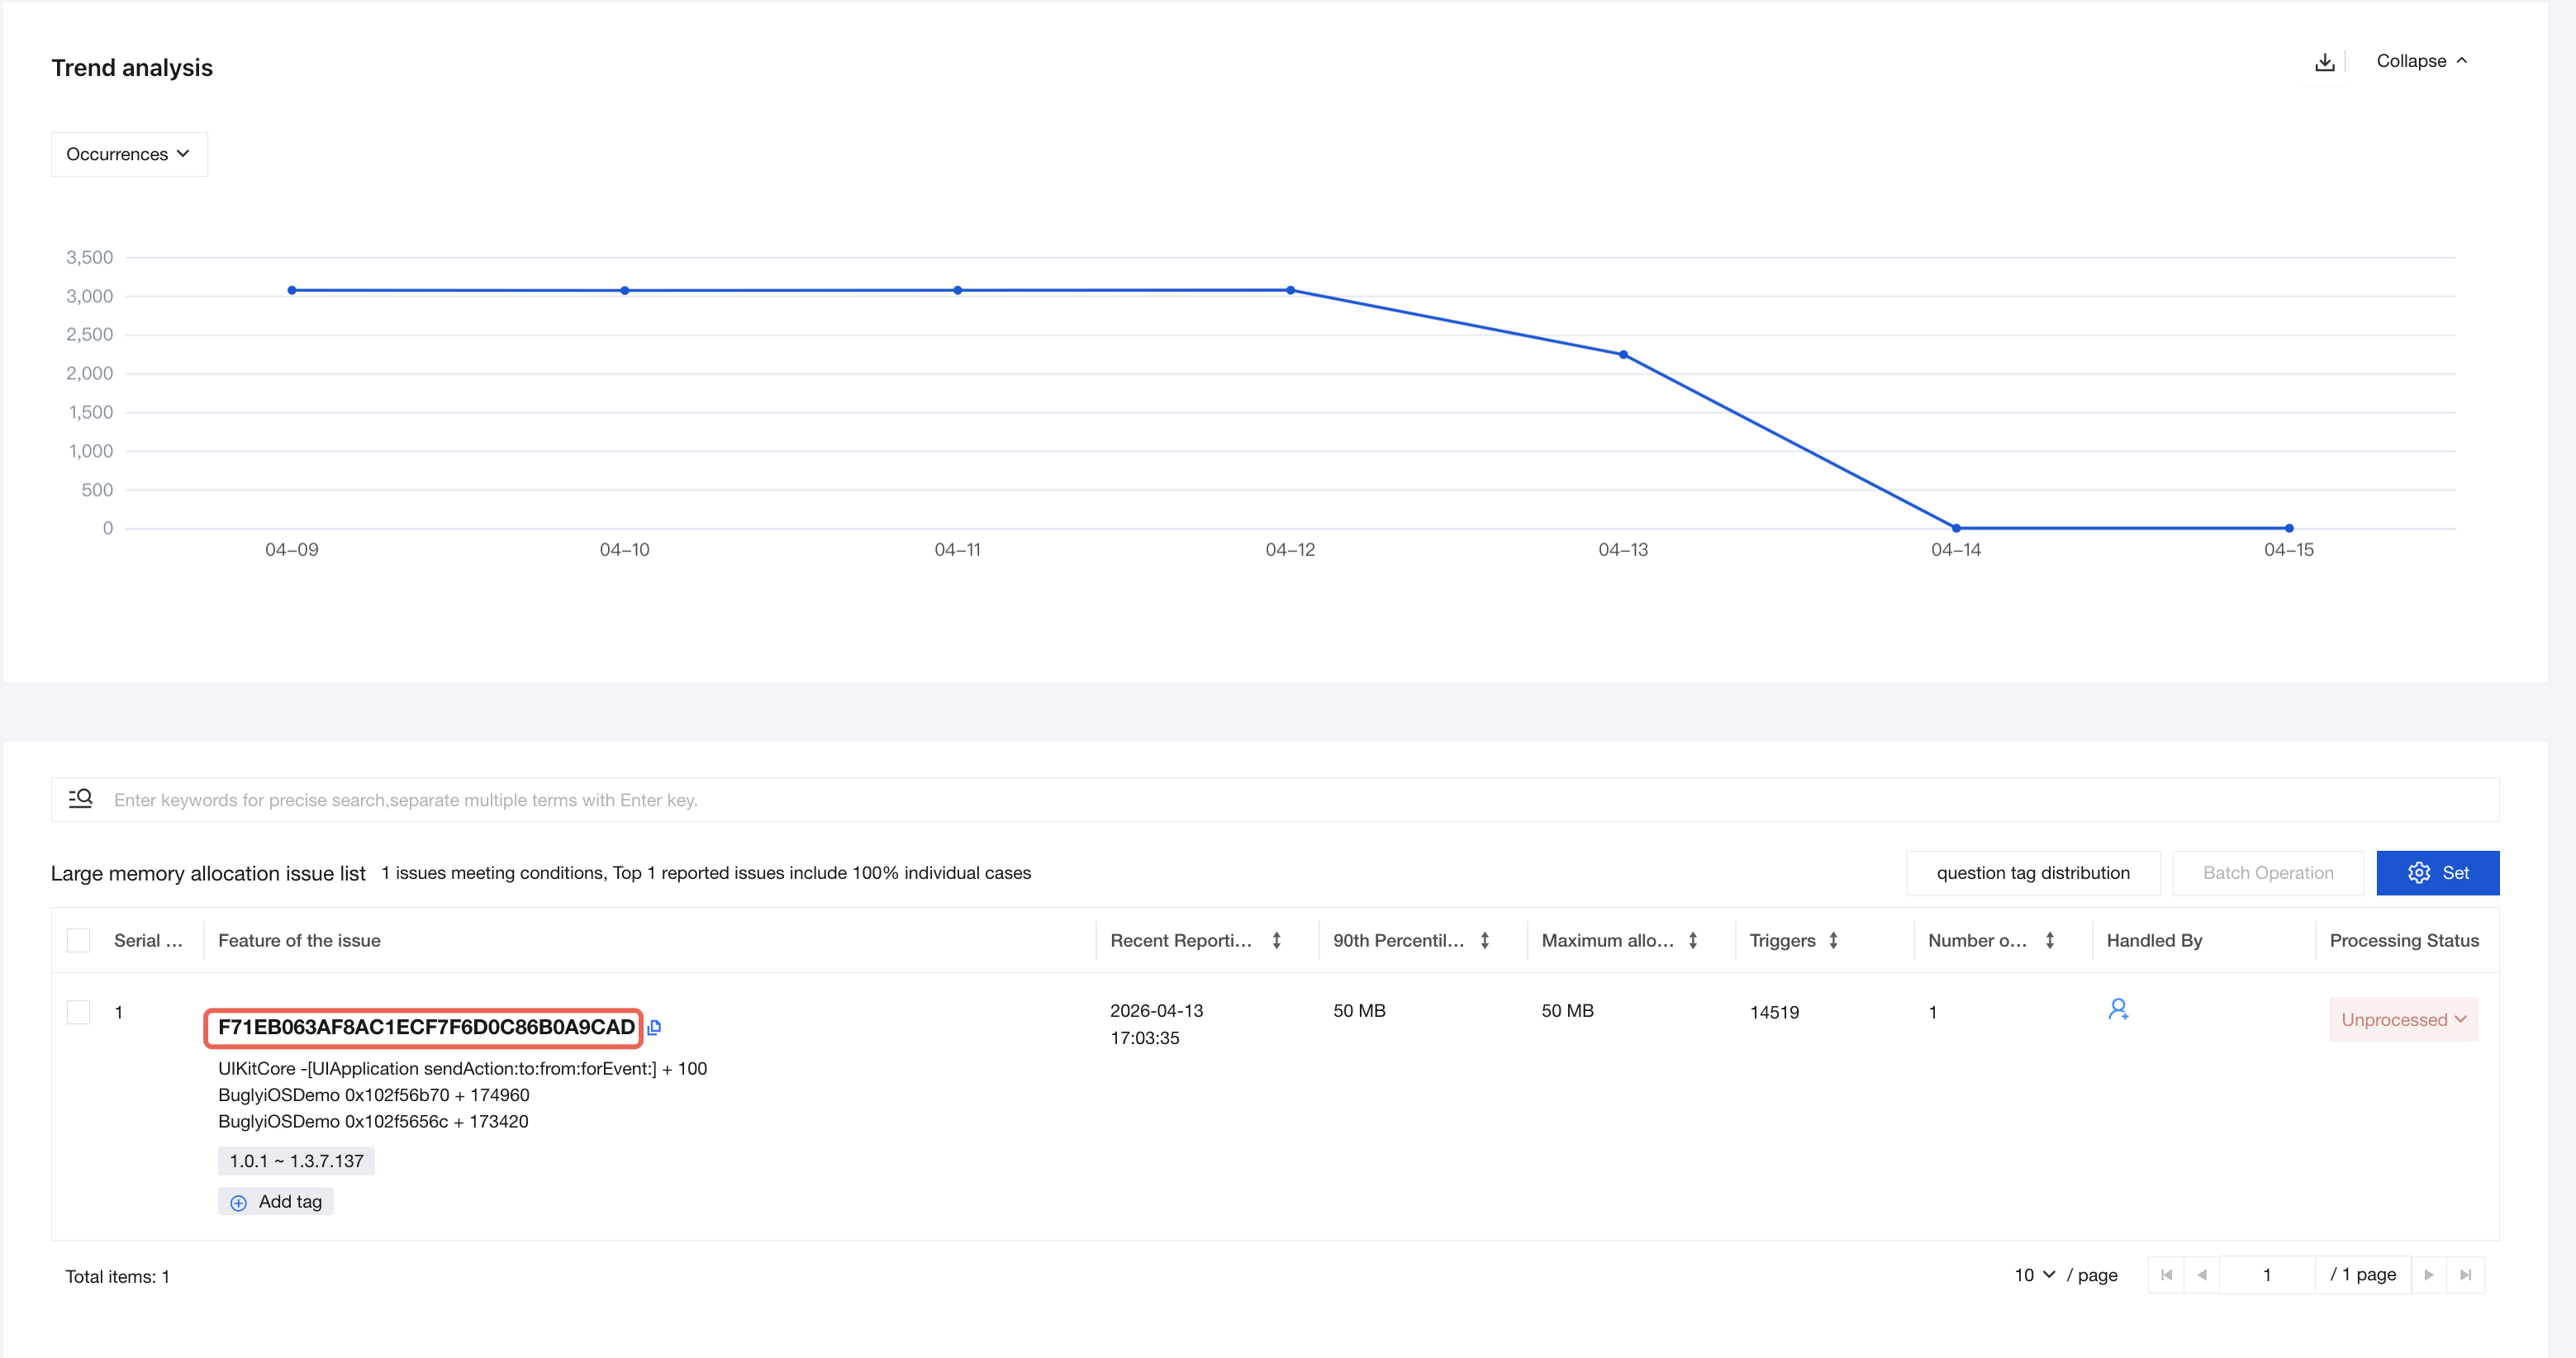
Issue Details:
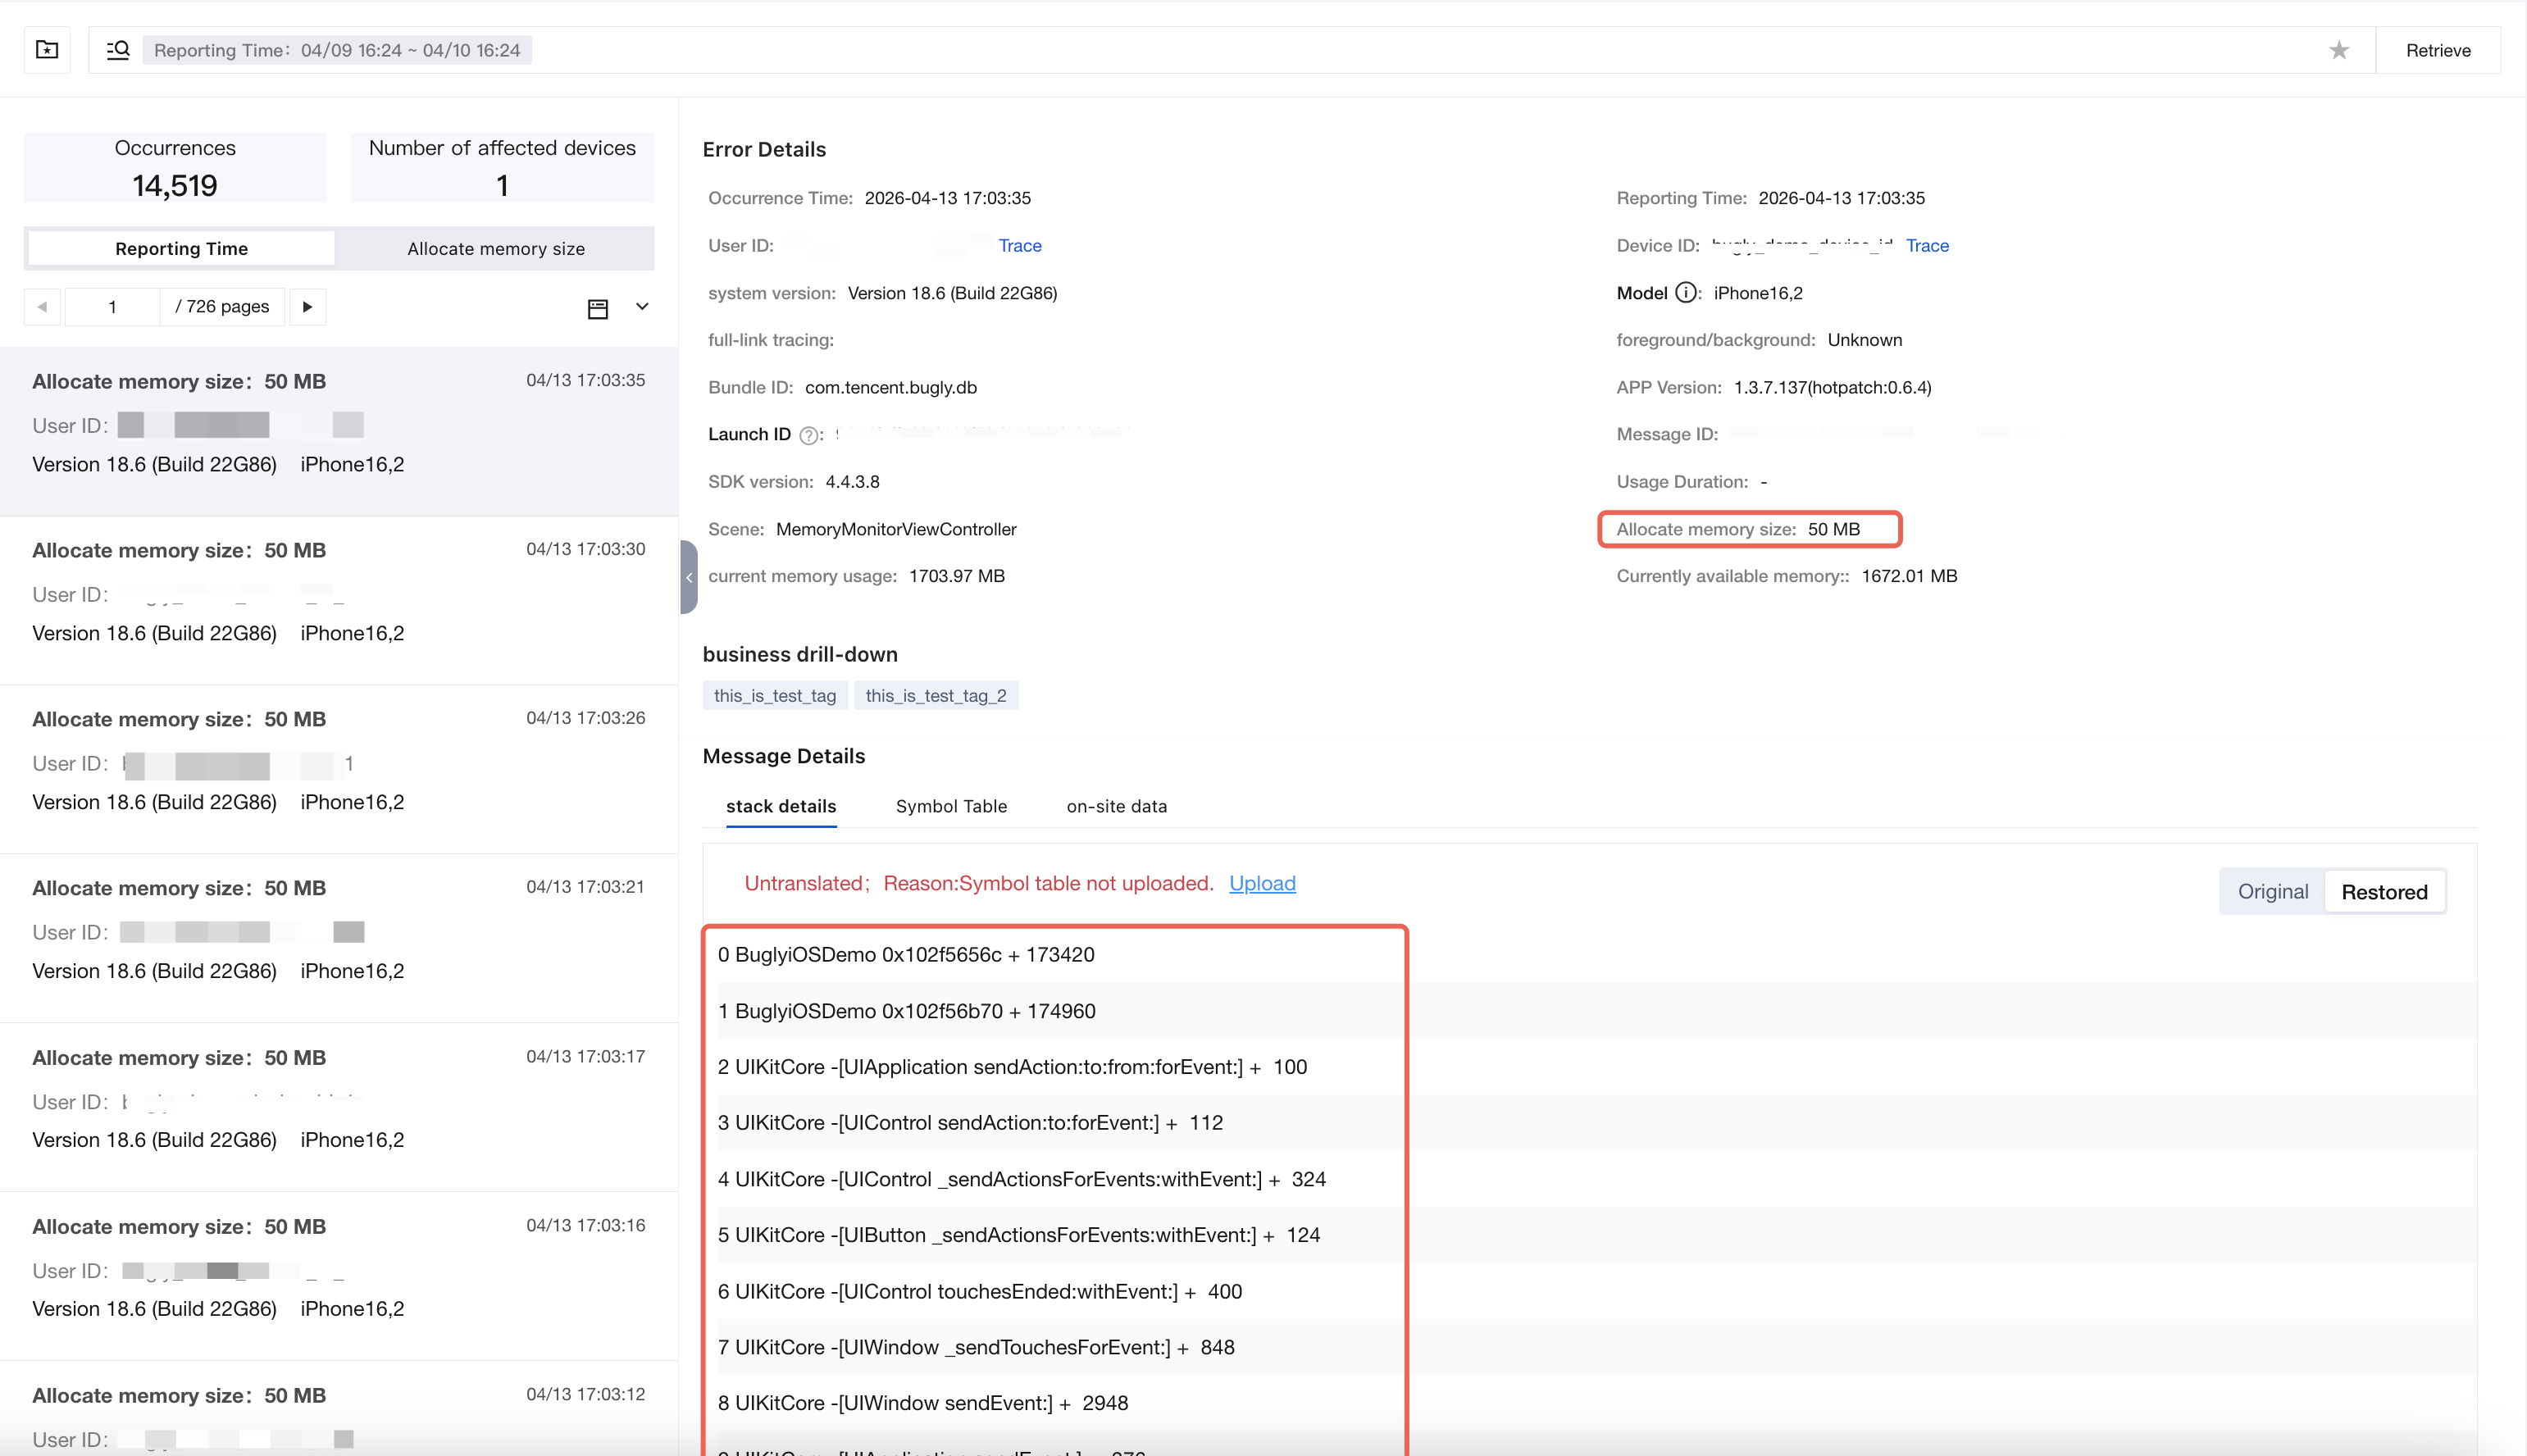
Help and Support
Was this page helpful?
You can also Contact sales or Submit a Ticket for help.
Help us improve! Rate your documentation experience in 5 mins.
Feedback