Network
Download
Focus Mode
Font Size
This article provides an overview of the network monitoring module for Android and iOS platforms, its configuration, and data analysis.
Android
Function Introduction
Network monitoring utilizes OkHttp3's EventListener to monitor the quality of HTTP requests, including request duration, success rate, data transfer volume, and time consumption at key stages during the request process.
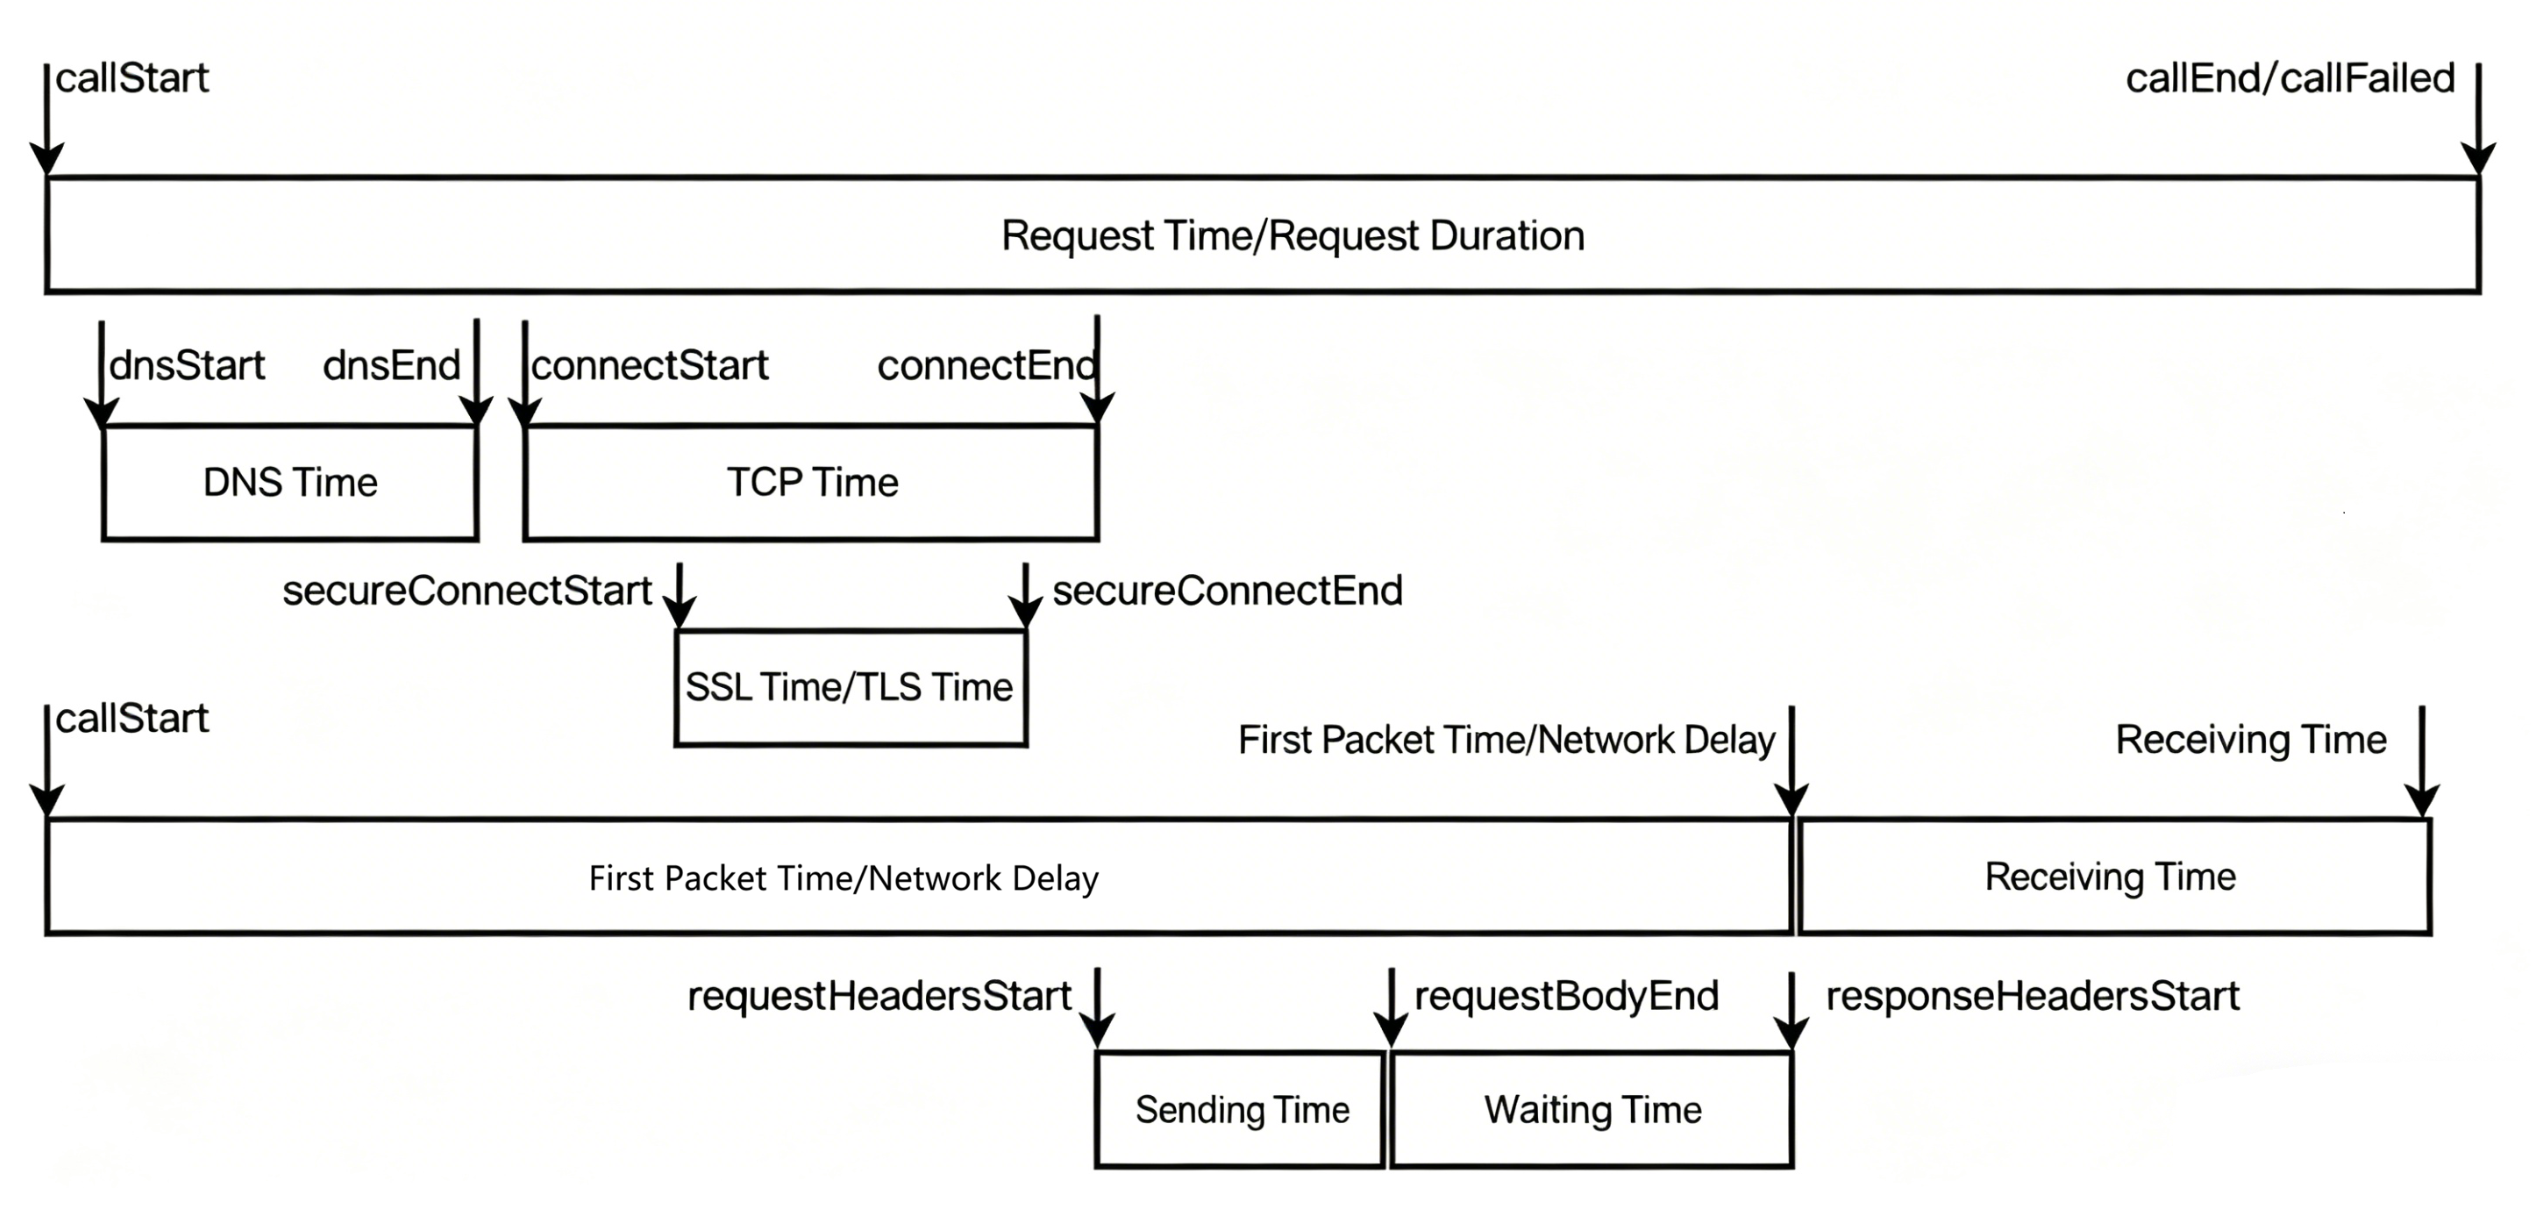
Currently, the following capabilities can be achieved through an instrumentation-free solution:
You can follow the SDK integration guide and use the OkHttpClient created by using BuglyListenerFactory to monitor the quality of HTTP / HTTPS requests.
The BuglyURLStreamHandlerFactory proxies the system's native HttpURLConnection, enabling monitoring of HTTP / HTTPS requests implemented through native APIs.
Open configuration
Network monitoring is disabled by default in the local configuration. You need to enable it on the Portal.
On the Setting > SDK configuration page, configure by adding the net_quality configuration item and adjusting the sampling rate and other configuration items.
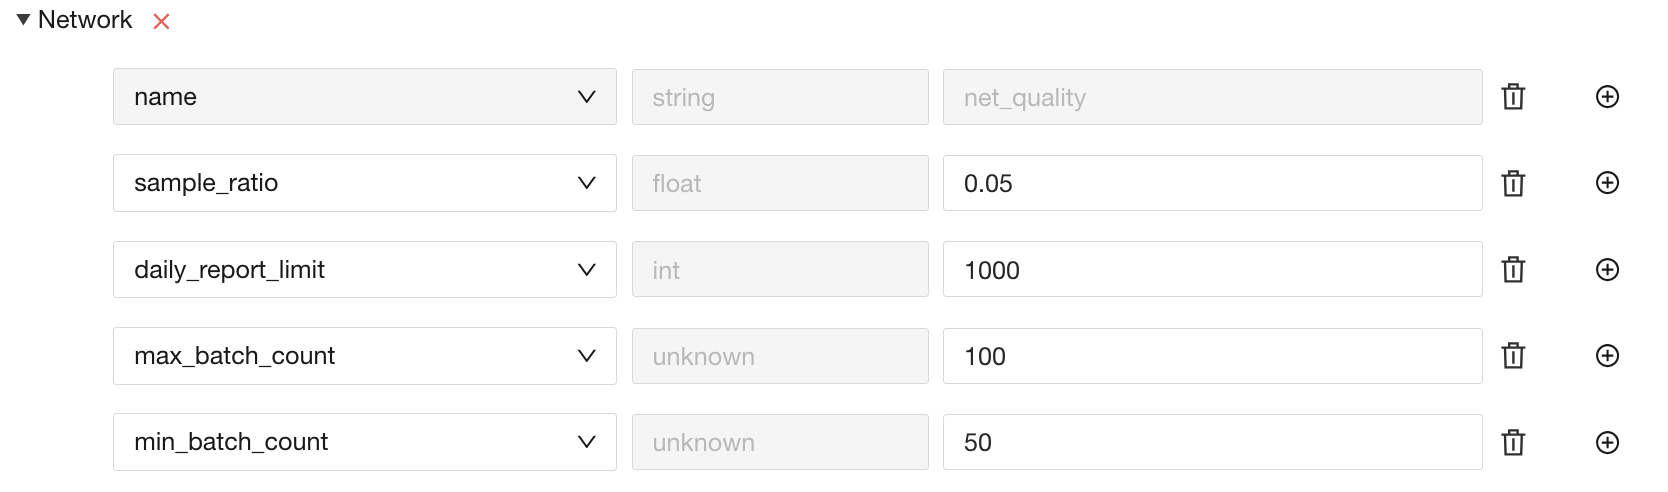
sample_ratio: Device sampling rate, which indicates the proportion of devices allowed to enable network monitoring.
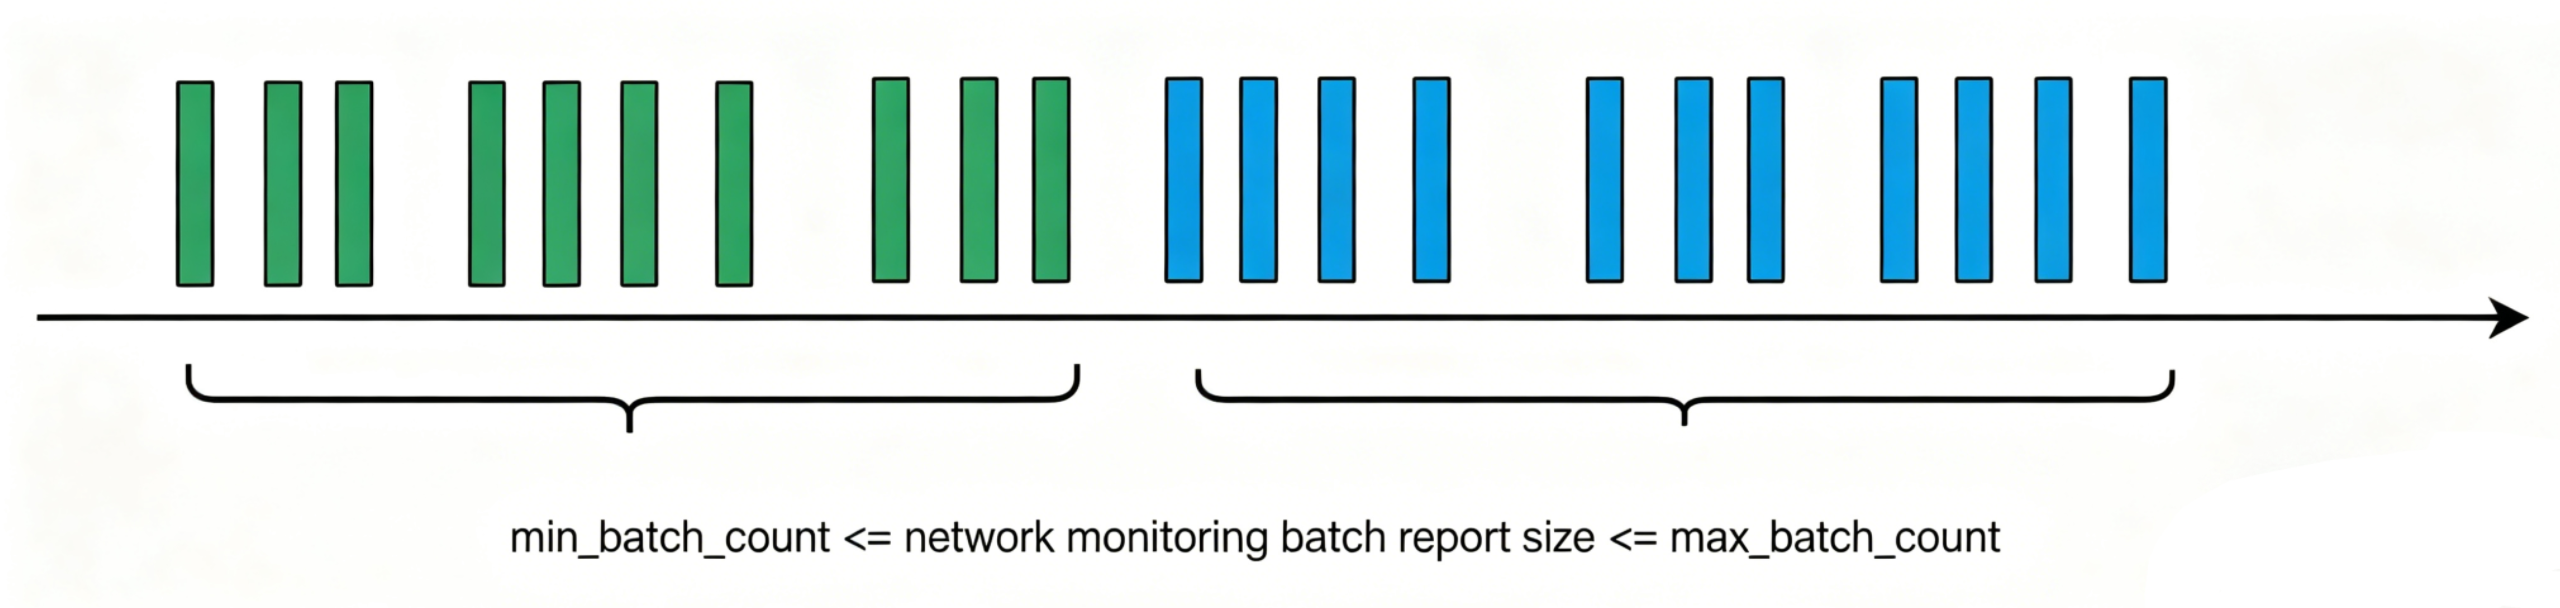
daily_report_limit: Indicates the maximum number of times data reporting for network monitoring is allowed per day. Data for network monitoring is reported in batches, and the specific batching is determined by max_batch_count and min_batch_count.
max_batch_count: Indicates the maximum number of HTTP request quality detailed data entries included in a single network monitoring data report. The default value is 100.
min_batch_count: Indicates the minimum number of detailed HTTP request quality data entries included in a single network monitoring report. The default value is 50.
Note:
During the testing phase, it is recommended to set sample_ratio to 1. After testing, you can change the device sampling rate based on actual needs.
During the testing phase, it is recommended to set min_batch_count to 5 or 10 for faster data reporting to the backend. After testing, you can change the value based on your business needs or restore it to the default value.
SDK Integration
Upgrade the SDK
implementation "com.tencent.Bugly:Bugly:4.4.2.5"
Using APIs
1. Proxies the system's native HttpURLConnection.
If you do not want to proxy HTTP requests using the system's native interface, you do not need to perform this step. If you want to proxy HTTP requests using the system's native interface, it is recommended to enable the proxy as early as possible in Application#onCreate.
// Enables the proxy.BuglyURLStreamHandlerFactory.init();
After enabling the proxy, you can also disable it using the following code.
// Disables the proxy.BuglyURLStreamHandlerFactory.reset();
2. Modify the OkHttpClient creation process.
Use BuglyListenerFactory to create an OkHttpClient.
OkHttpClient client = new OkHttpClient.Builder().eventListenerFactory(BuglyListenerFactory.getInstance()).build();
If executed asynchronously, wrap the Callback using BuglyCallbackProxy.
call.enqueue(new BuglyCallbackProxy(callback));
If your business logic has its own EventListener.Factory, the Factory can be added using the following code.
BuglyListenerFactory.getInstance().addFactory(myFactory)
If you do not need the Factory, you can remove it using the following code.
BuglyListenerFactory.getInstance().removeFactory(myFactory)
3. Refer to the demo code to construct test data.
Build an asynchronous request.
OkHttpClient client = new OkHttpClient.Builder().eventListenerFactory(BuglyListenerFactory.getInstance()).build();Request request = new Request.Builder().url(url).build();Call call = client.newCall(request);call.enqueue(new BuglyCallbackProxy(callback));
Build a synchronous request.
OkHttpClient client = new OkHttpClient.Builder().eventListenerFactory(BuglyListenerFactory.getInstance()).build();Request request = new Request.Builder().url(url).build();try (Response response = call.execute()) {if (response.isSuccessful()) {InputStream inputStream = response.body().byteStream();...}} catch (IOException exception) {//}
Enable checking
1. Check the configuration pull to verify that network monitoring is enabled.
Log Tag: RMonitor_config: dump for onConfigLoad.
If the monitoring item allows enabling, logs similar to net_quality:true will appear; if the monitoring item does not allow enabling, logs similar to net_quality:false will appear.
2024-08-07 13:08:37.143 4707-4777/com.tencent.demo.Buglyprodemo I/RMonitor_config: dump for onConfigLoad, {battery_metric:false, memory_quantile:true, io:false, list_metric:false, work_thread_lag:false, sub_memory_quantile:false, fd_leak:false, looper_metric:true, activity_leak:true, battery_element:false, battery:false, launch_metric:true, battery_ele_metric:false, looper_stack:true, java_memory_ceiling_hprof:false, native_memory:true, http:false, traffic_detail:false, net_quality:true, device:false, db:false, big_bitmap:true, traffic:false}
2. Check whether network monitoring is properly enabled.
2024-08-07 13:09:03.768 4939-4939/com.tencent.demo.Buglyprodemo I/RMonitor_net_quality: getFactory, ret: true, factory: null, errorMsg: null2024-08-07 13:09:03.786 4939-4939/com.tencent.demo.Buglyprodemo I/RMonitor_net_quality: setURLStreamHandlerFactory success.2024-08-07 13:09:03.786 4939-4939/com.tencent.demo.Buglyprodemo I/RMonitor_net_quality: init, true2024-08-07 13:09:03.807 4939-4997/com.tencent.demo.Buglyprodemo I/RMonitor_net_quality: start
3. Check data reporting.
2024-08-07 13:10:56.226 4939-5009/com.tencent.demo.Buglyprodemo D/RMonitor_report: reportInternal-onSuccess, pluginName: net_quality, dbId: 7
Network Exception
Result code: Generally used to indicate errors during the HTTP connection establishment phase.
On the Android platform, there are only two result codes: 0 and -1. 0 indicates the default value, while -1 indicates that an exception occurred during the connection establishment phase. The specific cause of the exception is described in the exception information.
HTTP status code: In the HTTP protocol, it is a three-digit code used to indicate the server's processing result of a request. Each status code has a specific meaning, used to indicate different situations such as request success, redirection, client error, or server error. The following are some common HTTP status codes and their meanings:
200 OK: The request is successful, and the server has successfully processed the request.
301 Moved Permanently: Permanent redirect. The requested resource has been permanently moved to a new URL.
400 Bad Request: Client error. The server cannot understand the syntax or parameters of the request.
404 Not Found: Resource not found. The server is unable to find the requested resource.
500 Internal Server Error: Server error. The server encountered an unexpected error while processing the request.
Exception information: Describes the specific cause of the exception, such as domain name resolution exception, Unable to resolve host "www.xxx.com": No address associated with hostname.
Exception type: Describes the classification of exceptions, which refers to categorizing exception information. For example, if the exception message is Unable to resolve host "www.xxx.com": No address associated with hostname, the extracted exception type would be Unable to resolve host.
iOS
Function Introduction
Network monitoring is used to monitor the network usage of an App. By monitoring the universal network request component NSURLSession, it tracks data such as HTTP request latency, success rate, data transfer volume, and time consumption during critical phases of the request process.
Open configuration
Similar to traffic monitoring, network monitoring will only take effect when the corresponding SDK configuration is enabled alongside the sub-module activation. For SDK configuration details, refer to SDK Configuration.
For the configuration details of network monitoring, which are consistent with the Android version, you may refer to Android Network Monitoring Configuration for details.
Unlike Android, the iOS side does not implement complex reporting frequency control (due to differences in implementation between the two platforms). Therefore, fields such as max_batch_count and min_batch_count do not need to be configured.
Note:
Although network monitoring and traffic monitoring belong to the same module, their feature configurations are independent and non-exclusive. Therefore, they can be enabled or disabled separately. Additionally, due to data volume considerations, it is not recommended to set the sampling rate of network monitoring too high.
SDK Integration
Network monitoring is a sub-module of the SDK (sharing the network monitoring module with traffic monitoring). It does not require separate integration by the business; simply upgrading to a supported SDK version will include the corresponding module. Therefore, when initializing the SDK, ensure that the enabled modules include Bugly_MODULE_NETWORK or use the RM_MODULE_ALL type. For details, refer to iOS SDK Integration Guide.
Note:
Unlike traffic monitoring, Network Quality Monitoring requires an understanding of network protocols. Therefore, the SDK currently only supports HTTP requests made using NSURLSession. Requests initiated via NSURLConnection, CFNetwork, or other Socket-based connections will not be covered by network monitoring.
Network monitoring requires version 2.8.1.5 or later.
Data analysis
The following content uses the Android platform's network monitoring module as an example for explanation. For iOS, refer to the content below.
Query
The feature supports users in querying network issues via multiple filter options. For details, see Query.
HTTP
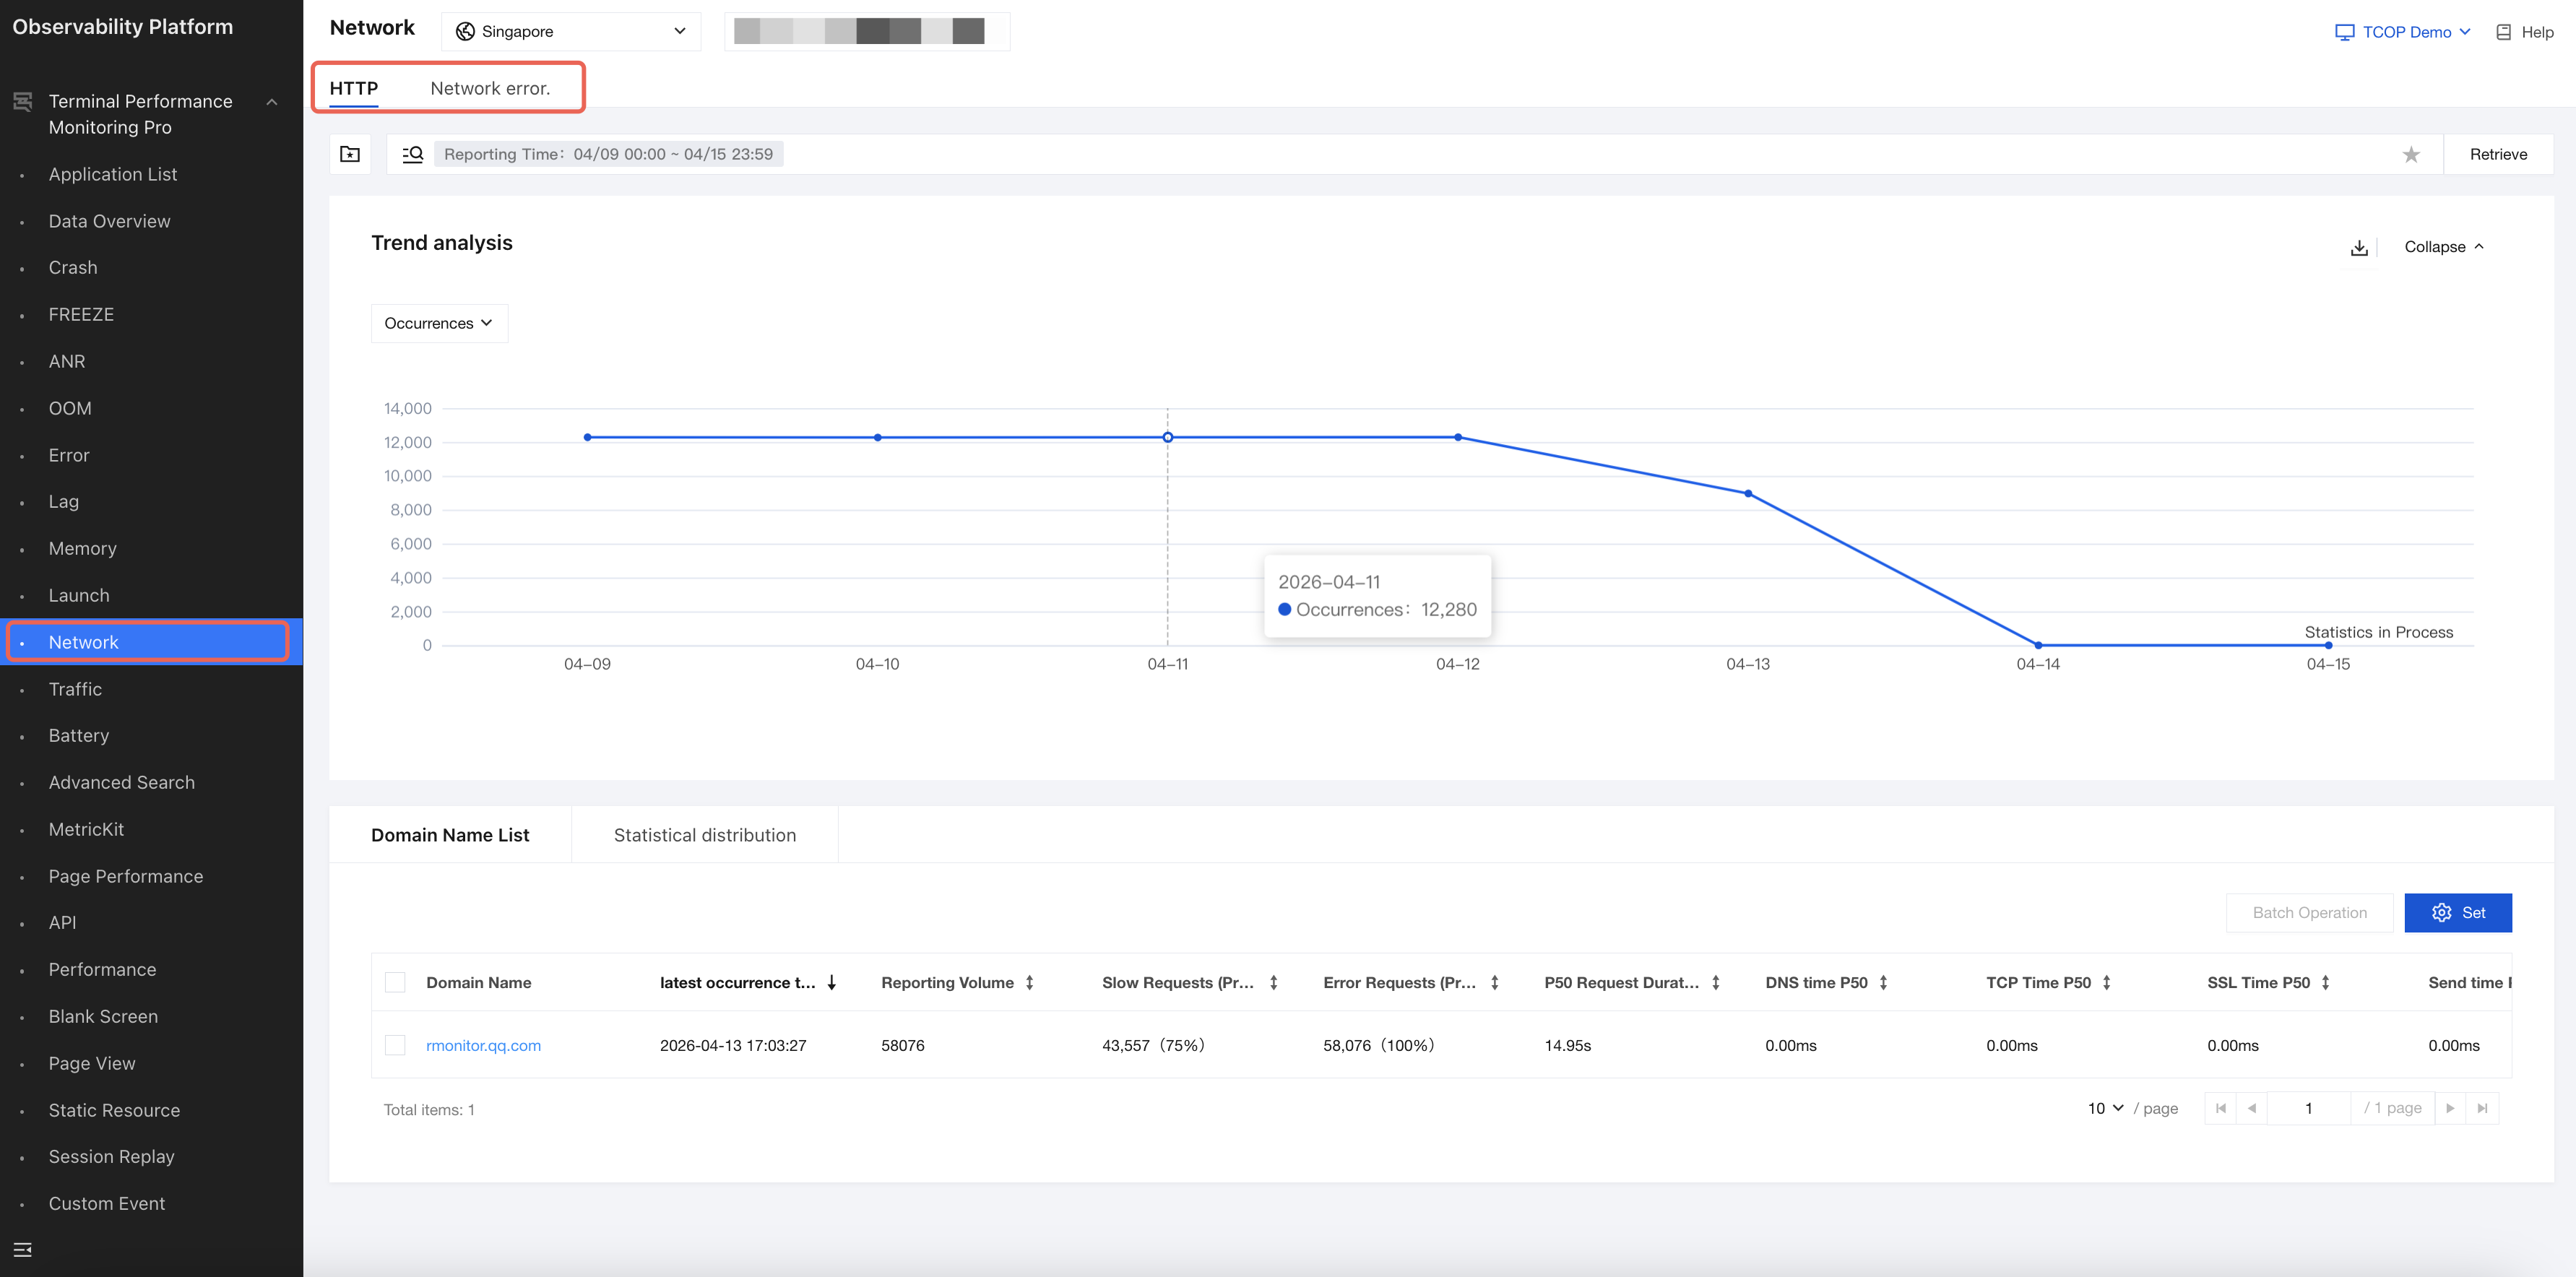
HTTP module contains performance data of all monitored HTTP requests, such as success rate, request duration, time consumption at key stages, and data transfer size.
HTTP module: Displays data from the last 7 days by default, including Top domains and APIs sorted by reporting volume, overall trends, statistical distribution data, and URL-aggregated lists.
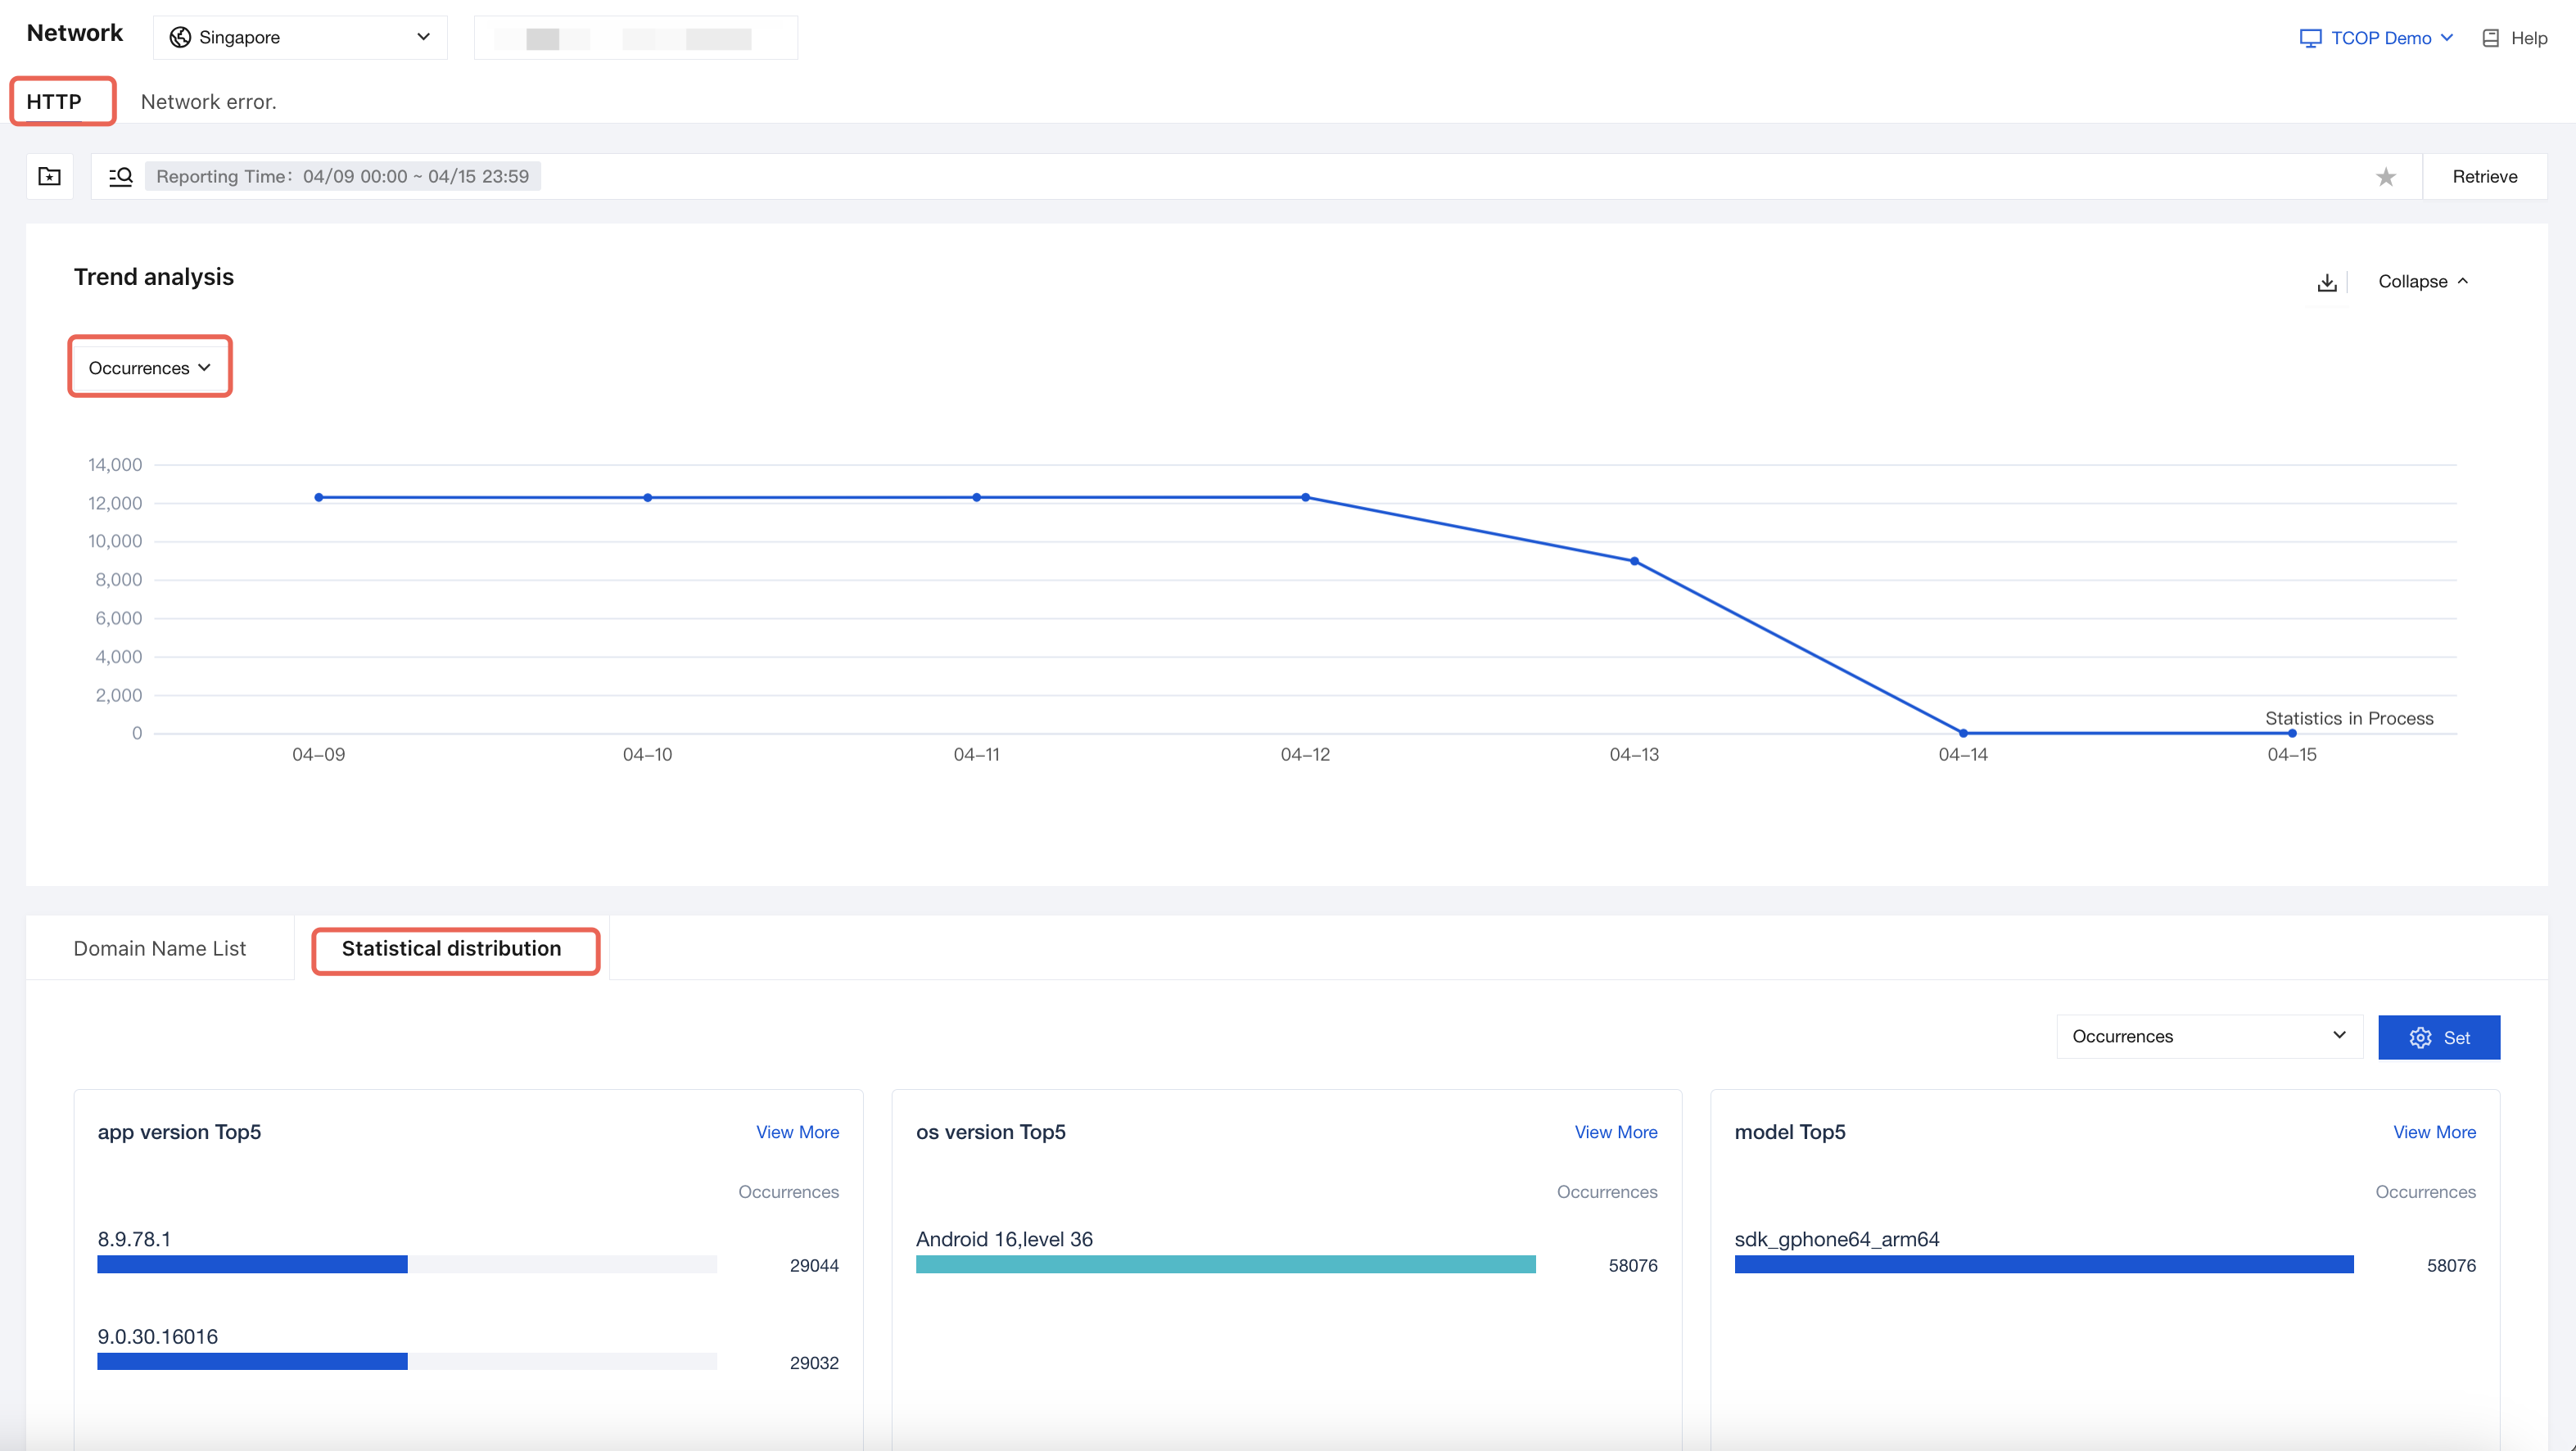
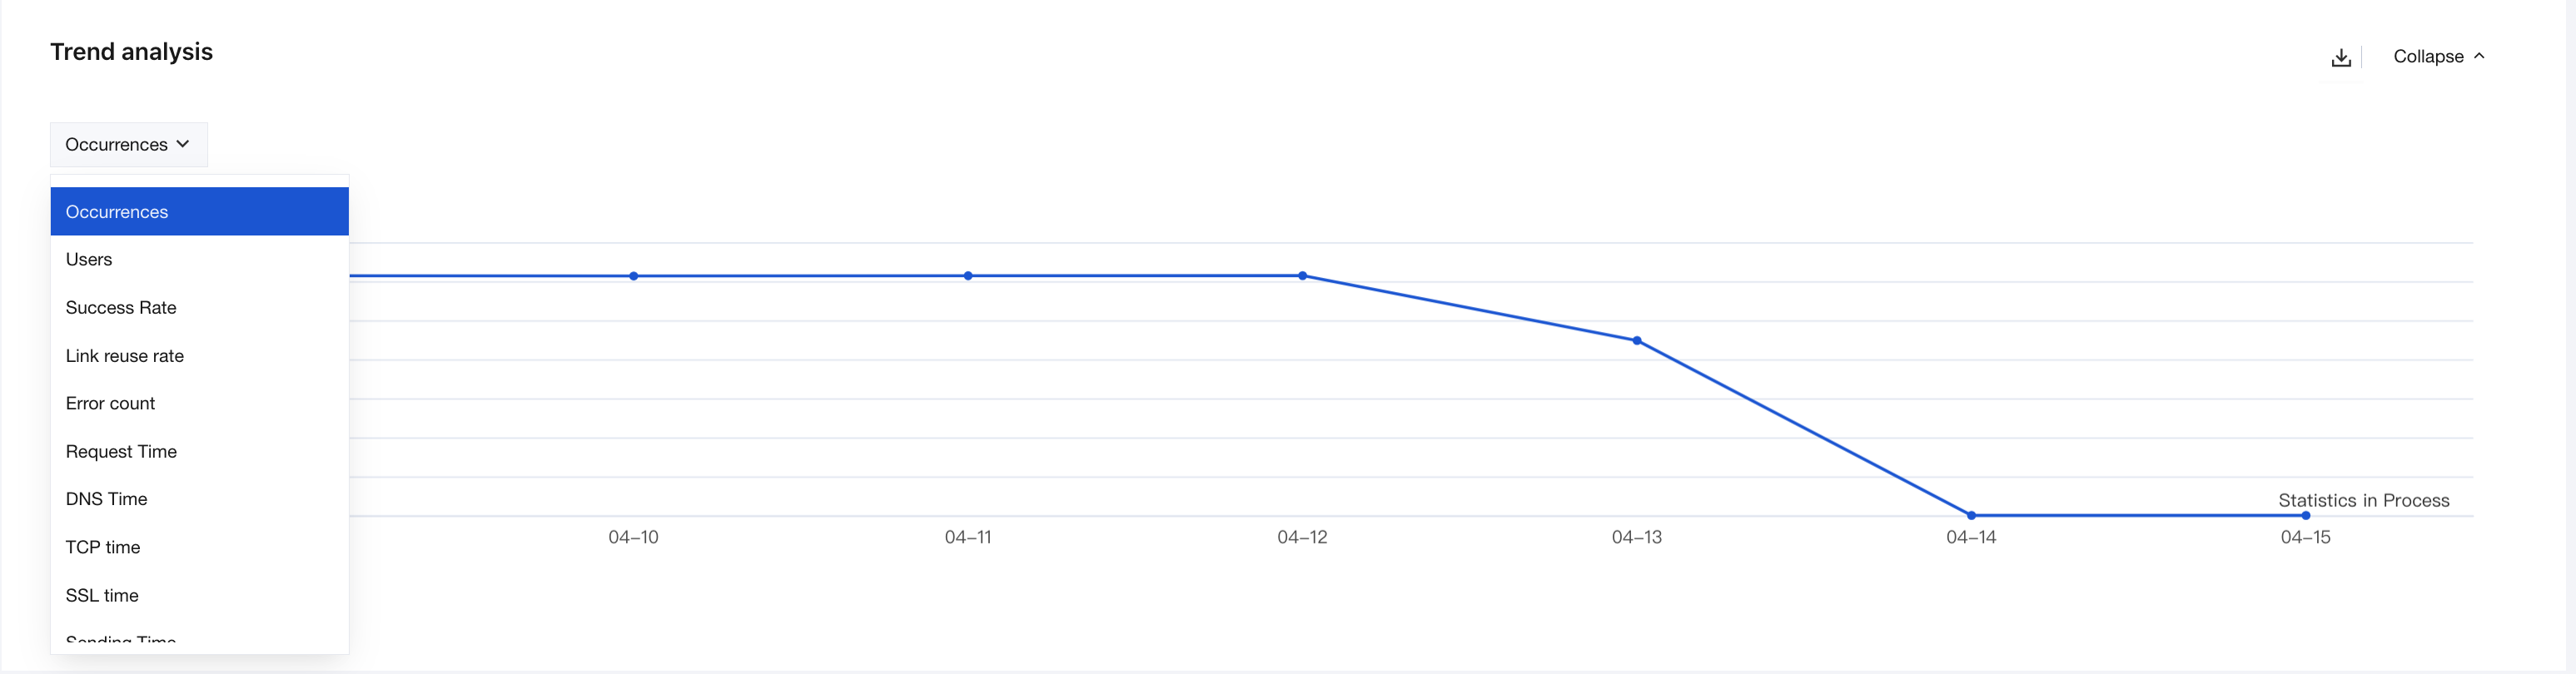
Trend analysis supports multiple metrics such as Occurrences, Users, Success Rate, and Link reuse rate. Users can select relevant metrics to view analytical charts based on their needs.
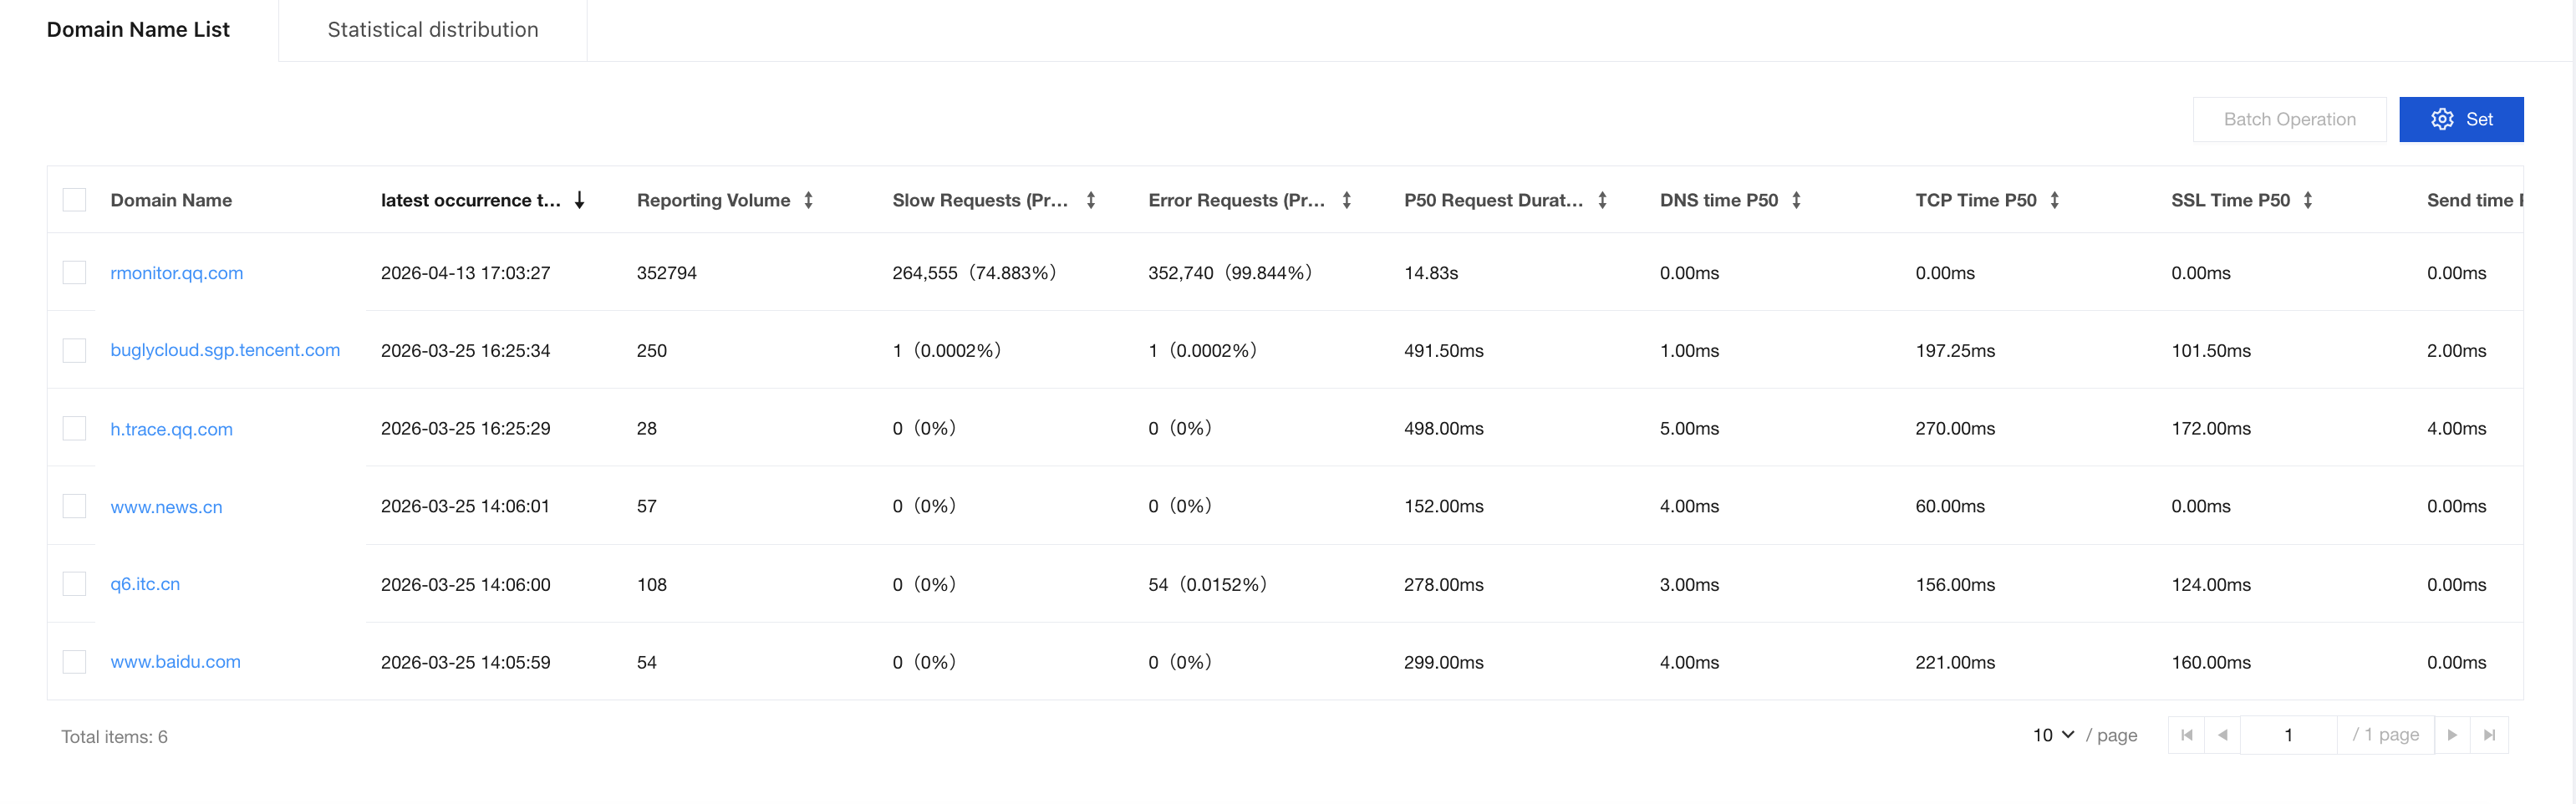
Domain Name List: Currently aggregated by domain and API.
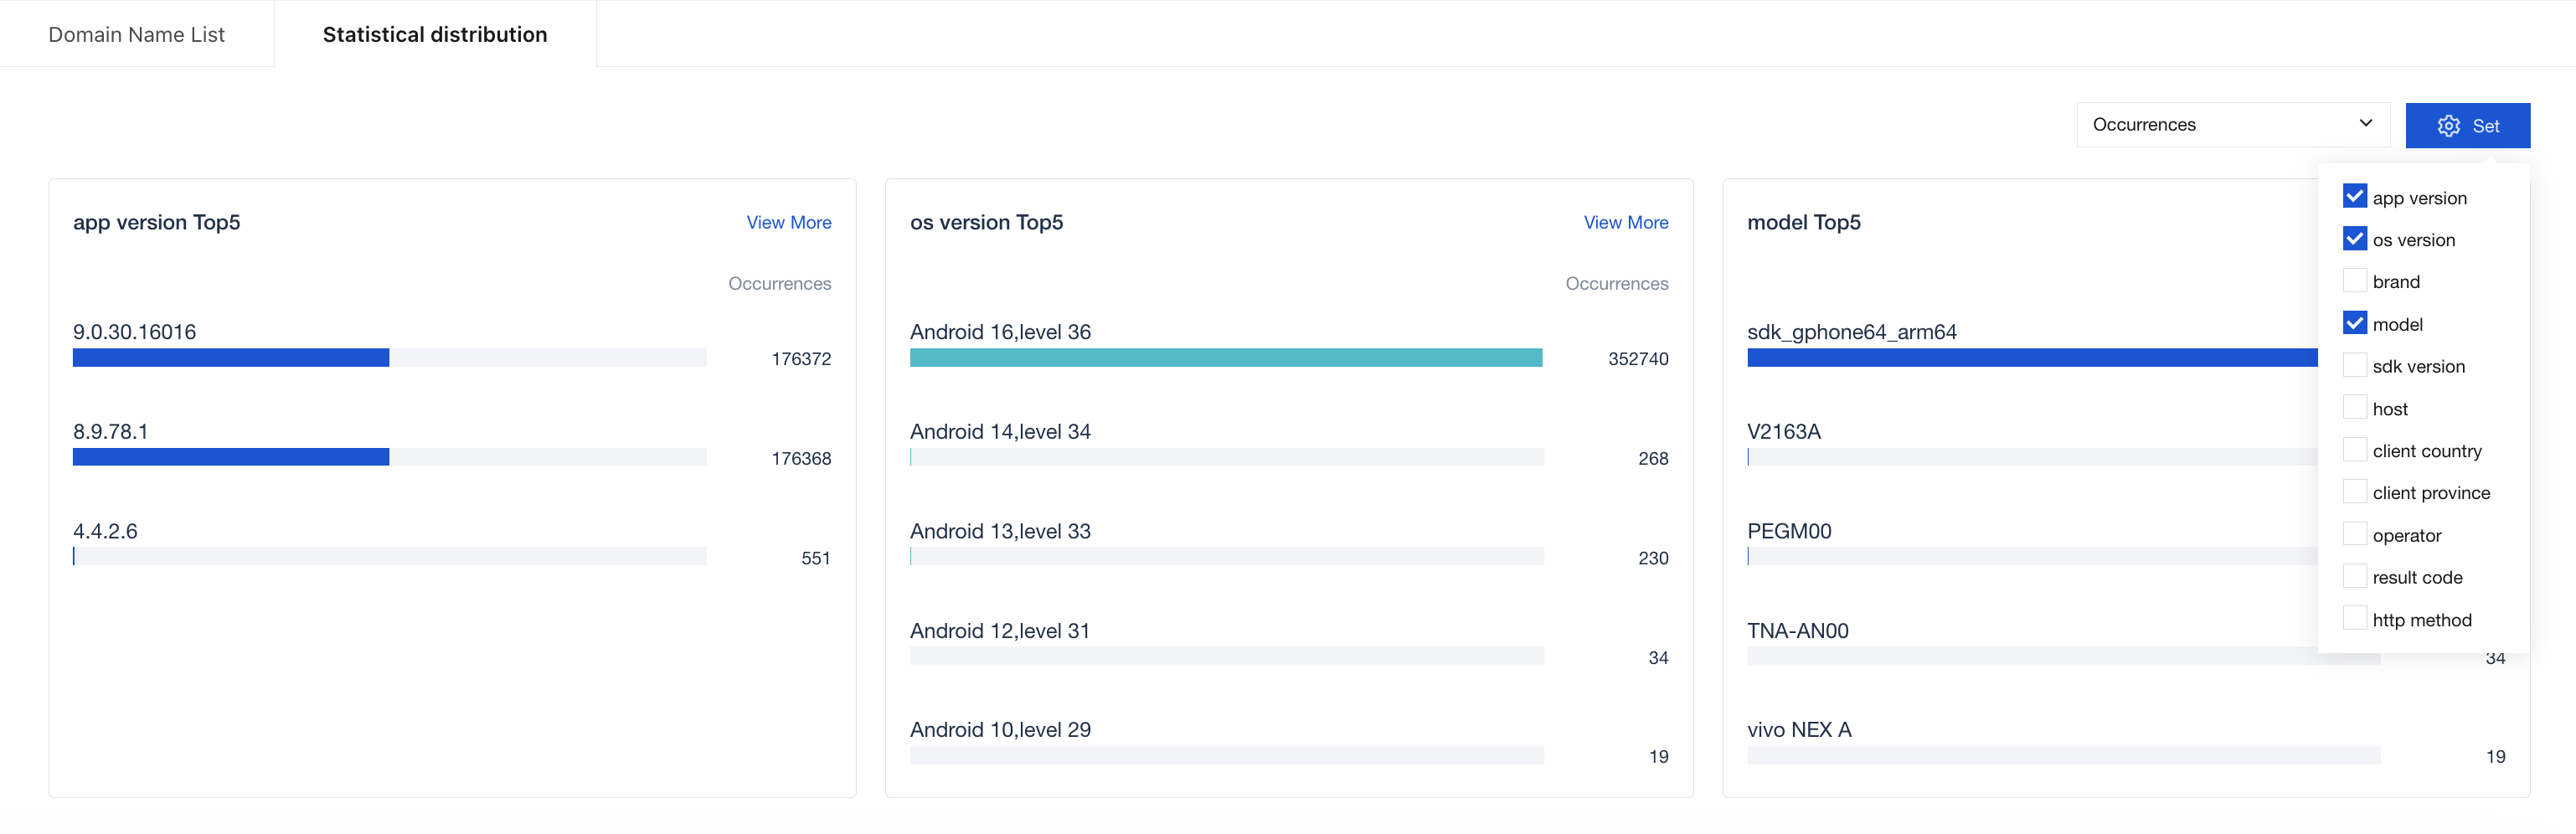
Statistical distribution supports multiple metrics such as Occurrences, Users, Success Rate, and Link reuse rate. Users can select relevant metrics to view distribution charts based on their needs.
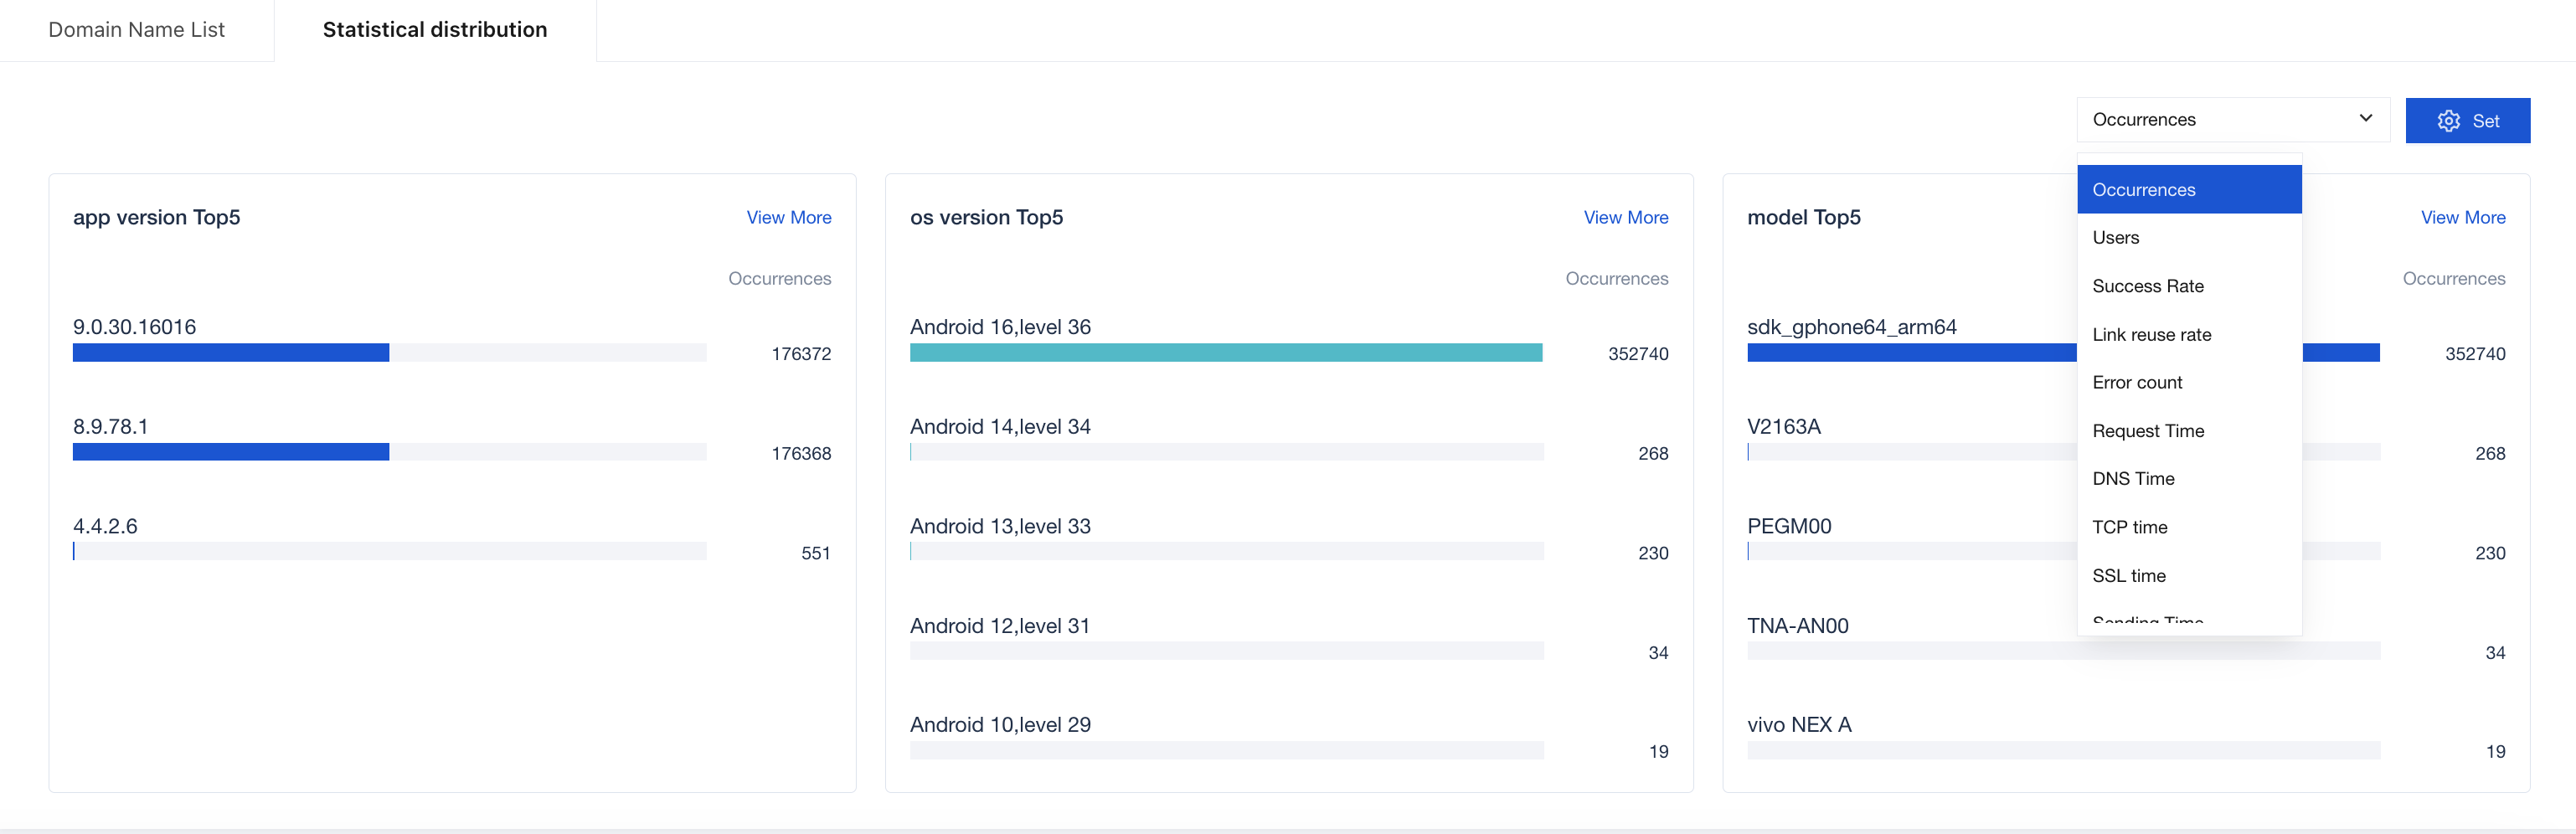
Click Set to select multiple drill-down metrics for display.
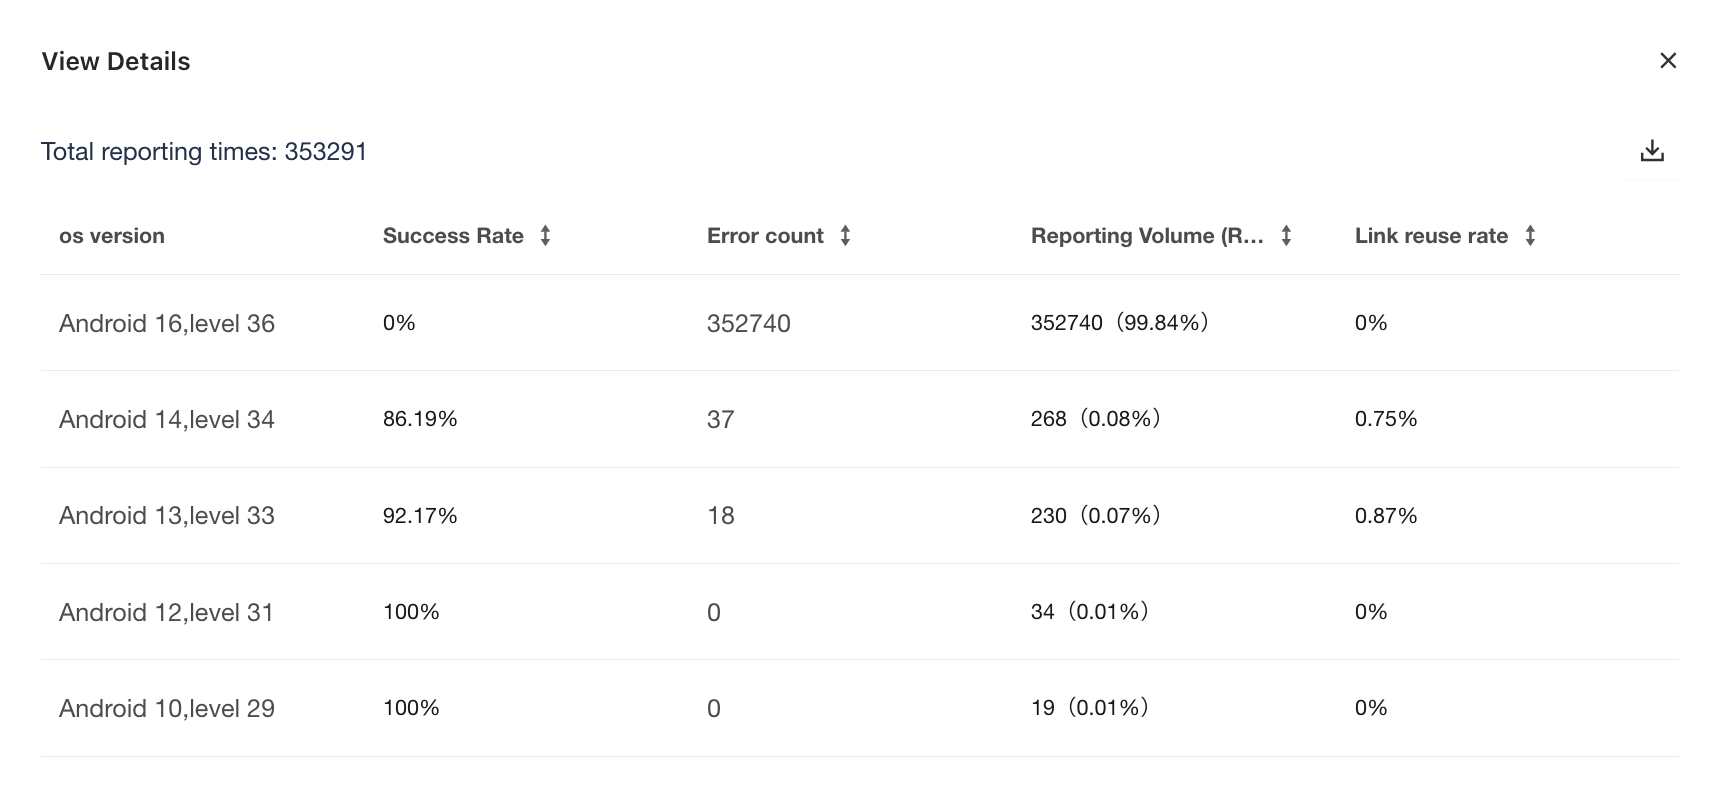
Click View More to view the reporting details of the current drill-down metrics.
In addition to the overall trend, we may focus on data from specific domains and APIs. This can be achieved using multi-dimensional drill-down. Click the domain or API you wish to analyze to view the data of the specified domain/API on the right side.
Network error
Network errors include data on all HTTP request errors, and the success rate of HTTP requests is measured by the error rate metric.
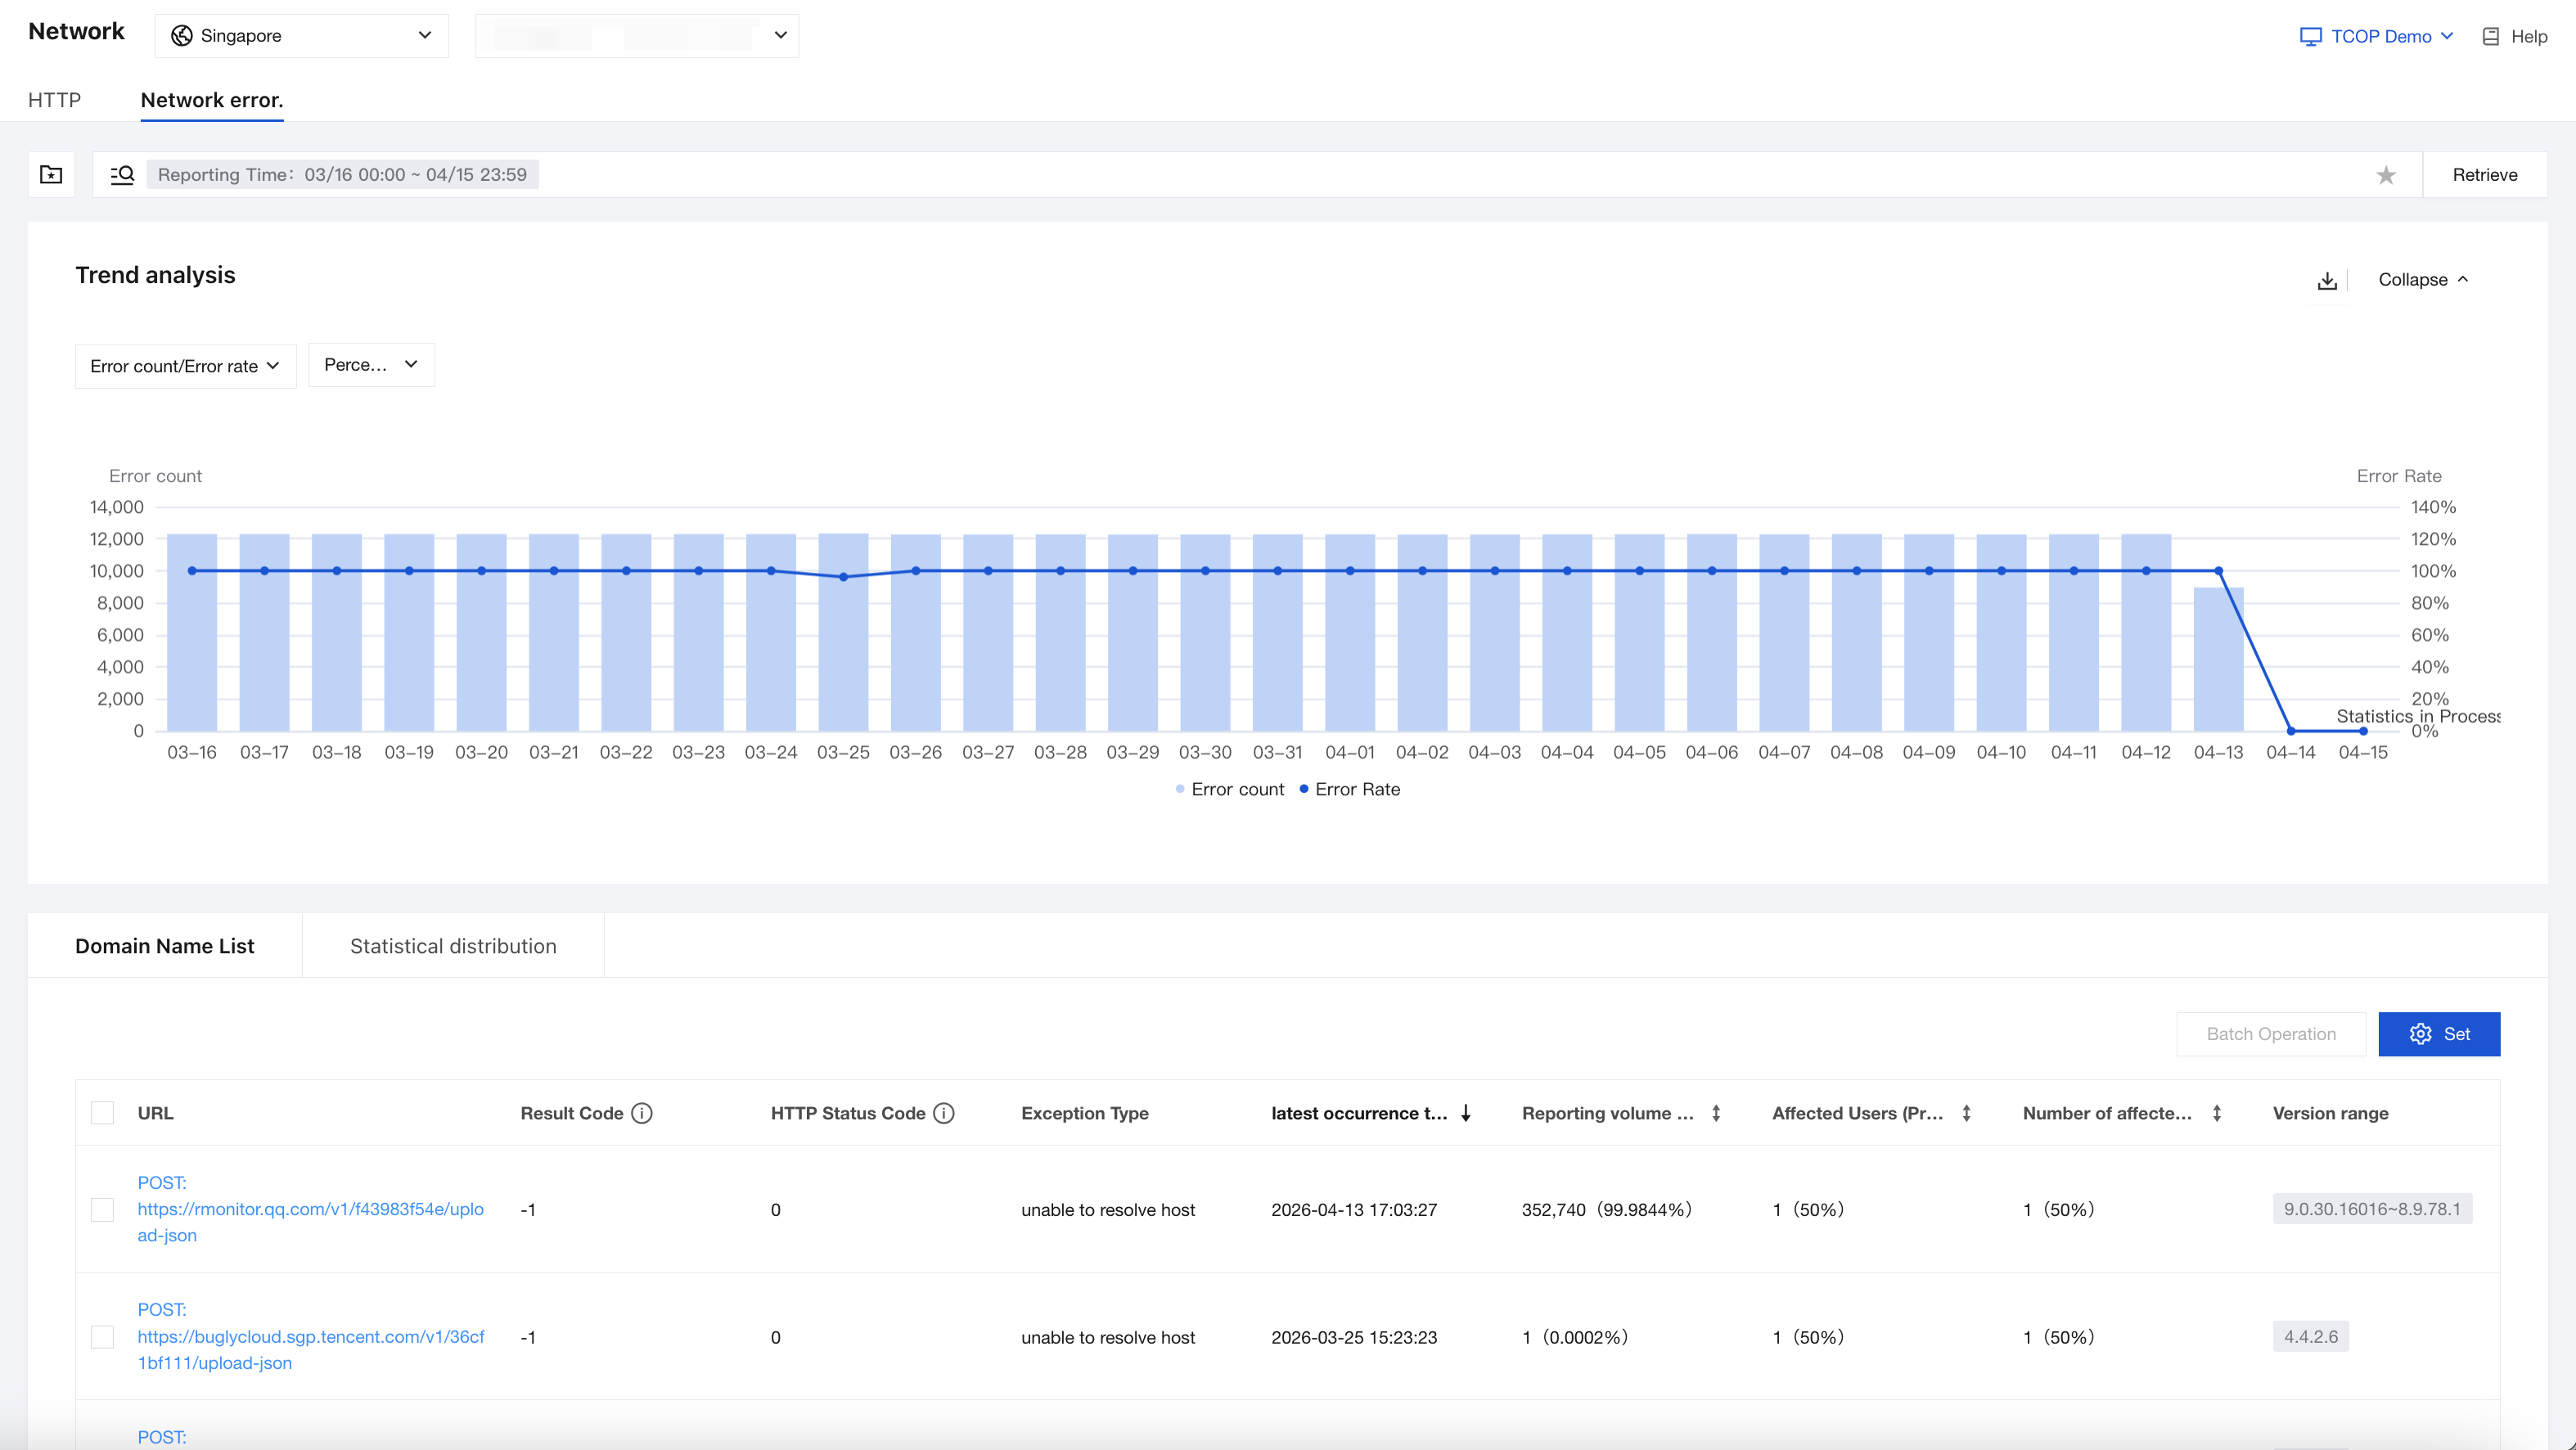
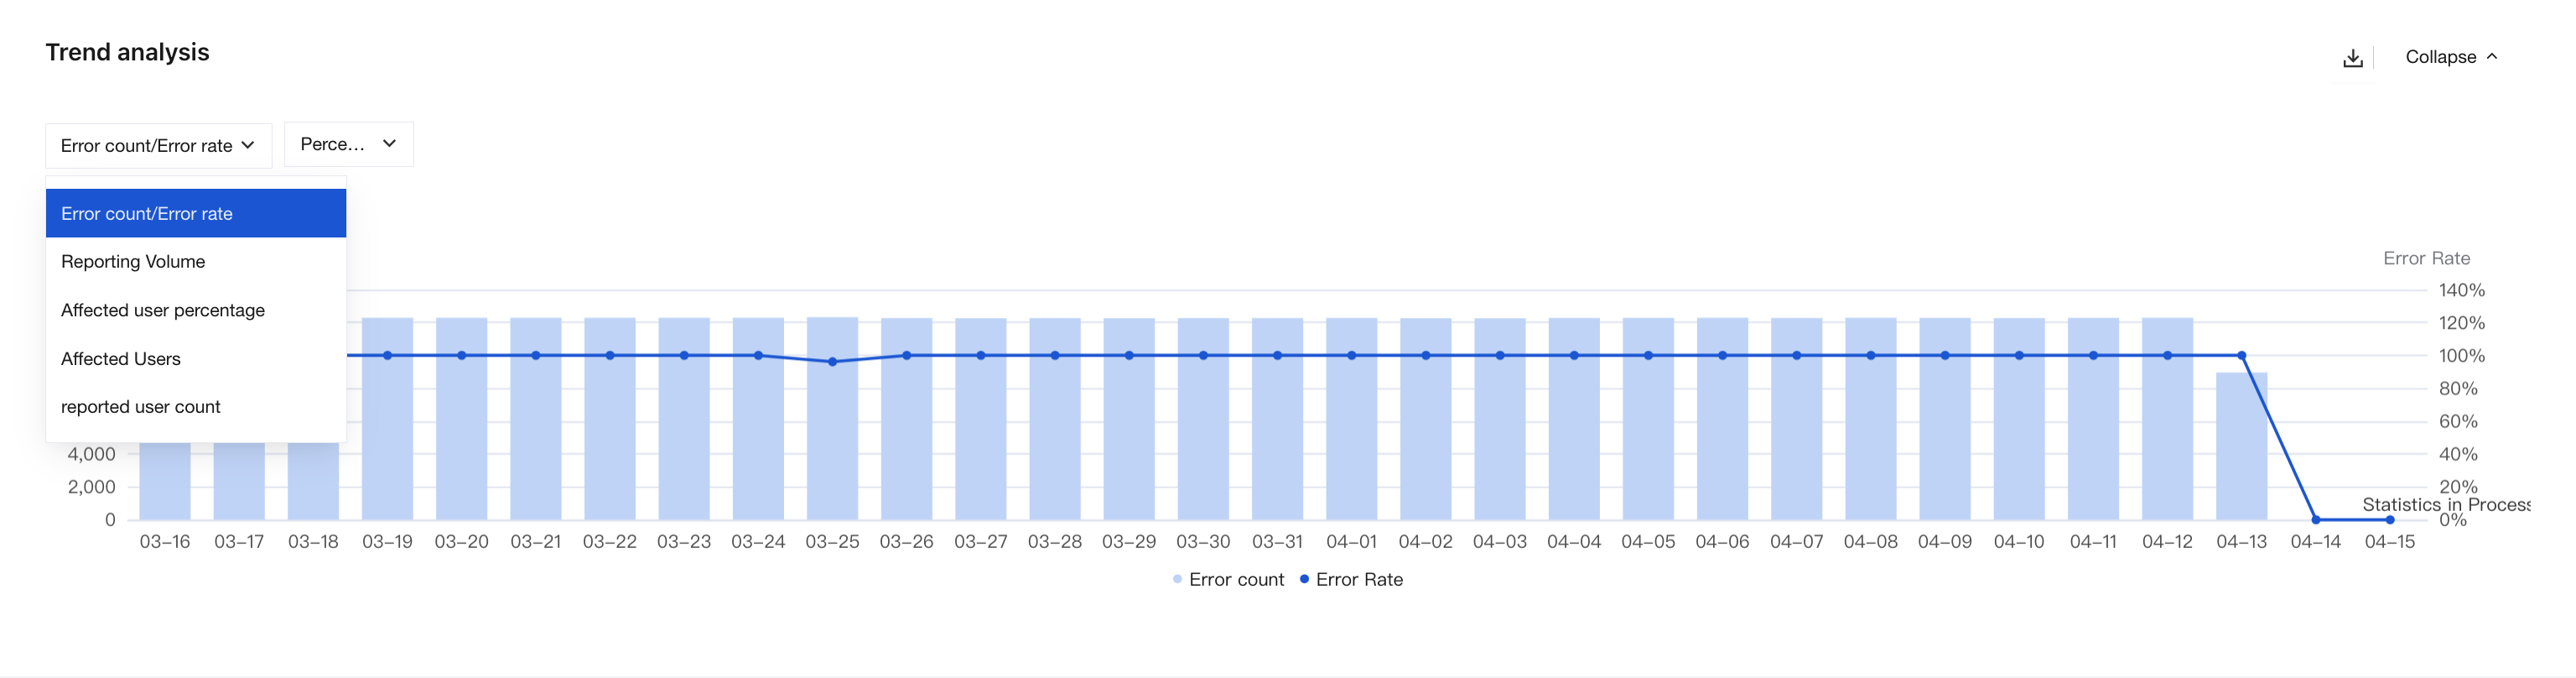
Trend analysis supports multiple metrics such as Error count/Error rate, Reporting Volume, Affected user percentage, Affected Users, and reported user count. Users can choose to display these metrics on demand.
Domain list: The domain list is currently clustered by
HTTP method + domain + API + error code. The list supports displaying multiple dimensions such as URL, Result Code, HTTP Status Code. You can click Set to configure the fields.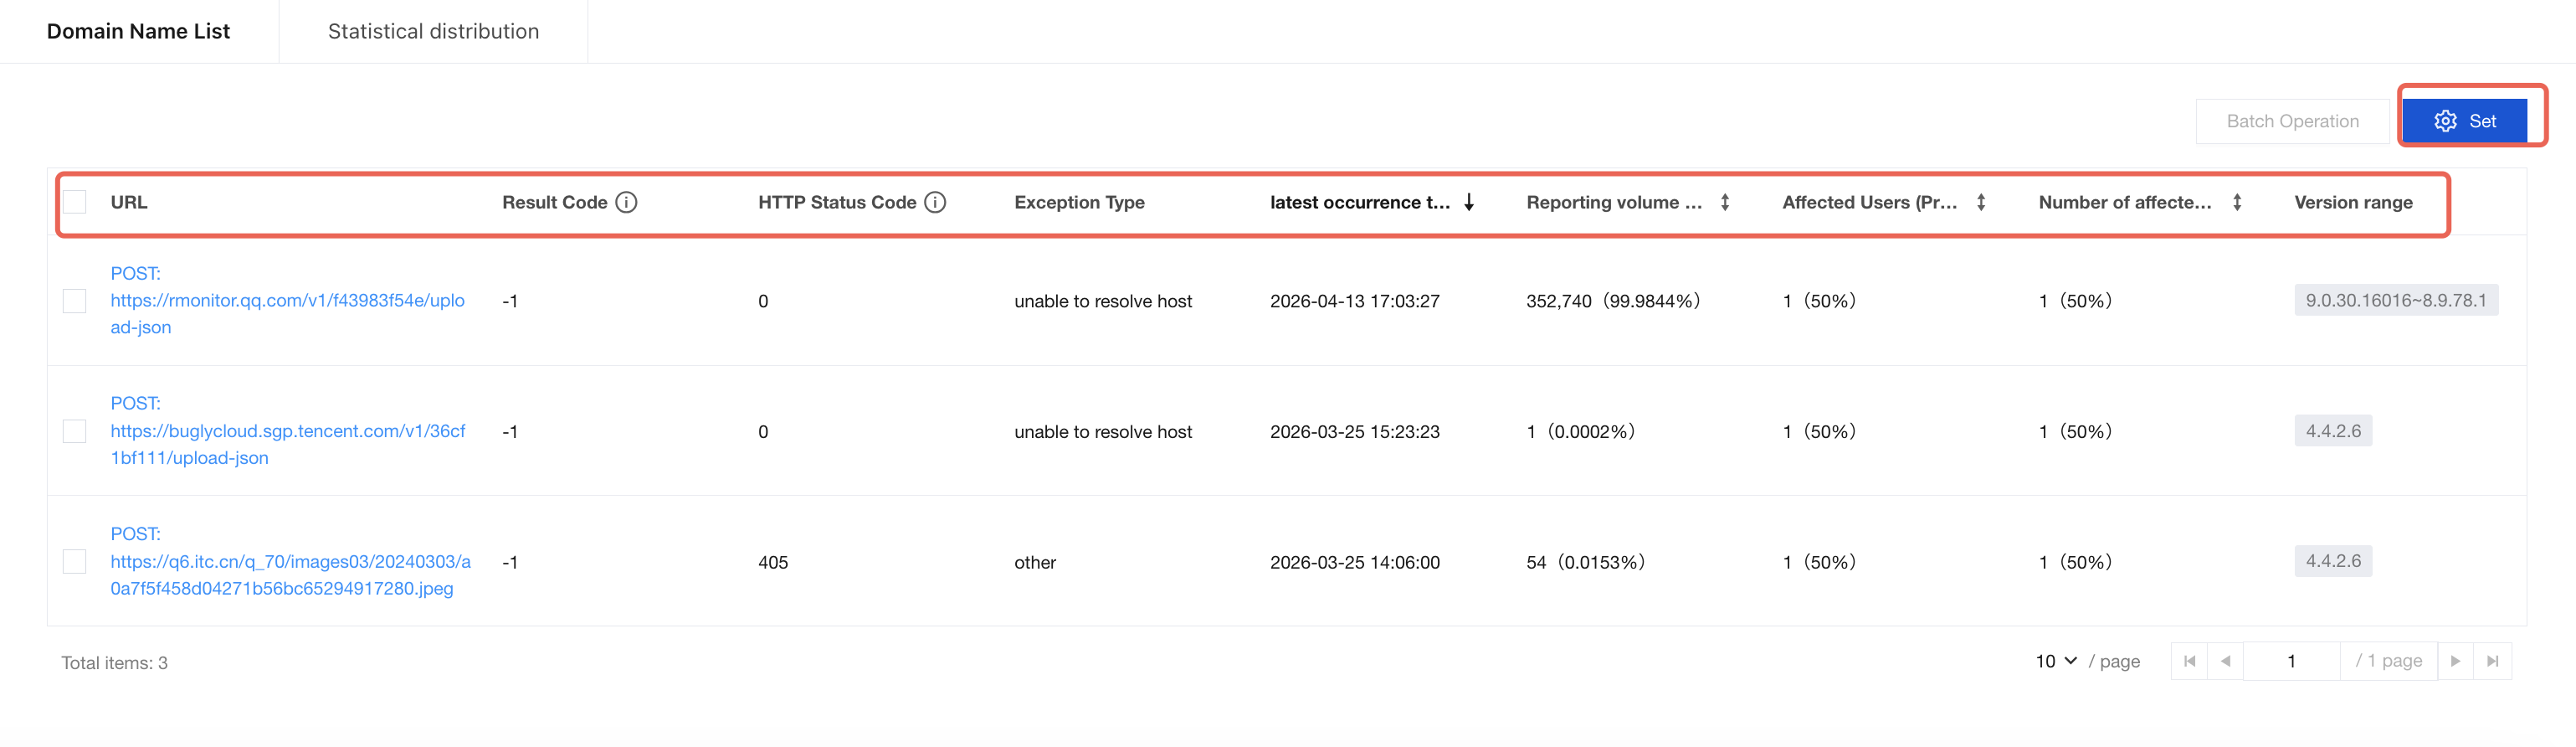
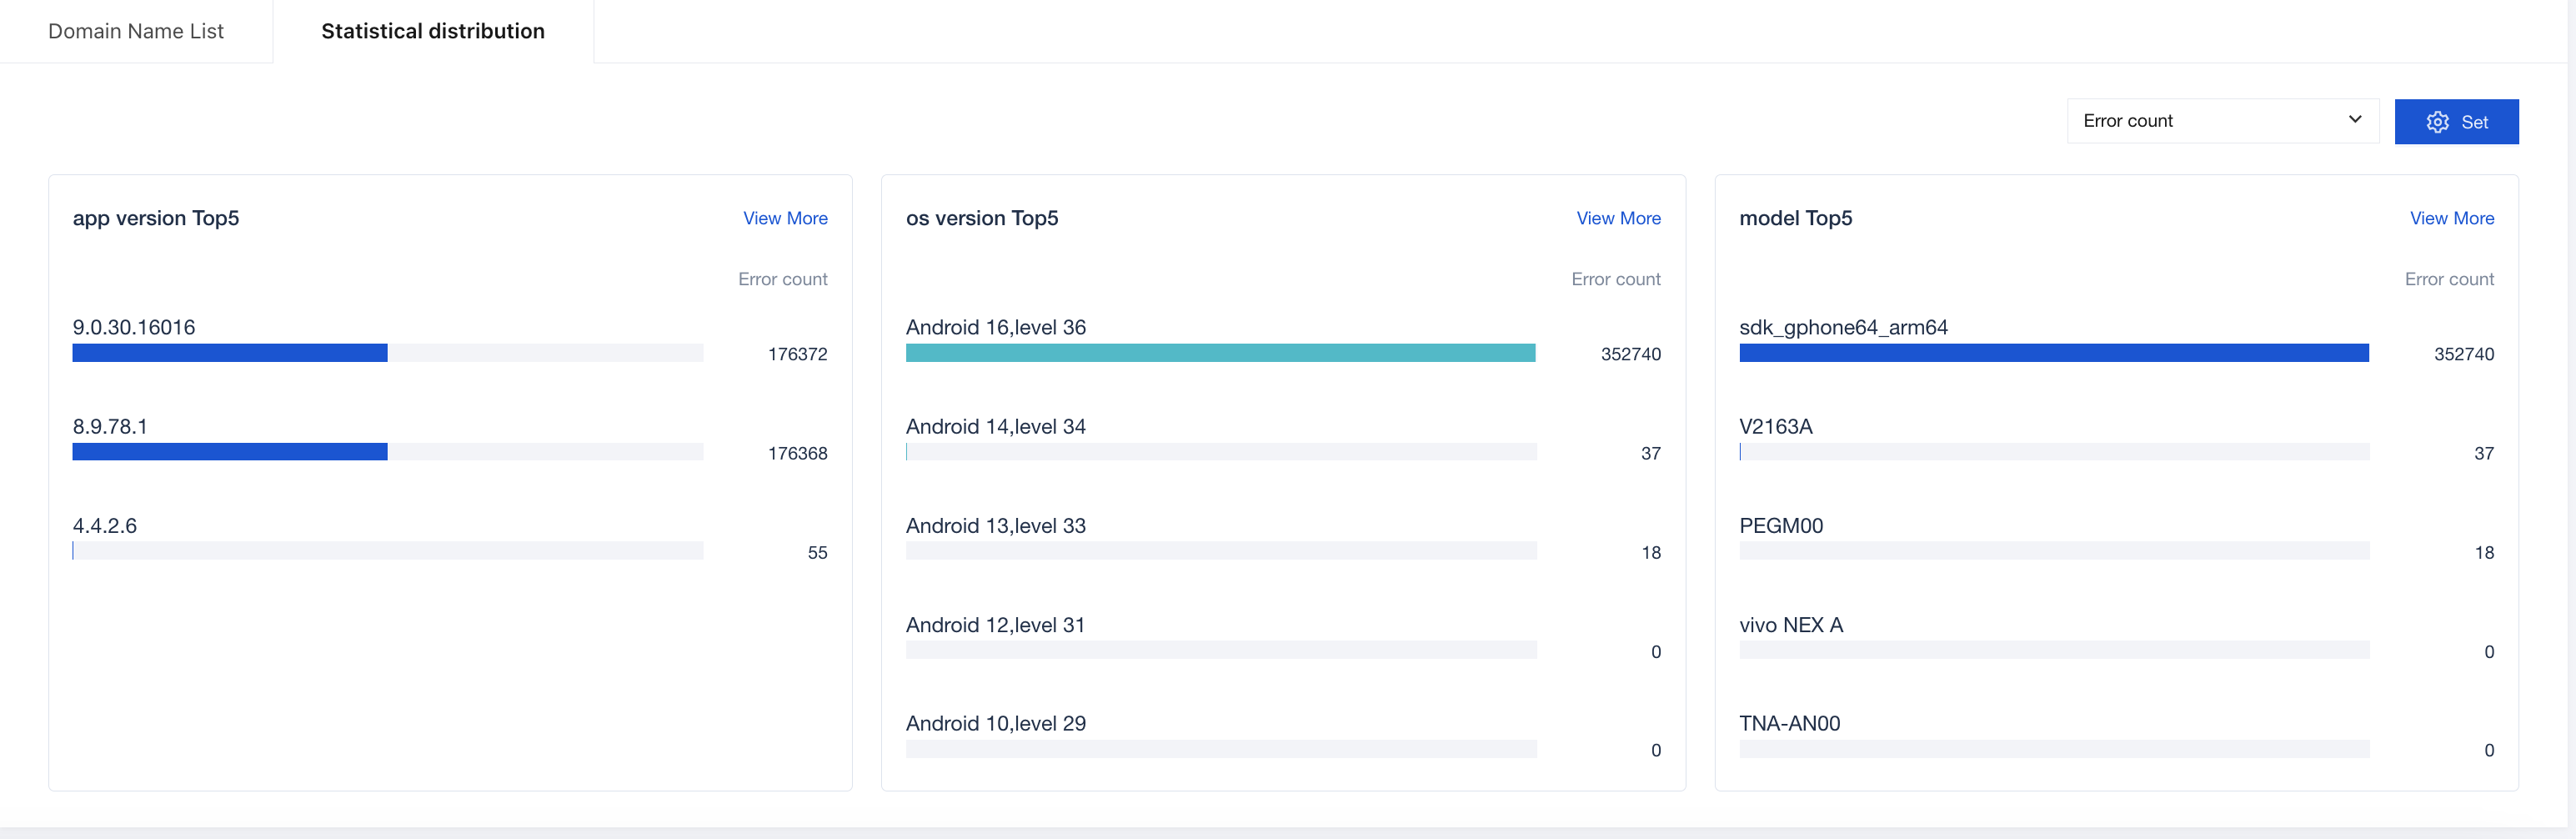
Statistical distribution: Similar to HTTP, network errors also provide rich drill-down fields, enabling users to analyze the reporting proportion across multiple dimensions.
Help and Support
Was this page helpful?
You can also Contact sales or Submit a Ticket for help.
Help us improve! Rate your documentation experience in 5 mins.
Feedback