Situations in the cluster emerge one after another and are unpredictable, such as abnormal node status and pod restarts. If these situations cannot be perceived in the first place, users will miss the best time to deal with them. It's often too late to find out when the problem worsens and affects businesses.
Event logs record comprehensive information about cluster status changes, helping users find and troubleshoot problems in the first place.
When a Pod is frequently restarted, users can track its status changes through event logs to quickly identify the cause of the issue.
If a node becomes abnormal, detailed contextual information will be provided in the event logs to help users determine whether to restart or replace the node.
Users can configure alarm rules to promptly obtain notifications of abnormal events, ensuring cluster stability and business continuity.
Through this practice, you will gain a detailed understanding of the following content:
You can also quickly experience the powerful integration of CLS and TKE through the following Demo:
Event Overview: You can filter events by dimensions such as time, namespace, level, reason, resource type, and resource object to view aggregated statistics of core events.
Aggregated Search for Abnormal Events: View the distribution trends of reasons and objects for various abnormal events within a specified time period.
Feature Strengths
CLS provides an out-of-the-box event analysis dashboard for the TKE event log analysis scenario. The dashboard includes analysis boards such as Abnormal Event Level Distribution, Abnormal Event Reason Distribution, and Abnormal Resource Object Distribution.
Collecting TKE Event Logs
Step 1: Go to the TKE Cloud Insight
1. Log in to the CLS console, select Cloud Insight in the left sidebar, and go to the Cloud Insight page.
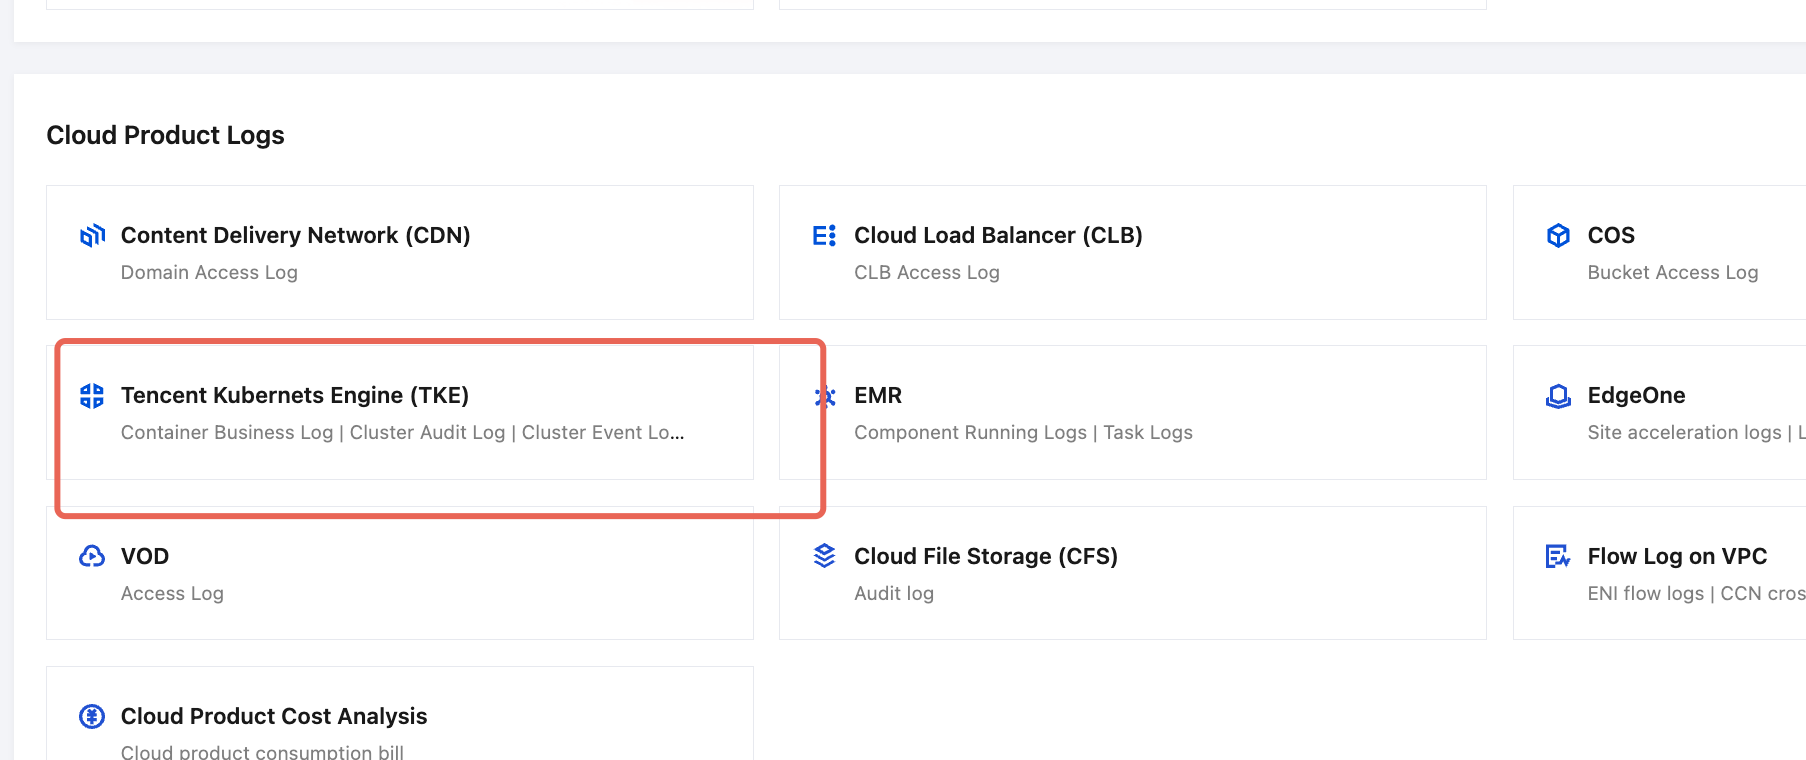
2. In Cloud Product Logs, locate Tencent Kubernets Engine(TKE) and click to go to the Tencent Kubernets Engine(TKE) Cloud Insight page.
Step 2: Enable TKE Cluster Event Log Collection
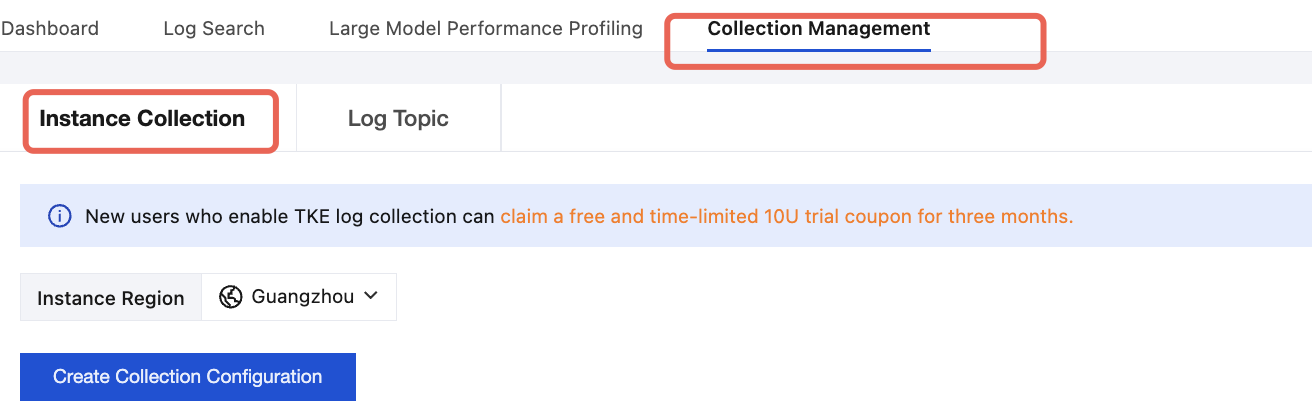
1. Choose the Collection Management > Instance Collection page.
2. In the TKE Cloud Insight, locate the target cluster in the cluster list. If the status of the collection component is Not Installed, click Install to install the log collection component.
Note:
Installing the log collection component deploys a tke-log-agent pod and a cls-provisioner pod as a DaemonSet in the cluster's kube-system namespace. Reserve at least 0.1 cores and 16 MiB of available resources for each node.
3. If the status of the collection component is Latest, click the cluster name to go to the cluster details page, and then locate Cluster Event Logs under Log Management on the cluster details page.
4. Click to enable Cluster Event Logs and go to the Cluster Event Logs Configuration Process.
5. Go to the event log configuration process. In the Log Topic Configuration step, you can select an existing log topic or create a new one for storing logs. For information about log topics, see Log Topic.
6. After completing the log topic configuration, click Next to go to Index Configuration. For information about indexes, see Index.
The configuration information in index configuration is as follows:
Index Status: Confirm whether to enable indexing to use analysis features such as log search.
Full-Text Index: Confirm whether to enable case sensitivity. Full-Text Delimiters: The default value is "@&()='\\",;:<>[]{}/ \\n\\t\\r". Confirm whether to modify it.
Allow Chinese Characters: Select whether to enable this feature.
Key-Value Indexing: You can configure the field type, delimiters, and whether to enable statistical analysis as needed based on the key name. If you need to enable key-value indexing, you can turn on the switch.
Note:
Index configuration must be enabled before you can perform searches.
If you need to retrieve logs based on log fields, you need to configure key-value indexes.
If you need to perform statistical analysis based on log fields, you need to configure key-value indexes and enable statistics.
Index rule changes apply only to newly written logs. Existing data is not updated.
Event Overview: You can filter events by dimensions such as time, namespace, level, reason, resource type, and resource object to view aggregated statistics of core events.
Aggregated Search for Abnormal Events: View the distribution trends of reasons and objects for various abnormal events within a specified time period.
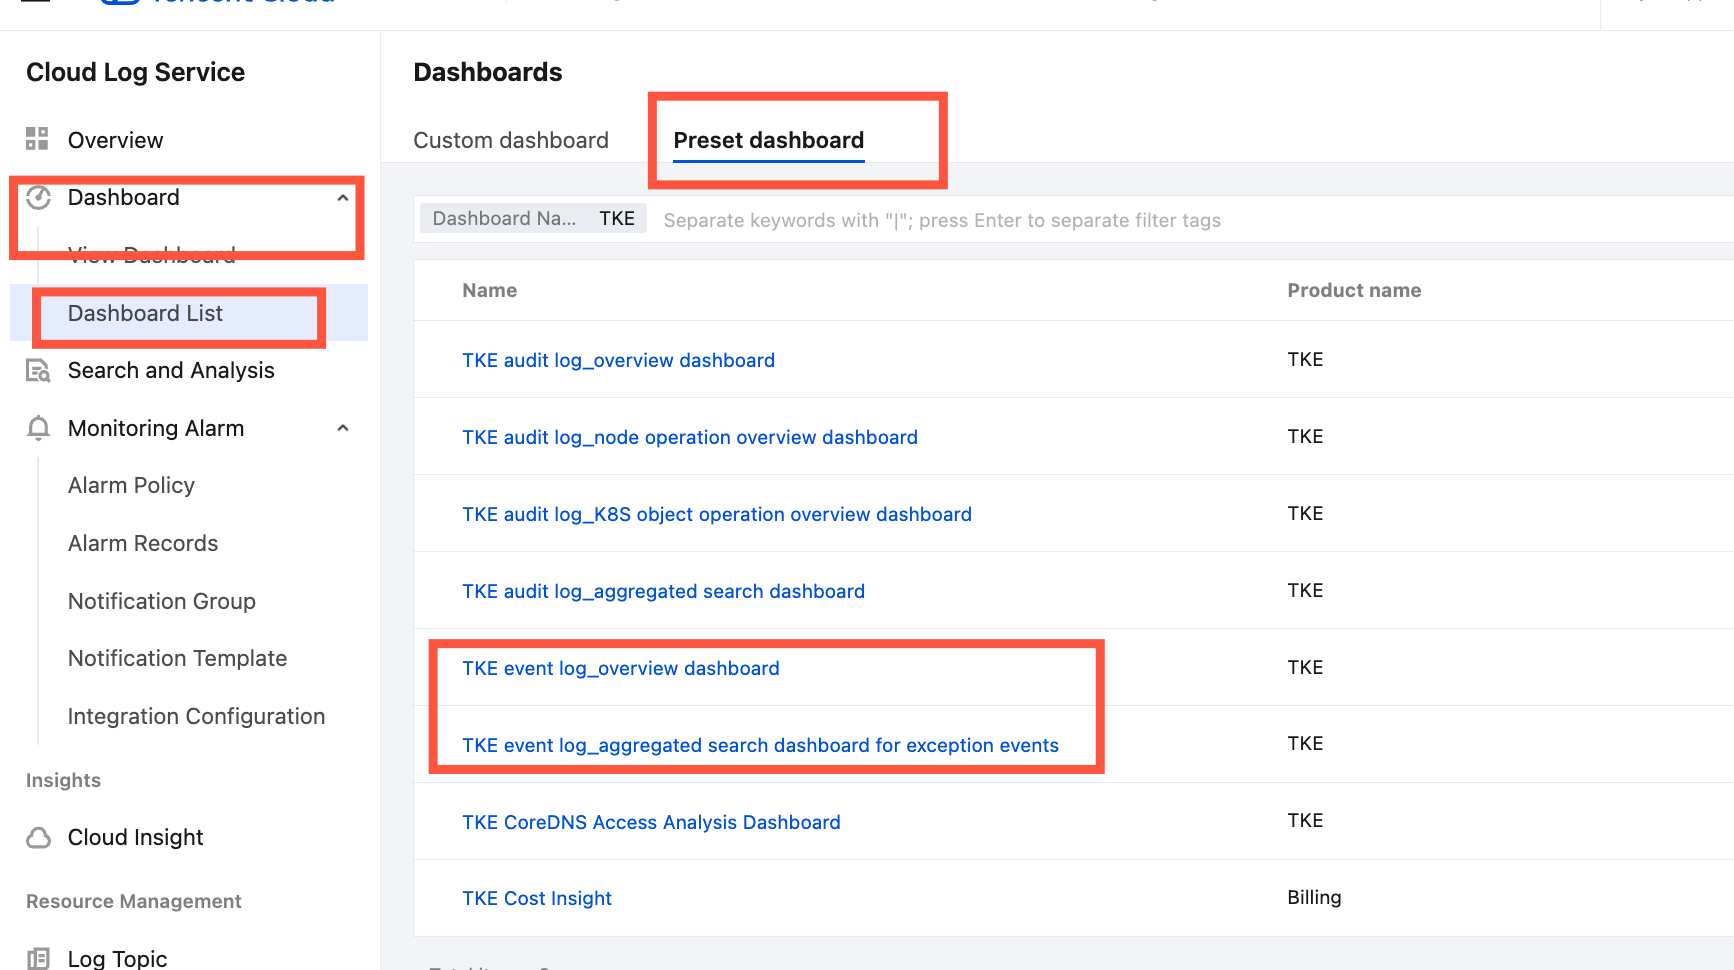
You can view the above TKE event pre-configured dashboards by performing the following operations:
2. In the left sidebar, choose Dashboard > Dashboard List > Preset dashboard and search for "TKE".
Searching and Analyzing Cluster Event Logs
1. After you complete enabling TKE event log collection, locate the cluster for which cluster event logging is enabled in the cluster list, and click the cluster name to go to the cluster details page.
2. On the cluster details page, select Log Management and locate the Cluster Event Logs module.
3. Click Event Logs to go to the log search page, where you can search and analyze the target cluster's event logs. For log field descriptions, see Log Field Descriptions.
Event Log Fields
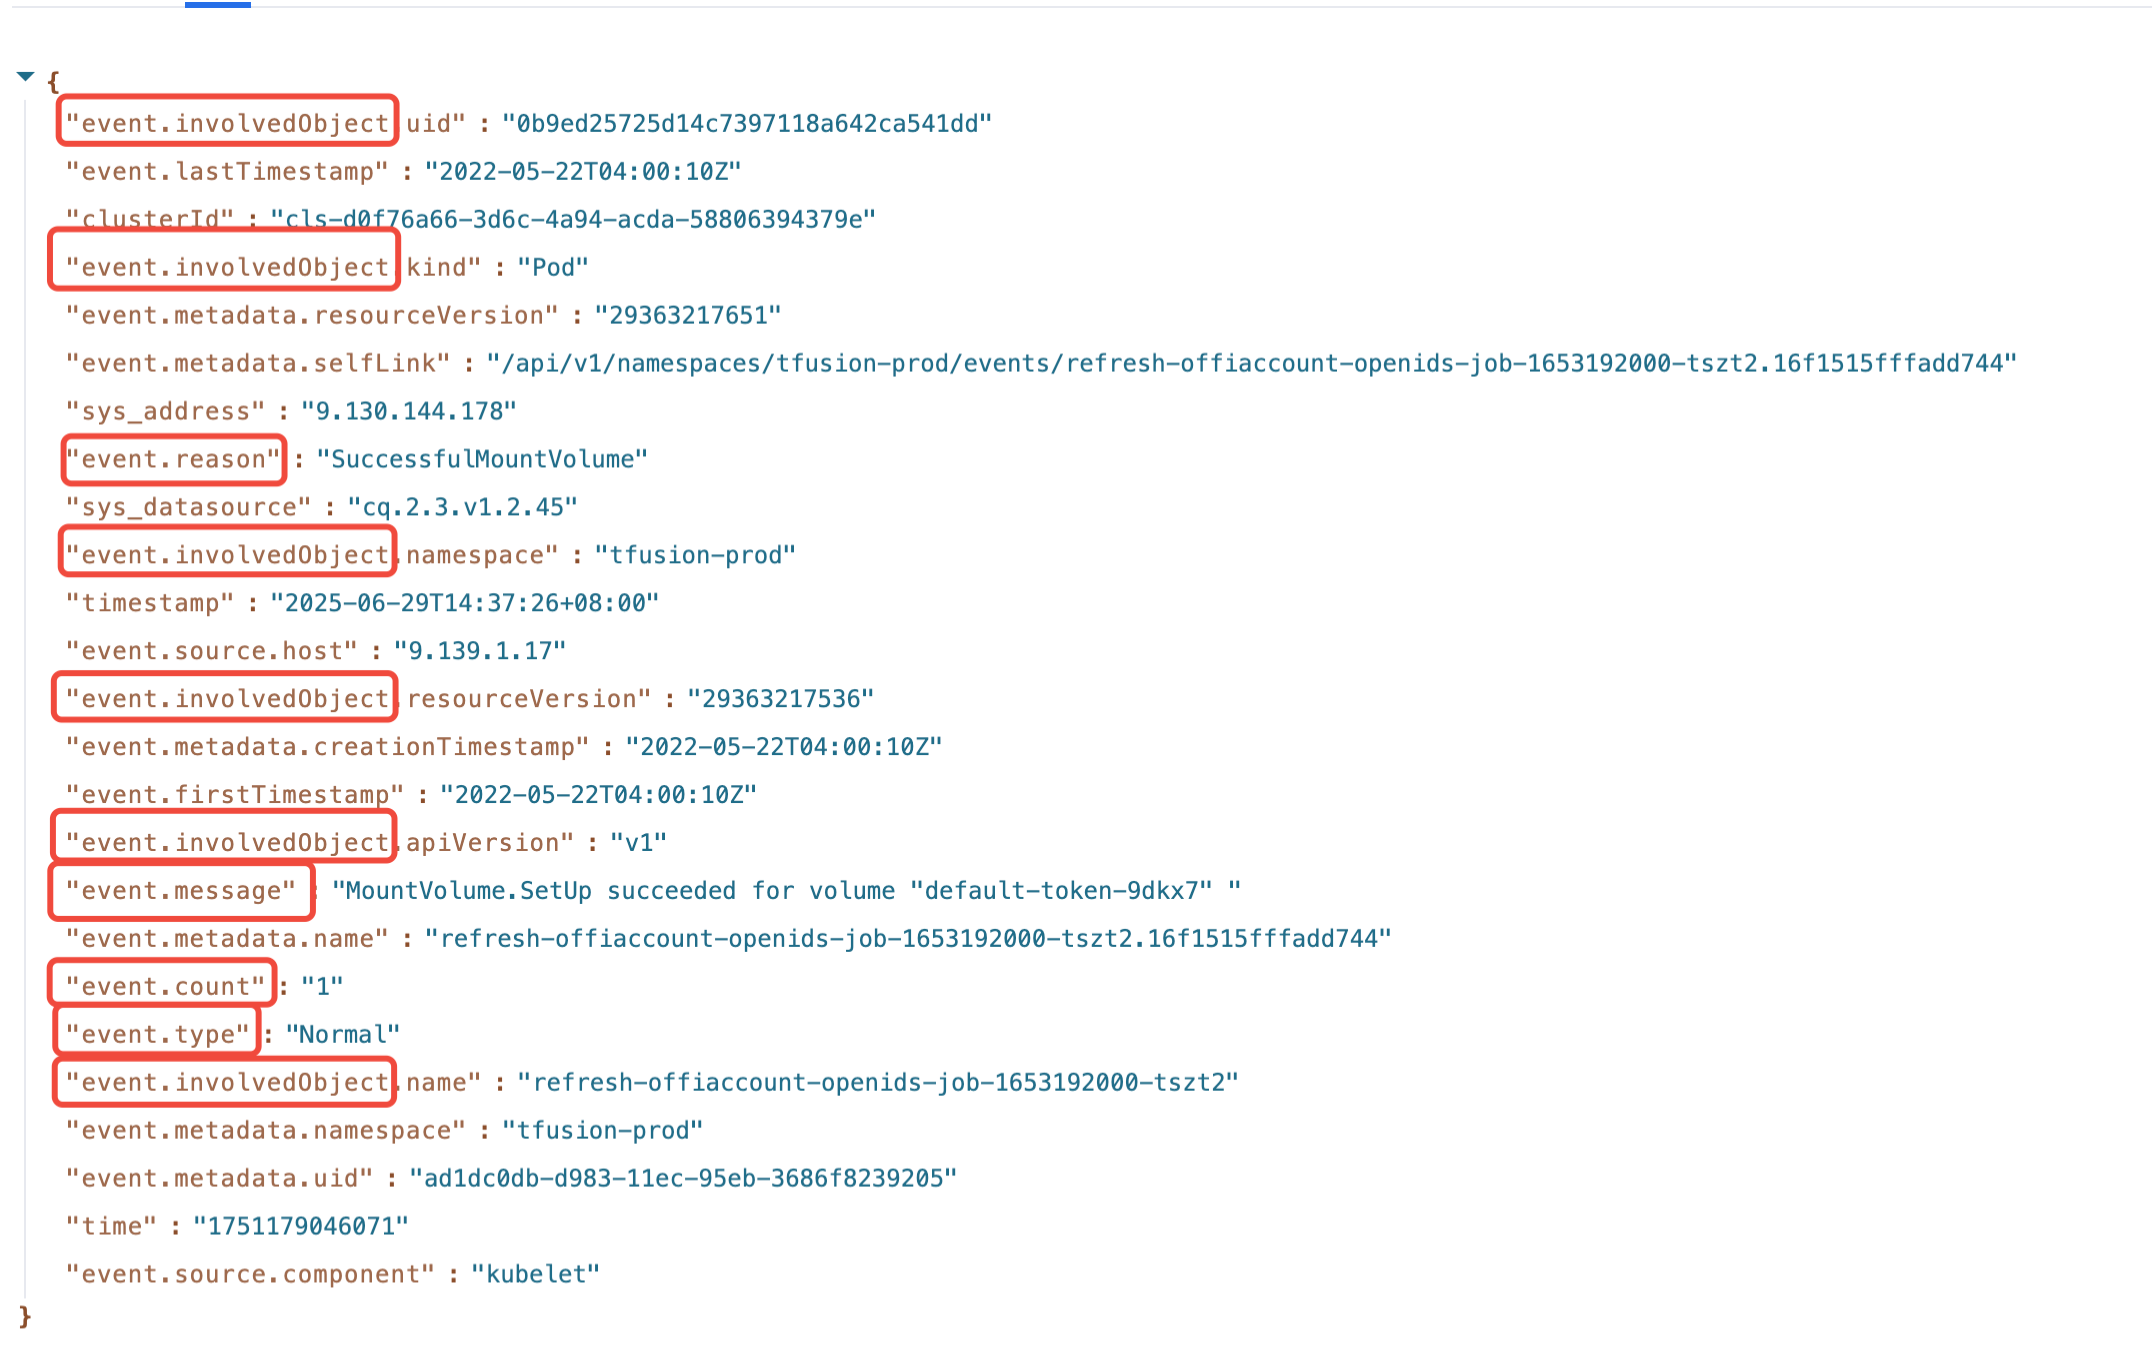
Level (type): Currently only the Normal and Warning levels are supported. If necessary, you can customize a level.
Resource type/object (involvedobject): Objects involved in the event, such as Pod, Deployment, and Node.
Event source (source): Component that reports the event, such as Scheduler and Kubelet.
Content (reason): Brief description of the current event. Generally, an enumerated value is used. This field is used within the program.
Detailed description (message): Detailed description of the current event.
Number of occurrences (count): Number of times the event occurs
Using Event Logs for Troubleshooting
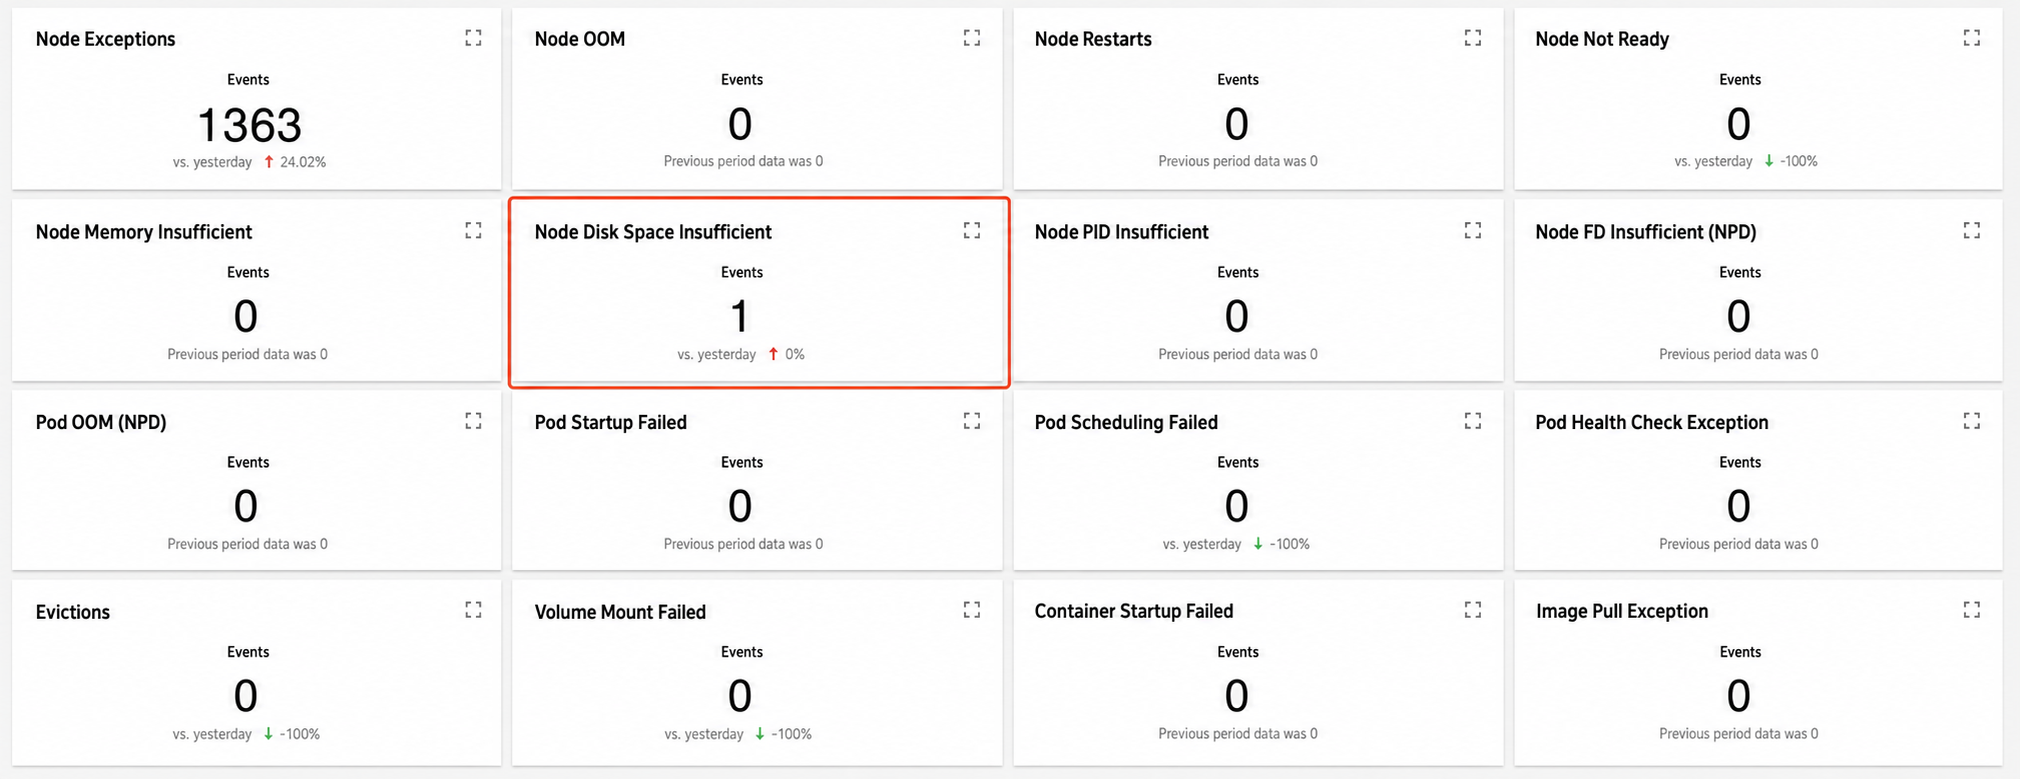
Scenario 1: An exception occurred on a node, and you need to locate the cause
2. The query results show that a node has insufficient disk space:
Scenario 2: A node triggered expansion, and you need to backtrack the expansion process to determine the cause
For clusters with node poolauto scaling enabled, the Cluster Autoscaler (CA) component will automatically increase or decrease the number of nodes in the cluster based on the actual load. If the nodes in the cluster are automatically scaled out, users can trace the entire scaling process through event search.
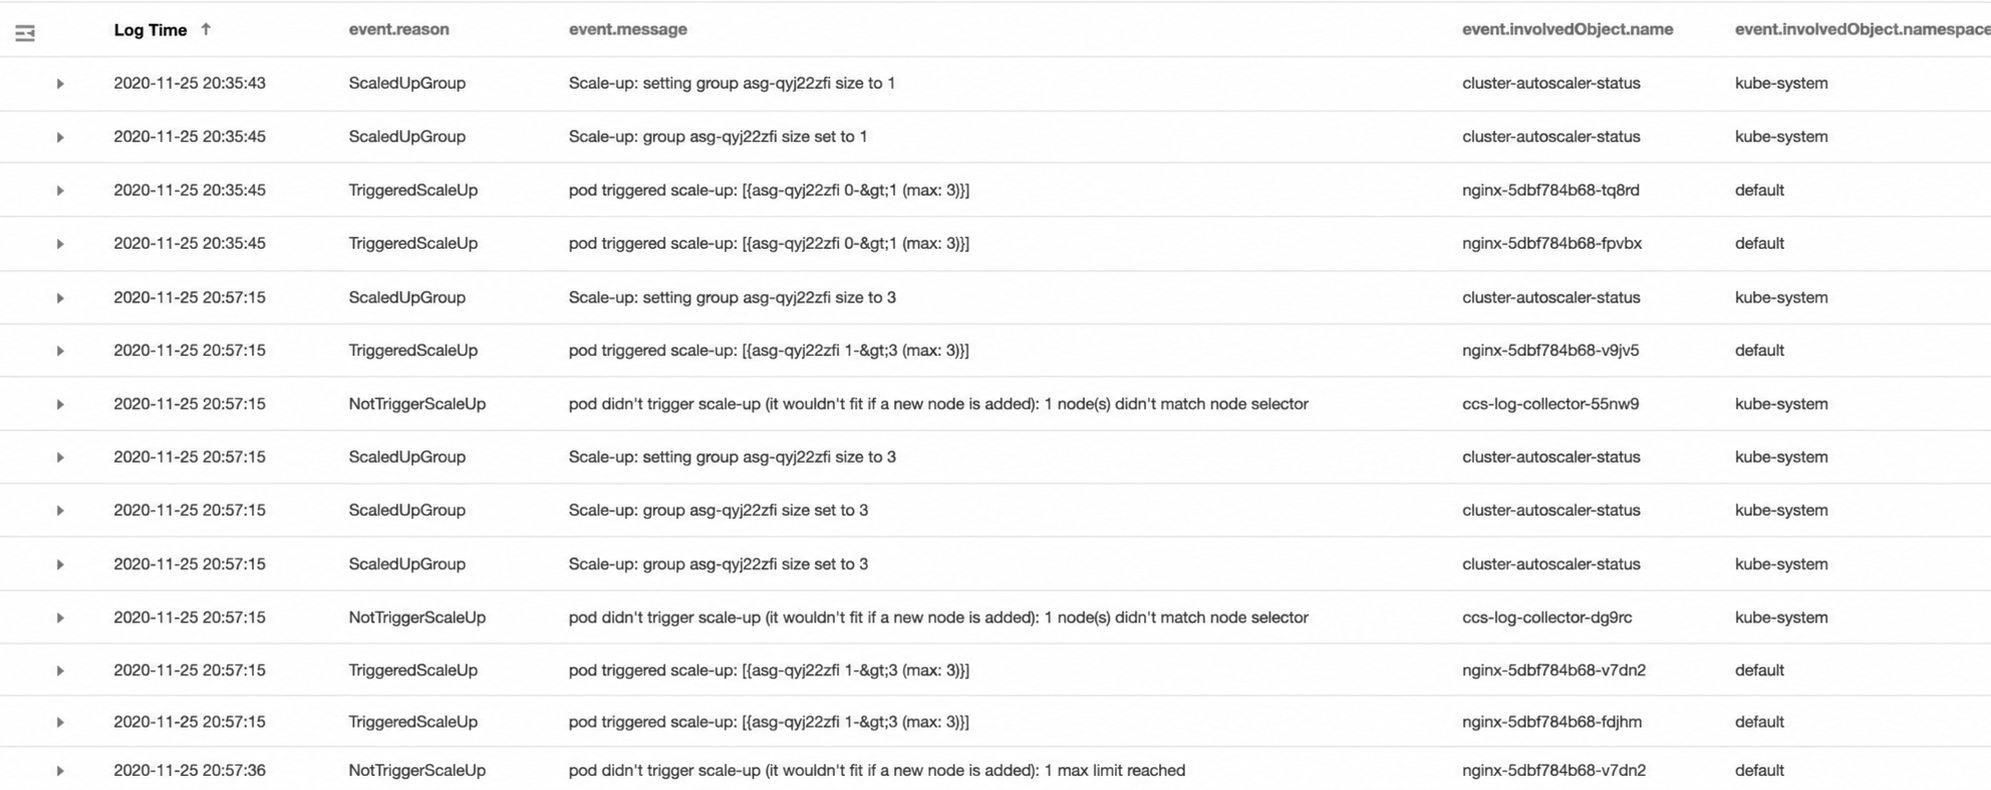
2. On the Event Search page, enter the following search command:
event.source.component :"cluster-autoscaler"
3. The results are shown in the following figure:
According to the event flow, you can find that the node scaling occurred around 2020-11-25 20:35:45 and was triggered by three NGINX pods (nginx-5dbf784b68-tq8rd, nginx-5dbf784b68-fpvbx, and nginx-5dbf784b68-v9jv5). After three nodes were scaled out, the subsequent scaling was not triggered because the number of nodes in the node pool reached the upper limit.