Atop is a tool for monitoring Linux system resources and processes. It records the system operation status at a certain frequency, collects the data of system resources (CPU, memory, disk and network) usage and process running status, and stores these information in the disk in the format of log files. You can obtain the corresponding atop log file to analyze an instance issue.
This document introduces how to use the atop monitoring tool with an example of CVM using CentOS 7.9 operating system.
The prompt message Complete! indicates that atop has been successfully installed.
Configuring and launching atop
Configure the atop monitoring period and log retention time as described below:
1. Execute the following command to open the atop configuration file with VIM editor.
vim /etc/sysconfig/docker
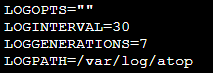
2. Press i to enter the edit mode and modify the configuration below:
Modify LOGINTERVAL=600 to LOGINTERVAL=30. This means to modify the monitoring period of 600s by default to a recommended value-30s. You can modify it to other values as needed.
Modify LOGGENERATIONS=28 to LOGGENERATIONS=7. This means to modify the log retention time of 28 days by default to 7 days. To prevent overmuch disk storage space from being occupied due to the long-term running of atop, it’s recommended to modify it to 7 days. You can modify it to other values as needed.
The result should be as follows:
3. Press Esc and enter :wq to save the modification and exit VIM editor.
4. Launch atop with the following commands executed in CentOS 7 and other upgraded systems.
systemctl restart atop
Analyzing atop
The launched atop records the collected data in the log file under the /var/log/atop directory. Please check the required log file name, execute the following command to view the log file, and analyze the data with reference to atop Common Commands and System Resource Monitoring Field Description.
atop -r /var/log/atop/atop_2021xxxx
atop Common Commands
You can use the following commands to filter the required data after opening the log file:
c: Filter by CPU utilization of Linux processes in descending order.
m: Filter by memory usage of Linux processes in descending order.
d: Filter by disk usage of Linux processes in descending order.
a: Filter by resource usage of Linux processes in descending order
n: Filter by network usage of Linux processes in descending order (This command is not supported by default. To use it, you need to install additional kernel modules).
t: Redirect to the next monitoring data collection spot.
T: Redirect to the previous monitoring data collection spot.
b: Specify point in time, in the format YYYYMMDDhhmm.
Description of system resource monitoring fields
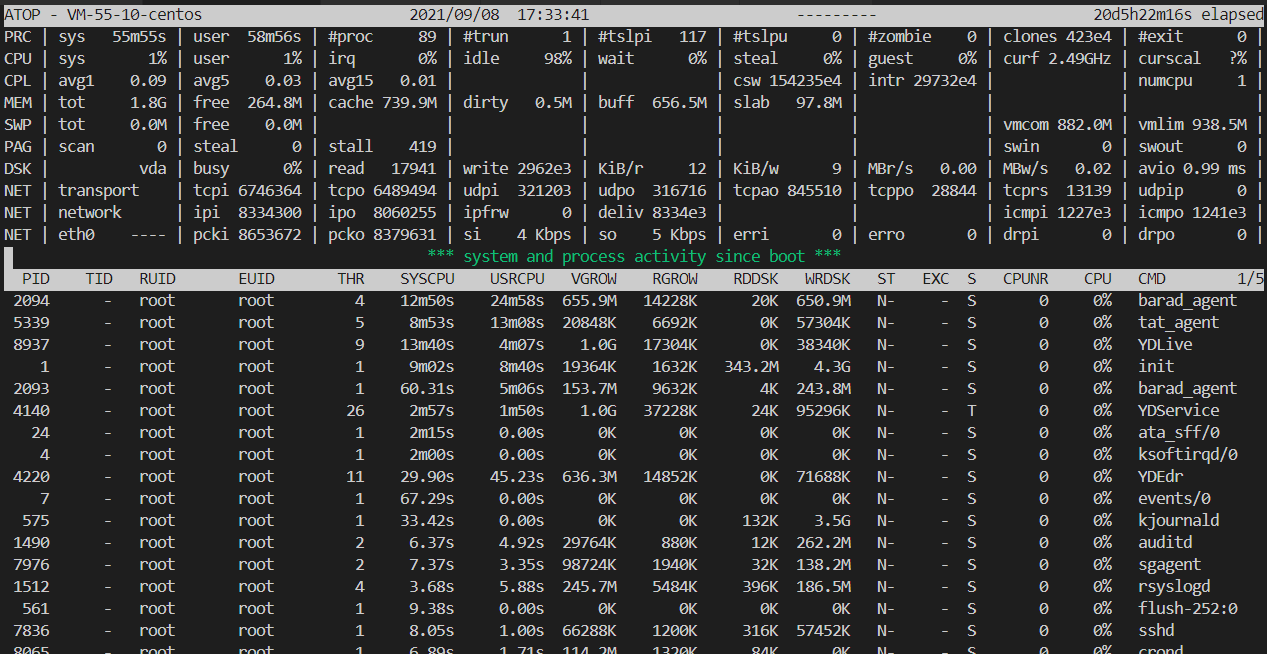
Some monitoring fields and values are shown below. These values obtained according to the sampling period are only for reference.
The main parameters are as follows:
ATOP: CVM name, information sampling date and point in time.
PRC: Overall operation status of the process.
sys and user: The ratios between CPU service time and the sampling period in Linux process kernel mode and user mode.
#proc: Total Linux processes.
#zombie: Zombie processes.
#exit: Processes exited during the atop sampling period.
CPU line: Usage of overall CPU configuration (Deem multi-core CPUs as a complete CPU resource). All values of the fields on the CPU line are added up to N00%, and N is equal to the number of CPU cores.
sys and user: The ratios between CPU service time and the sampling period in process kernel mode and user mode.
irq: The ratio between the time the CPU is used to process interrupts and the sampling period.
idle: The ratio between the CPU idle time and the sampling period.
wait: The ratio between the time the CPU is in the "idle state caused by the process waiting for the disk Input/Output" and the sampling period.
CPL line: CPU loading conditions.
avg1、avg5 and avg15:Average number of processes in the running queue in the past 1 minute, 5 minutes and 15 minutes.
csw: Number of context switches.
intr: Number of interruptions.
MEM line: Memory usage.
tot: Total physical memory.
cache: Memory used for page cache.
buff: Memory used for file buffer.
slab: Memory used by system kernel.
SWP line: Usage of swap space.
tot: Total swap area.
free: Idle swap space.
PAG: Paging of virtual memory
swin and swout: Number of memory pages swapped in and out.
DSK: Disk usage. A line of information shows the usage of each disk device. Add a line of DSK information if there is sdb device.
sda: Disk device identifier.
busy: Disk busy time percentage.
read and write: Number of reading and writing requests.
NET line: The multiple NET lines show the network conditions, including the information of transport layer (TCP and UDP), IP layer and active network interfaces.
xxxxxi: Number of packages received at each layer or active network interface.
xxxxxo: Number of packages sent at each layer or active network interface.
Stop atop
It is not recommended to run atop for a long time in application environment. You can stop atop after troubleshooting. In CentOS 7 and other upgraded systems, you can execute the following command to stop the atop.

 Yes
Yes
 No
No
Was this page helpful?