DBbrain provides the Performance Trends feature. It not only supports the selection of multiple performance metrics, including key metrics, all metrics, and custom metrics, but also supports multiple ways to view performance trends, such as fine-grained single-metric trend views, linked multi-metric comparison views, and time-based comparison views.
Supported Performance Metrics
Category
Subcategory
Metric Name (English)
Unit
Resource monitoring
CPU
cpu
%
MEM
memory_rate
%
Storage space
log_file_size
GB
data_file_size
GB
storage
GB
IO
throughput_read
Byte/second
throughput_write
Byte/second
cluster_in_flow
Byte/second
cluster_out_flow
Byte/second
Server
TPS
tps
Times/second
QPS
qps
Times/second
Connect
connections
Pcs
idle_conns
Pcs
Total Requests
write_calls
Times
Slow Query
slow_query_cnt
Times/second
Prerequisites
The current account has view permissions for the target instance.
2. In the left sidebar, select Performance Optimization.
3. Select the PostgreSQL database type and instance ID at the top of the page, then choose the Performance Trends tab.
4. Select performance metrics from the drop-down list, or click Key Metrics, Select All, or Deselect All in the upper-right corner. After you select metrics, click Save.
Note:
Click Save to apply the metrics to the currently selected instance only, or click Save and Apply to All Instances to apply the selected metrics to all database instances.
5. Select the time range for viewing.
Real-time view of performance trend: You can view the performance trend of the instance. Auto-refresh is enabled by default, with a refresh frequency of 5 seconds. You can also select 15 seconds or 30 seconds, or disable auto-refresh.
Historical view of performance trend: You can select different time ranges to display the performance trend monitoring view for the selected period. Quick time ranges, such as last 1 hour, last 3 hours, last 24 hours, and last 7 days, are supported. You can also customize any continuous 7-day period within the last 30 days for viewing.
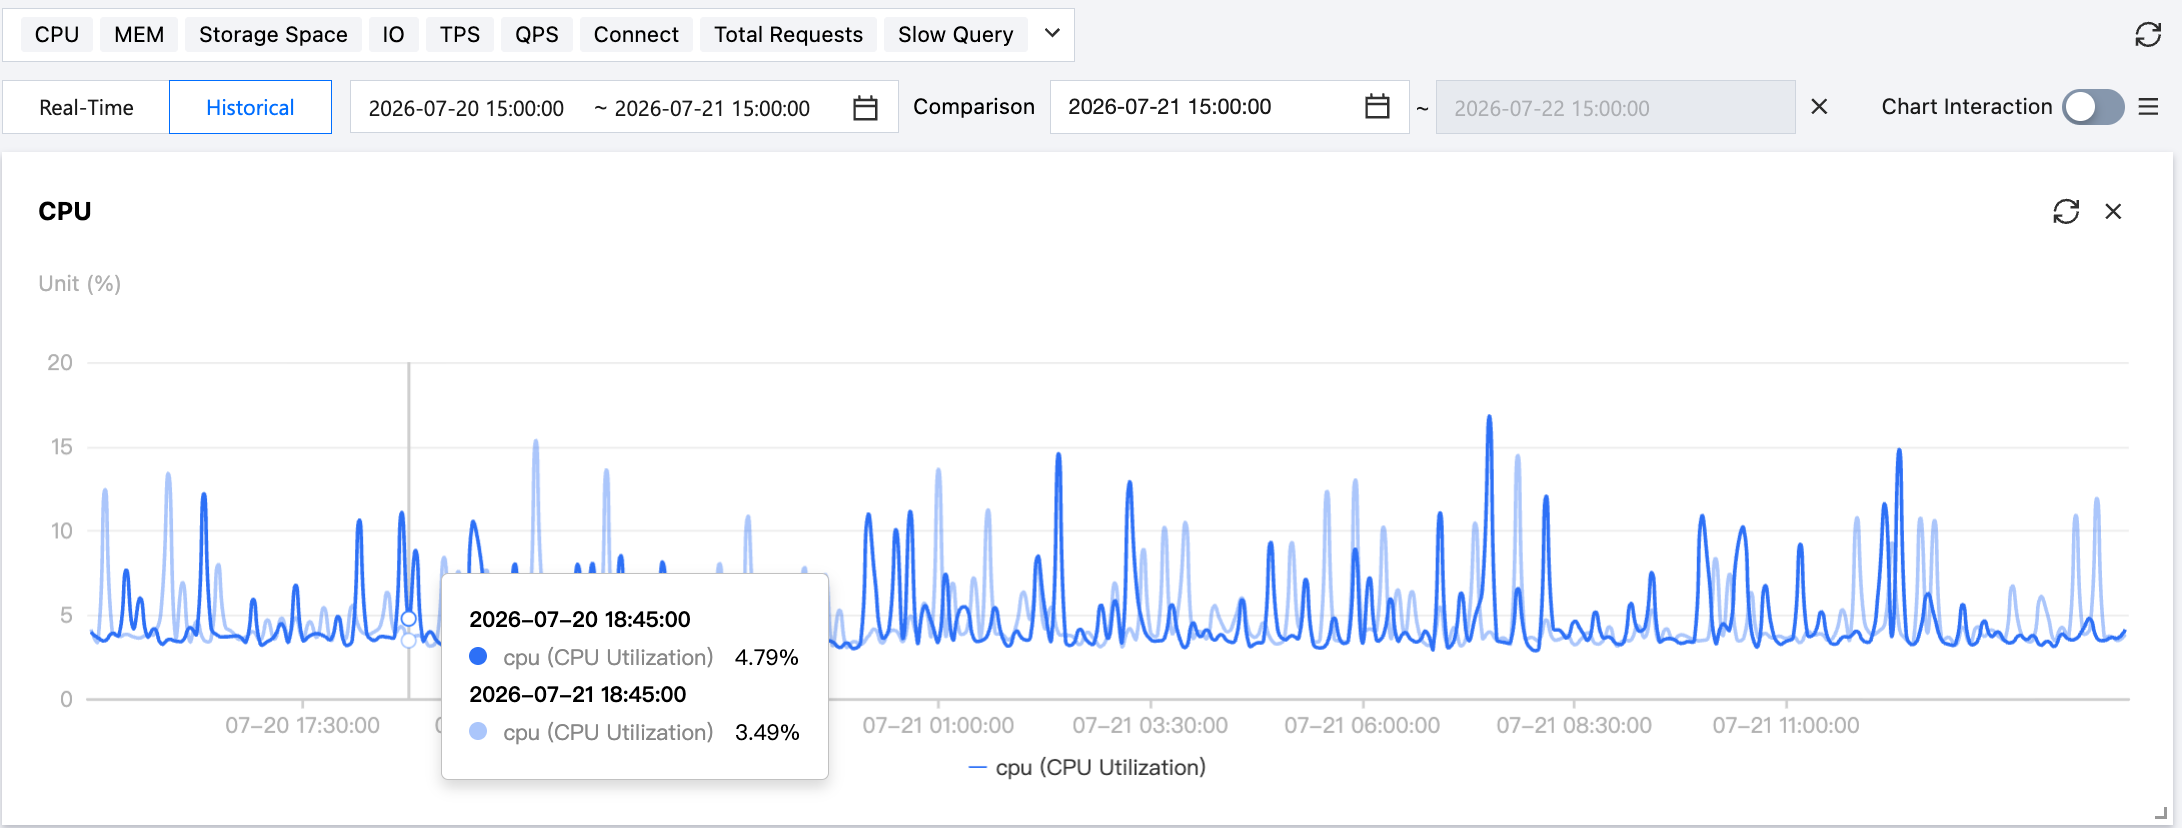
You can click Add Time Comparison to compare performance trends between two time periods.
6. View the performance trend chart. The following view methods are supported:
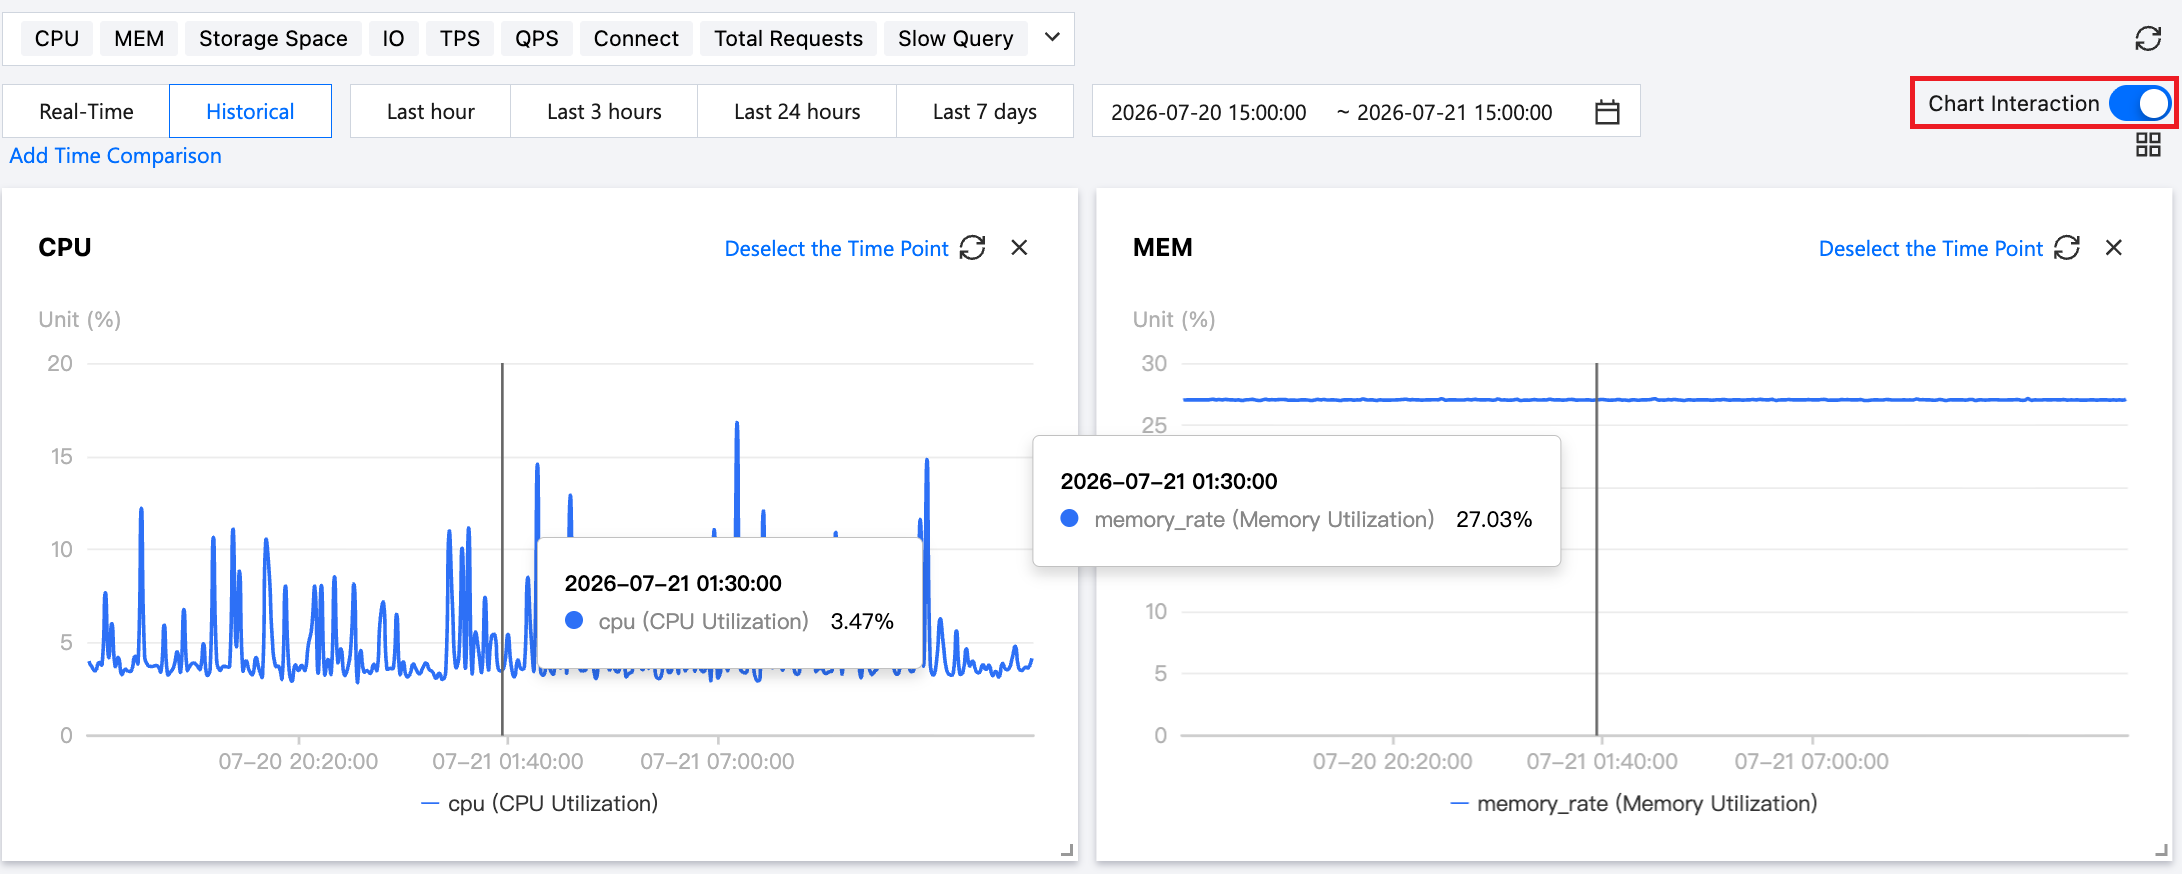
Chart Interaction: Click to enable the Chart Interaction button on the right to view correlated comparisons of multi-instance and multi-metric monitoring views.
Hover the cursor over any data point on a trend chart to display data from the same time point on other charts. Click to pin the data display. To unpin, click Deselect the Time Point on the trend chart.
Switch between the one-column and two-column display modes: Click
(displayed in two-column mode) or
(displayed in one-column mode) to the right of Chart Interaction in the upper-right corner to switch display modes.
Freely drag monitoring charts:Monitoring charts can be repositioned by dragging them. Click the border of a trend chart to move it freely within the dashboard.
Zoom in the monitoring chart: Drag the icon at the bottom-right corner of the monitoring chart to zoom in for a clearer, more fine-grained view of a single performance metric trend.