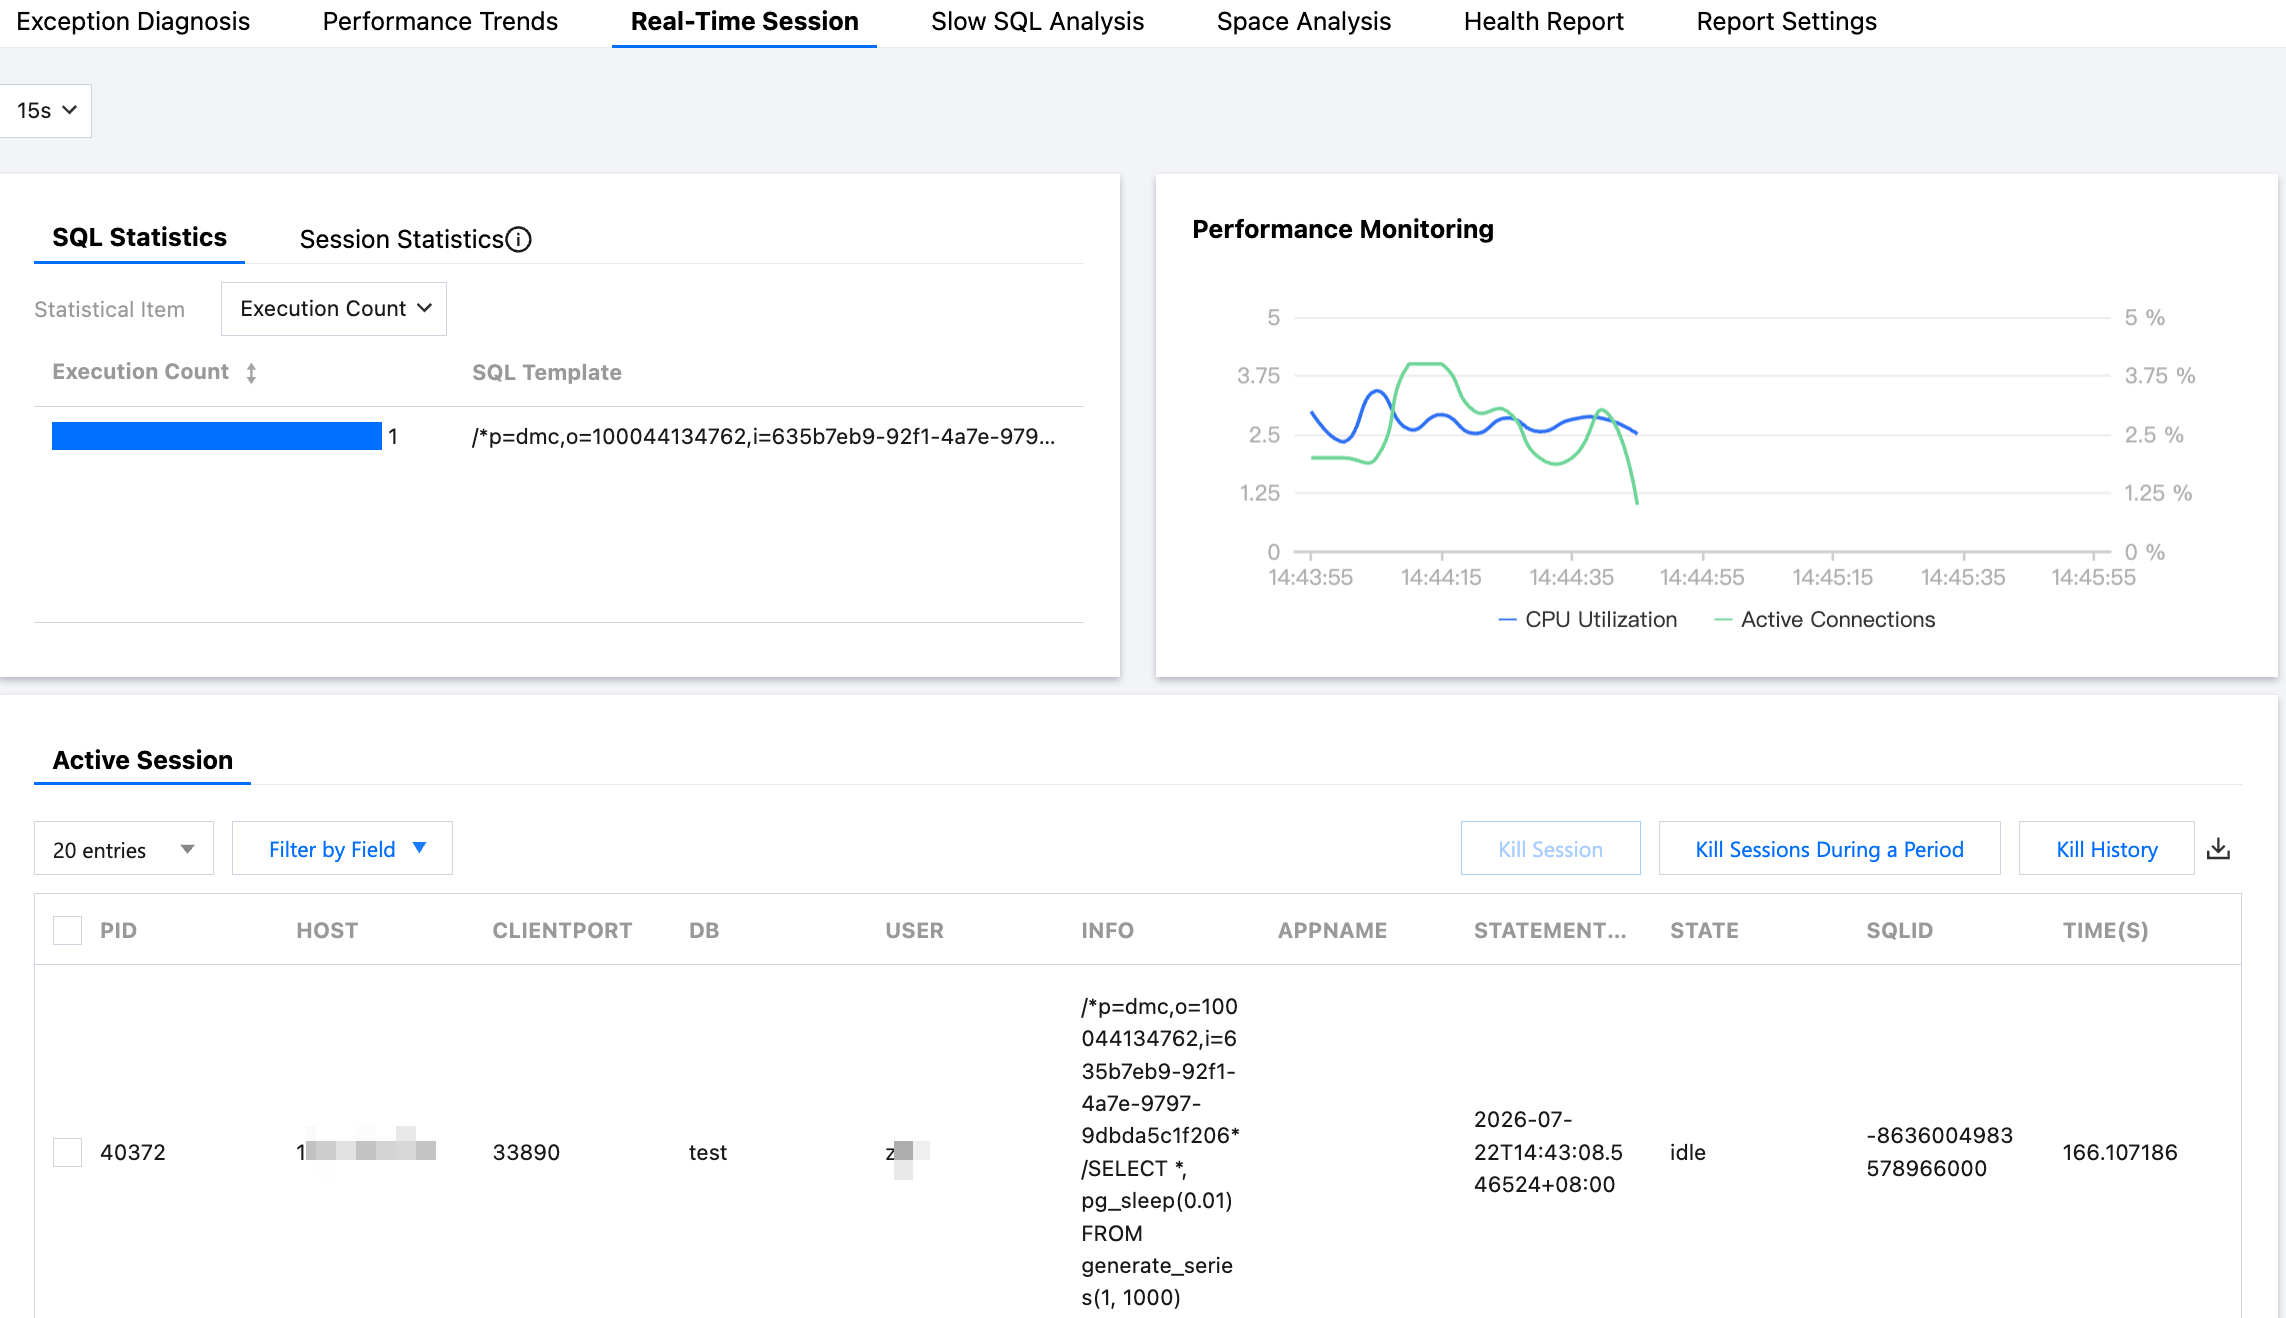
The DBbrain Real-time Session page supports features such as SQL statistics, session statistics, active sessions, performance monitoring, and killing sessions. It helps O&M personnel quickly view instance session information, manage instance sessions, and efficiently identify session connection issues that are hard to detect manually.
Prerequisites
The current account has view permissions for the target instance.
2. In the left sidebar, select Performance Optimization.
3. At the top of the page, select the PostgreSQL database type and instance ID, and select the Real-Time Session tab.
4. Select the page refresh frequency. Options include 5s, 15s, and 30s. The default is 15s. You can also stop auto-refresh.
5. View SQL statistics, session statistics, active sessions, and performance monitoring information.
Note:
SQL statistics and session statistics are consistent with the active session data below.
View SQL statistics
Select the SQL Statistics tab, and select the statistics items (including the execution count, total time consume, max execution time, and average execution time) to view real-time statistics of SQL statements in different dimensions.
View session statistics
Select the Session Statistics tab, and specify the statistics items (including user, access source, database) to collect real-time session data in different dimensions.
View active sessions
5.1.1 Select the Active Sessions tab.
5.1.2 Select the number of sessions to display: It includes limiting to 20, 50, or 100, with a default value of 20.
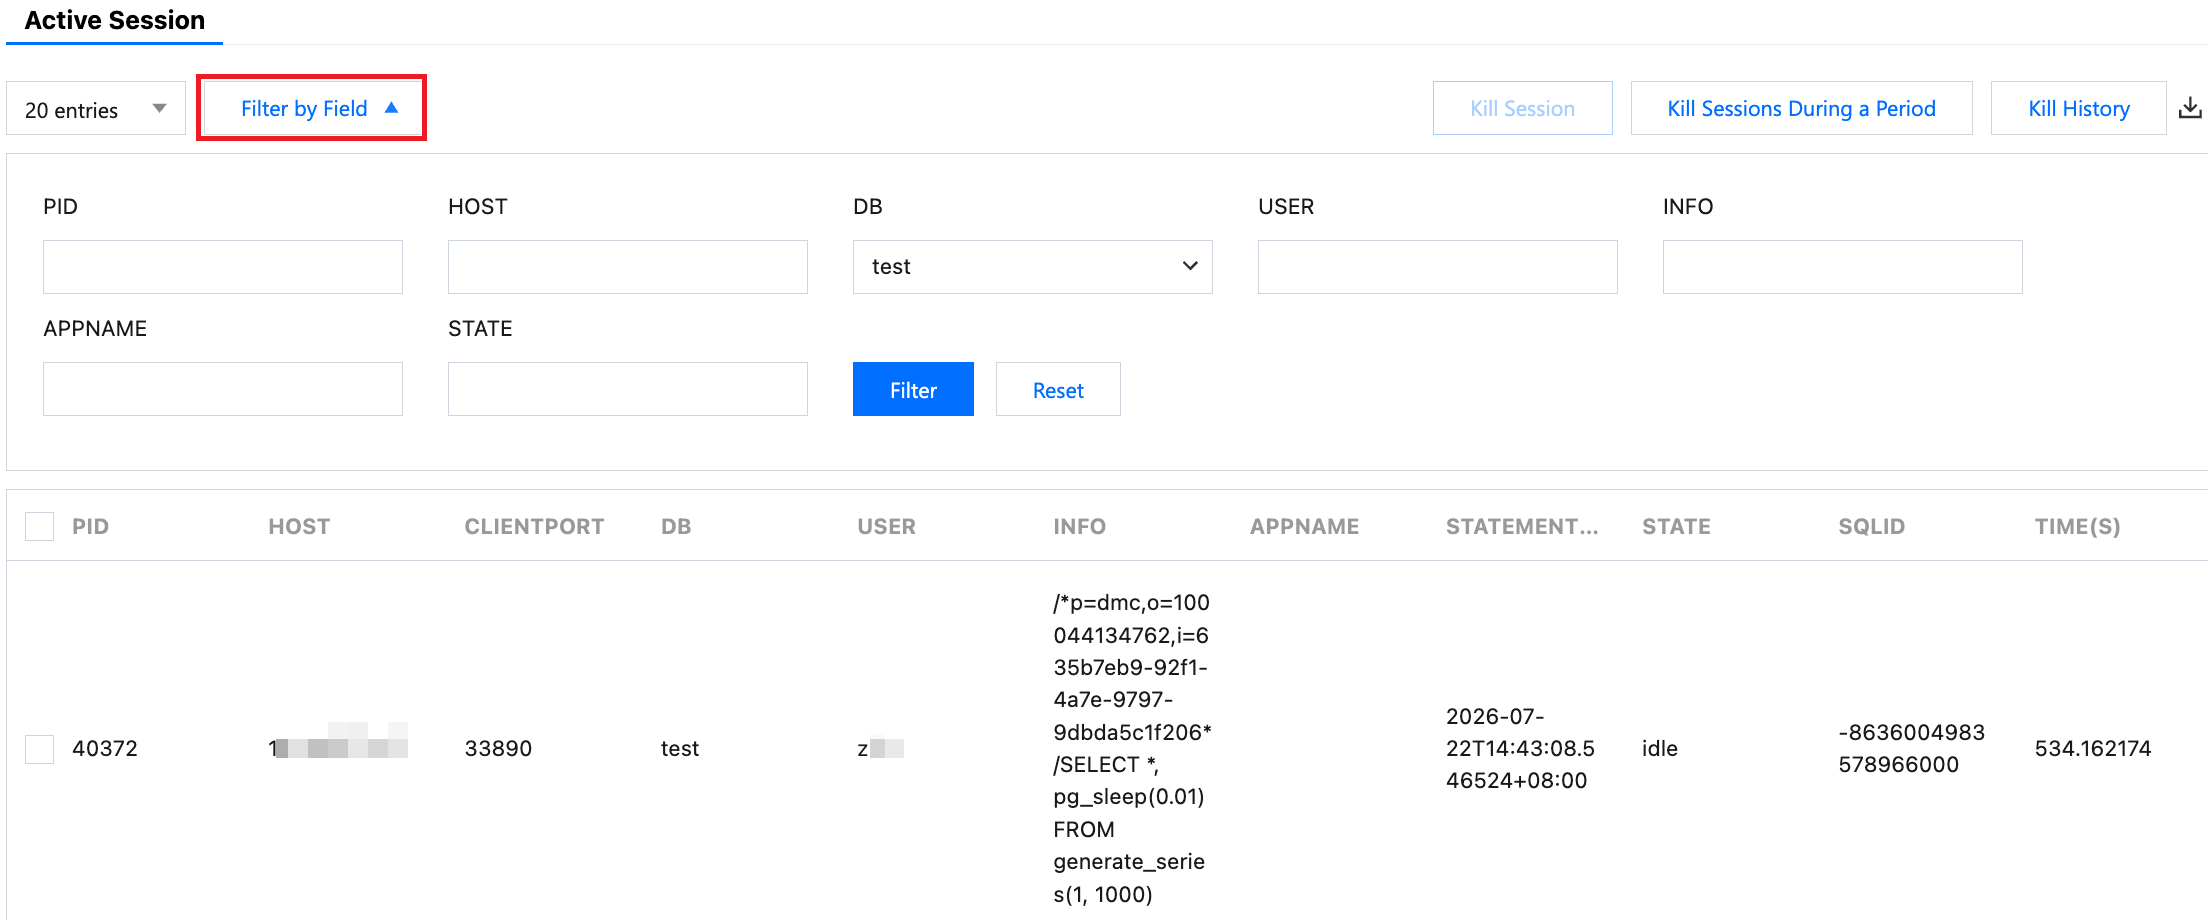
5.1.3 Click Field by Filter, set the following conditions, and view real-time sessions.
5.1.4 View the filtered real-time sessions based on the filtering conditions.
The session list field descriptions are as shown in the table below.
Field Name
Description
PID
Process ID, the unique identifier for PostgreSQL backend processes.
HOST
Client host IP address.
CLIENTPORT
Client connection port number.
DB
Currently connected database name.
USER
Database username used for the connection.
INFO
Currently executing SQL statement.
APPNAME
Client application name (such as psql, application service name, and so on).
STATEMENTSTART
Execution start time of the SQL statement (with time zone).
STATE
Current session status.
active: Executing a query.
idle: Waiting for new commands.
idle in transaction: Idle within a transaction, which has not been committed.
idle in transaction (aborted): Error occurred in the transaction, waiting for rollback.
fastpath function call: Executing a fast-path function.
disabled: State tracking is disabled.
SQLID
Unique identifier for SQL statements.
TIME(S)
Execution time of the SQL statement (unit: seconds).
5.1.5 (Optional) You can click
in the upper right corner of the list to download the real-time session list in the CSV format.
View performance monitoring data
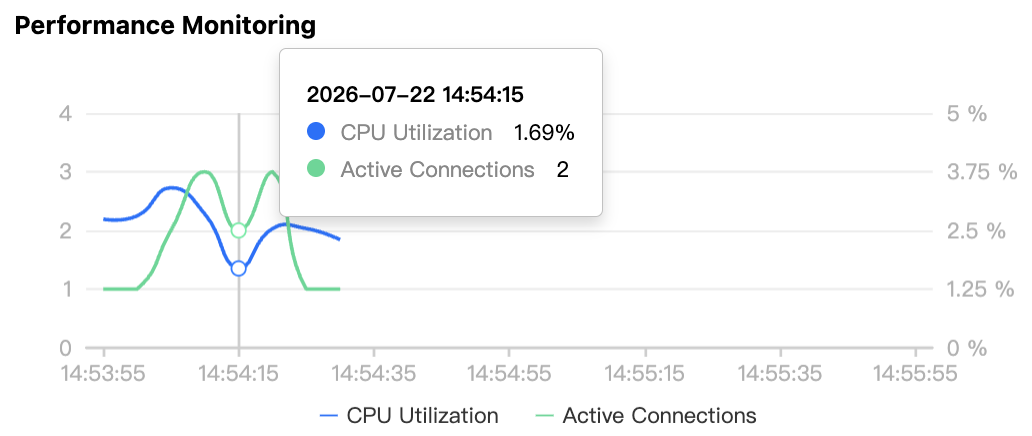
You can enter the Real-Time Session page, and view real-time performance monitoring data and trends within 2 minutes in the Performance Monitoring area.
Performance monitoring data includes CPU utilization and active connections.
Hover the cursor over a time point to display the specific data of 2 performance metrics.
2. In the left sidebar, select Performance Optimization.
3. At the top of the page, select the PostgreSQL database type and instance ID, and select the Real-Time Session tab.
4. On the Real-Time Session page, select the Active Session tab.
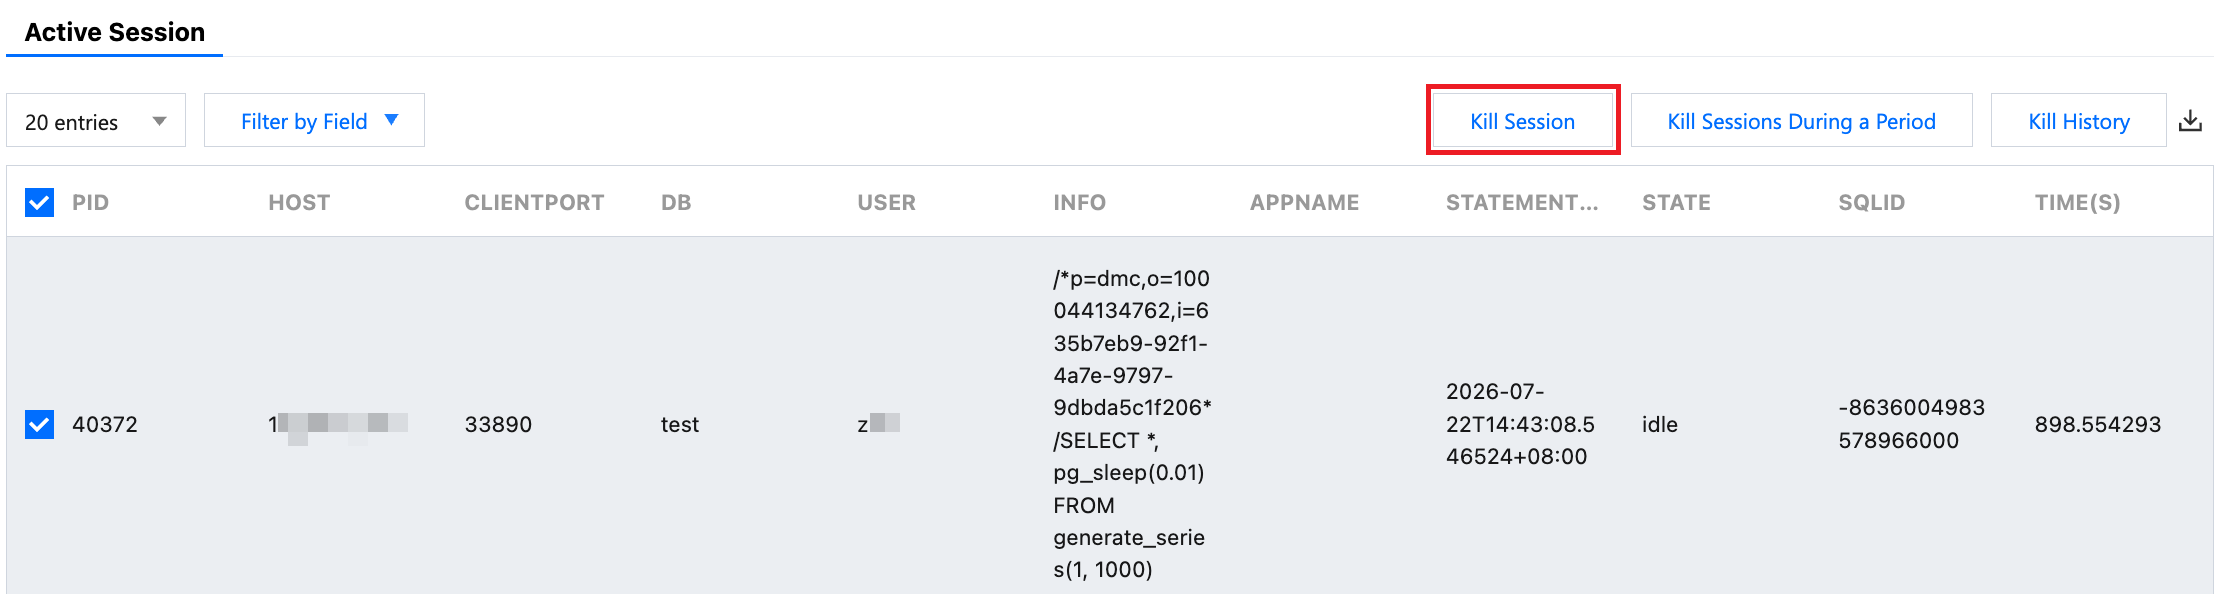
5. In the real-time session list, check the session to be killed, click Kill Session at the top right of the list, and click OK in the pop-up dialog box.
After killing the session, you can click Kill History at the top of the list to view the killed sessions.
Viewing the History of Killed Sessions
1. Select the Active Session tab.
2. Click Kill History in the upper-right corner of the list, select a time period (including the last 1 hour, last 24 hours, last 7 days, last 30 days, or a custom time period), and view the history of killed sessions.