- Introduction
- Purchase Guide
- Getting Started
- Advanced Guide
- Serverless Framework Component
- Operation Guide
- Components Usage Examples
- FAQs
- Framework Support
- Deploying Framework on Command Line
- Quickly Deploying Egg Framework
- Quickly Deploying Koa Framework
- Quickly Deploying Express Framework
- Quickly Deploying Next.js Framework
- Quickly Deploying Nuxt.js Framework
- Quickly Deploying Flask Framework
- Quickly Deploying Laravel Framework
- Quickly Deploying Nest.js Framework
- Quickly Deploying Django Framework
- Quickly Deploying Native WordPress Application
- Contact Us
Development Mode
The development mode enables you to write code for and develop and debug projects in development status more easily, so that you can continuously focus on the process from development to debugging while minimizing the interruptions caused by other tasks such as packaging and update.
Entering development mode
Under a project, you can run serverless dev to enter the development mode:
Below is an example:
$ sls dev
serverless ⚡ framework
Dev Mode - Watching your Component for changes and enabling streaming logs, if supported...
Debugging listening on ws://127.0.0.1:9222.
For help see https://nodejs.org/en/docs/inspector.
Please open chorme, and visit chrome://inspect, click [Open dedicated DevTools for Node] to debug your code.
--------------------- The realtime log ---------------------
17:13:38 - express-api-demo - deployment
region: ap-guangzhou
apigw:
serviceId:   service-b77xtibo
subDomain:   service-b77xtibo-1253970226.gz.apigw.tencentcs.com
environment: release
url:         http://service-b77xtibo-1253970226.gz.apigw.tencentcs.com/release/
scf:
functionName: express_component_6r6xkh60k
runtime:      Nodejs10.15
namespace:    default
express-api-demo › Watching
After you enter the development mode, the Serverless tool will output the deployed content and start continuous file monitoring. When a code file is modified, it will be automatically deployed again to sync the local file to the cloud.
Deploy again and output the deployment information:
express-api-demo › Deploying ...
Debugging listening on ws://127.0.0.1:9222.
For help see https://nodejs.org/en/docs/inspector.
Please open chorme, and visit chrome://inspect, click [Open dedicated DevTools for Node] to debug your code.
--------------------- The realtime log ---------------------
21:11:31 - express-api-demo - deployment
region: ap-guangzhou
apigw:
serviceId:   service-b7dlqkyy
subDomain:   service-b7dlqkyy-1253970226.gz.apigw.tencentcs.com
environment: release
url:         http://service-b7dlqkyy-1253970226.gz.apigw.tencentcs.com/release/
scf:
functionName: express_component_uo5v2vp
runtime:      Nodejs10.15
namespace:    default
Note:Currently,
serverless devsupports only by the Node.js 10 runtime environment. It will support real-time logging in more environments such as Python and PHP.
Exiting development mode
You can press Ctrl+C to exit the development mode (dev mode).
express-api-demo › Disabling Dev Mode & Closing ...
express-api-demo › Dev Mode Closed
In-cloud Debugging: Node.js 10+
For projects whose runtime environment is Node.js 10+, you can connect them to in-cloud debugging by enabling in-cloud debugging and using a debugging tool such as Chrome DevTools or VS Code Debugger.
Enabling in-cloud debugging
When you enter the development mode as instructed above, if the project is a function whose runtime environment is Node.js 10 or above, in-cloud debugging will be automatically enabled and debugging information will be output.
For example, when you enable the development mode, if the following information is output, in-cloud debugging has been enabled for this function.
Debugging listening on ws://127.0.0.1:9222.
For help see https://nodejs.org/en/docs/inspector.
Please open chorme, and visit chrome://inspect, click [Open dedicated DevTools for Node] to debug your code.
Using Chrome DevTools
The following steps are used as an example to describe how to use DevTools in Chrome to connect to a remote environment for debugging:
- Start the Chrome browser.
- Enter
chrome://inspect/in the address bar to access it. - You can open DevTools in two ways as shown below:
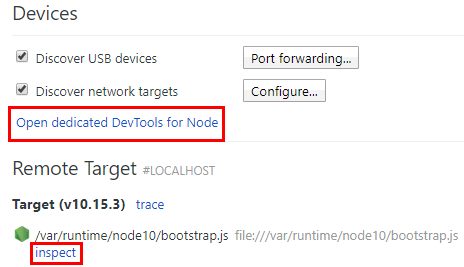
- (Recommended) Click Open dedicated DevTools for Node under "Devices".
- Select inspect under a specific target in "Remote Target #LOCALHOST".
If you cannot open the target or there are no targets, please check whether configuration oflocalhost:9229orlocalhost:9222exists in "Configure" under "Devices", which corresponds to the output after in-cloud debugging is enabled. - In DevTools opened after you click Open dedicated DevTools for Node, you can click the Sources tab to view the remote code. The actual code of the function is in the
/var/user/directory.
On the Sources tab, the code that you want to view may be loaded. More remote files will be displayed as the debugging proceeds. - Open a file as needed and set a breakpoint at the specified position in it.
- If you trigger the function in any means such as URL access, page, command, or API, the remote environment will start running and be interrupted at the breakpoint to wait for further operations.
- On the tool bar on the right of DevTools, you can continue the execution of an interrupted program or perform other operations such as step-over, step-into, and step-out on it. You can also directly view the current variables or set the variables that you want to track. For more information on how to use DevTools, please see the DevTools user guide.
Exiting in-cloud debugging
When you exit the development mode, in-cloud debugging will be disabled automatically.
Command Debugging
The Serverless Framework SCF component supports triggering functions with the invoke command for debugging. For a function successfully deployed by running sls deploy, enter the project directory and run the following command to invoke it:
sls invoke --inputs function=functionName clientContext='{"weights":{"2":0.1}}'
Note:
- The
invokecommand must be executed in the same directory as theserverless.ymlfile deployed for the function.clientContextis the JSON string passed when the function is triggered. You can simulate different triggering events according to the JSON string format in the triggering event template.

 Yes
Yes
 No
No
Was this page helpful?