集群监控
下载
聚焦模式
字号
背景说明
腾讯云数据仓库 TCHouse-C 的集群性能监控存在两种形式,具体如下:
购买集群时未启用 Grafana 监控项,仅可使用默认的集群监控页。
集群购买时开启了 Grafana 监控项,可使用高级版的集群监控系统,并支持集群告警策略配置。
未启用 Grafana 监控
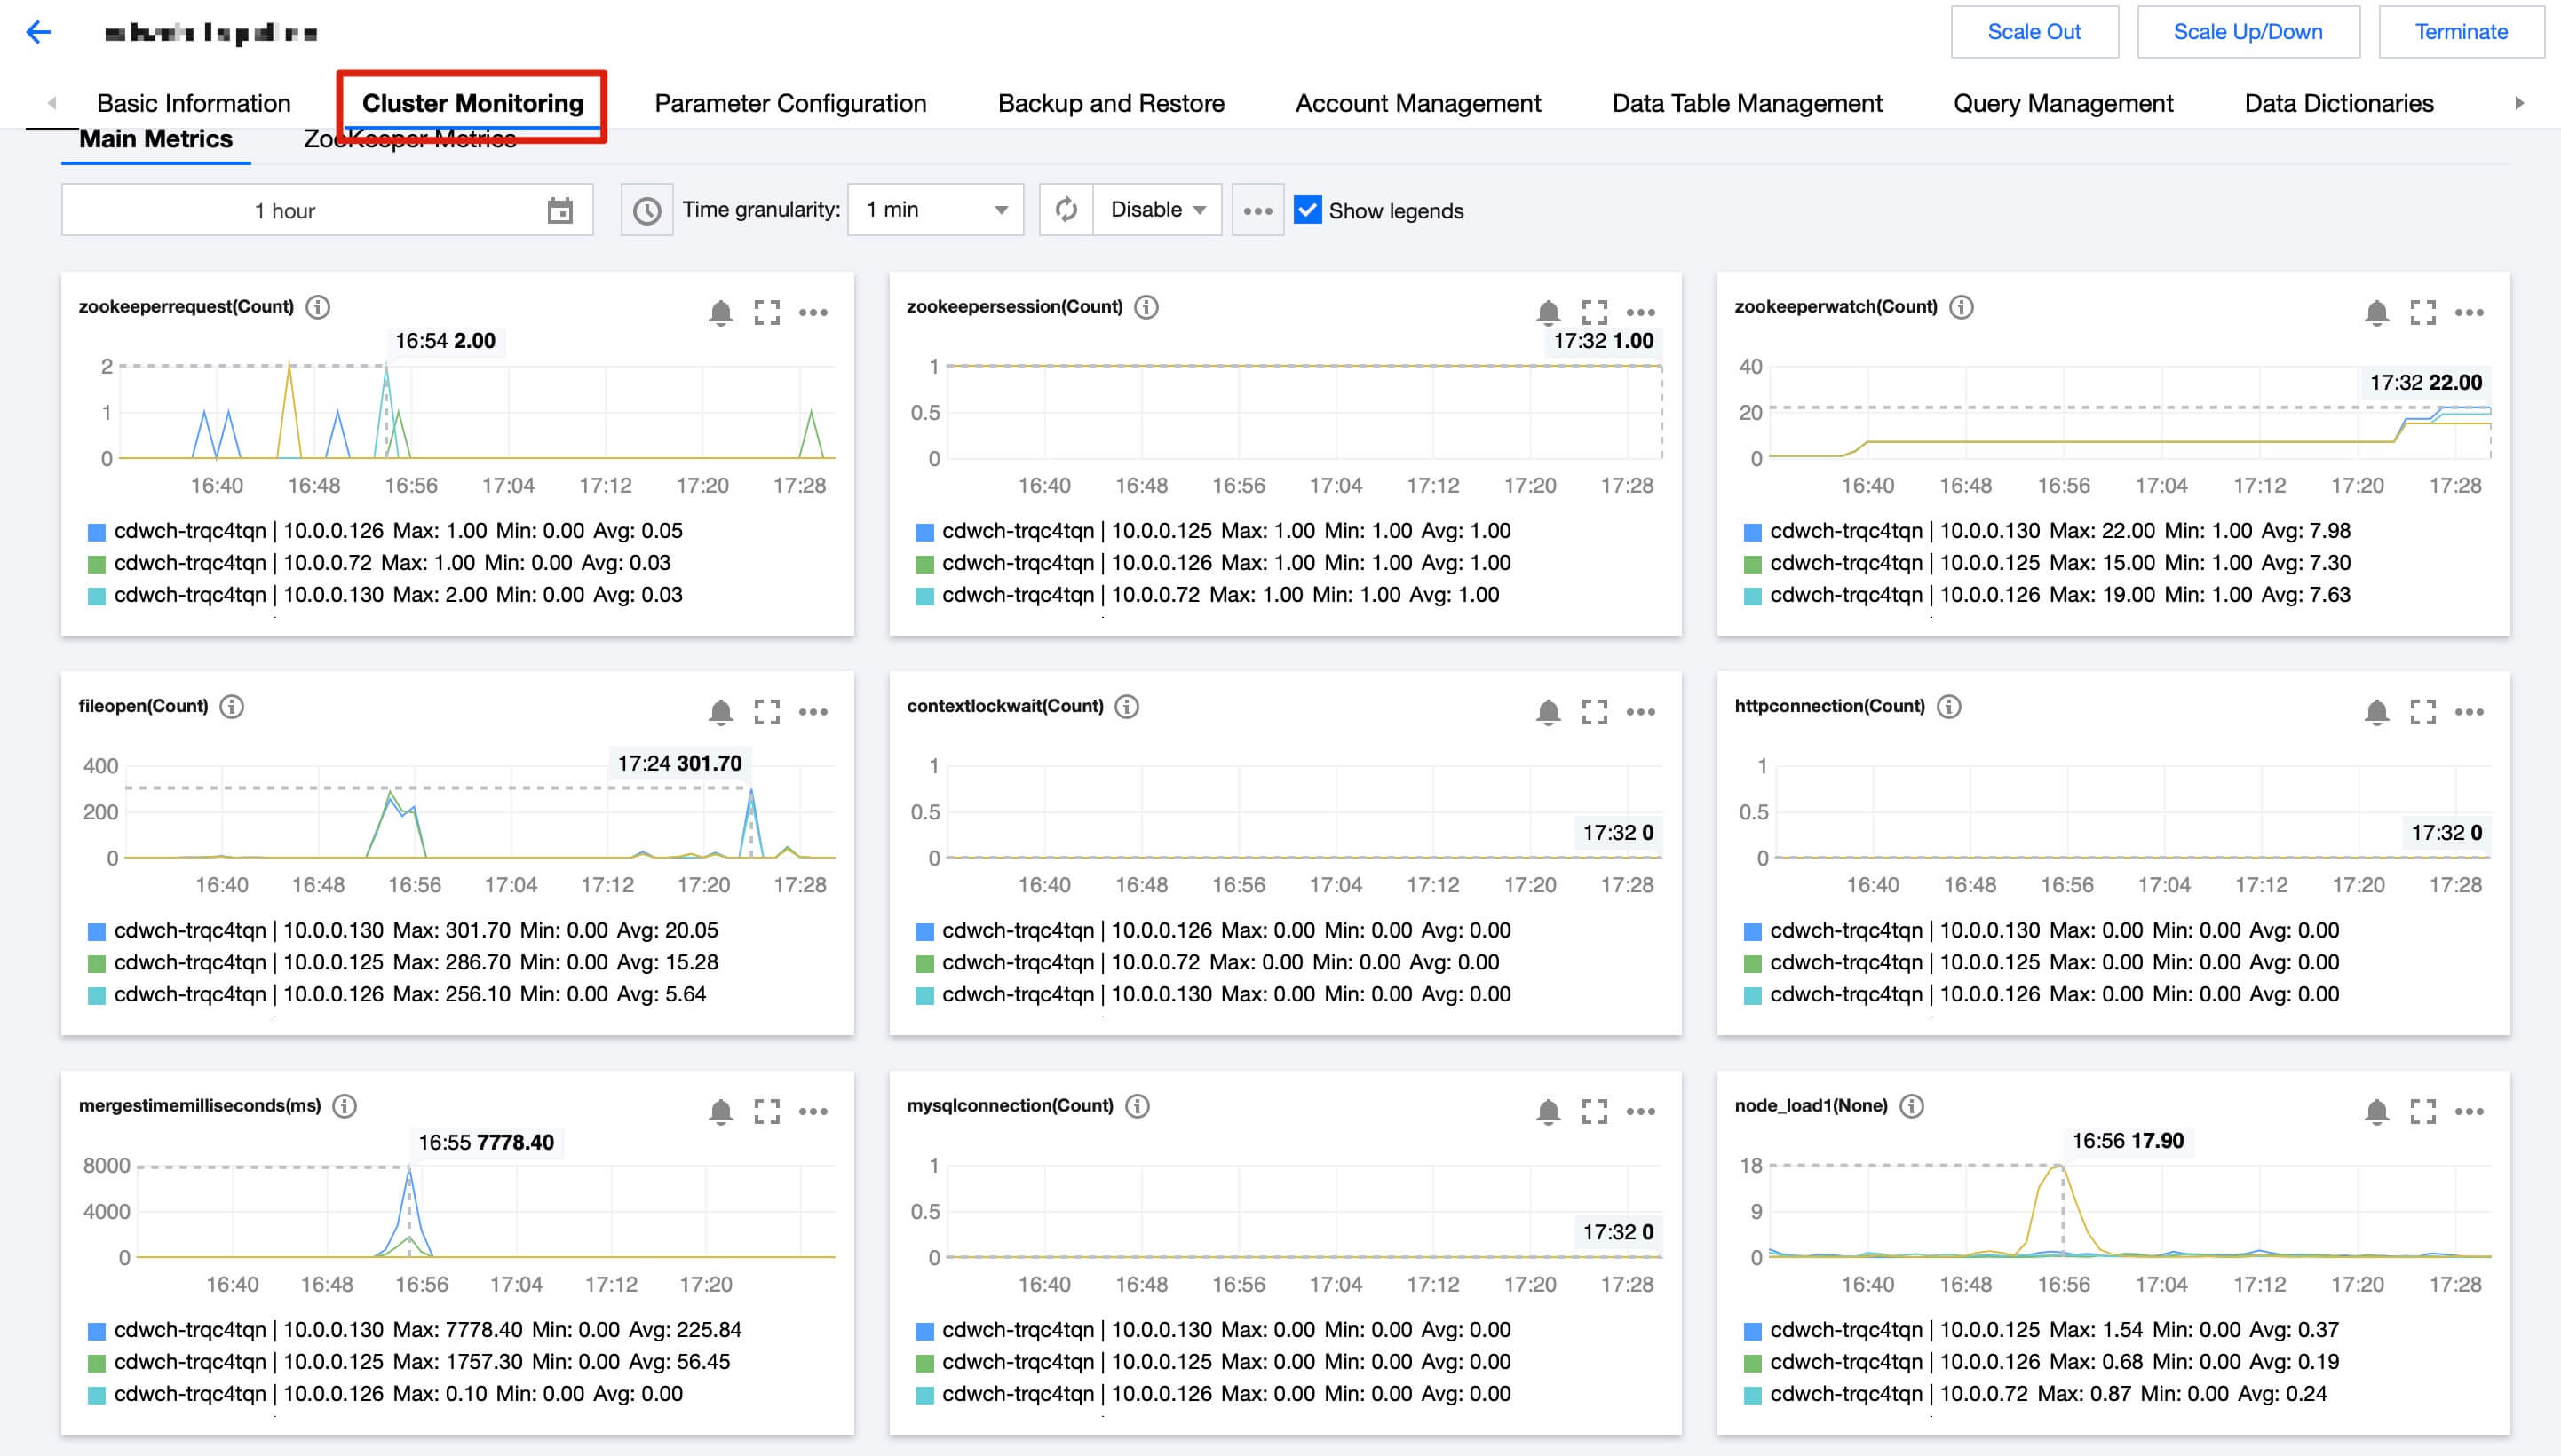
指标名 | 释义 |
网络连接数 | 服务器的连接总数 |
SELECT 查询数 | 单位时间内执行查询次数 |
已打开的文件总数 | 已打开的文件数 |
INSERT 行数 | 单位时间内执行插入次数 |
正在后台执行的 Merge 总量 | 正在合并中的线程数量 |
查询处理的线程总量 | 启动查询处理的线程数量 |
CPU 使用率 | 各节点的 CPU 使用率 |
CPU 一分钟负载 | 各节点分钟级的 CPU 负载 |
磁盘空间使用率 | 磁盘已使用的空间与规格最大可使用磁盘空间的比值 × 100% |
内存使用率 | 各节点的内存使用量 |
出网络流量速率 | 网卡发送数据速率 |
入网络流量速率 | 网卡接收数据速率 |
启用 Grafana 监控项
监控看板说明
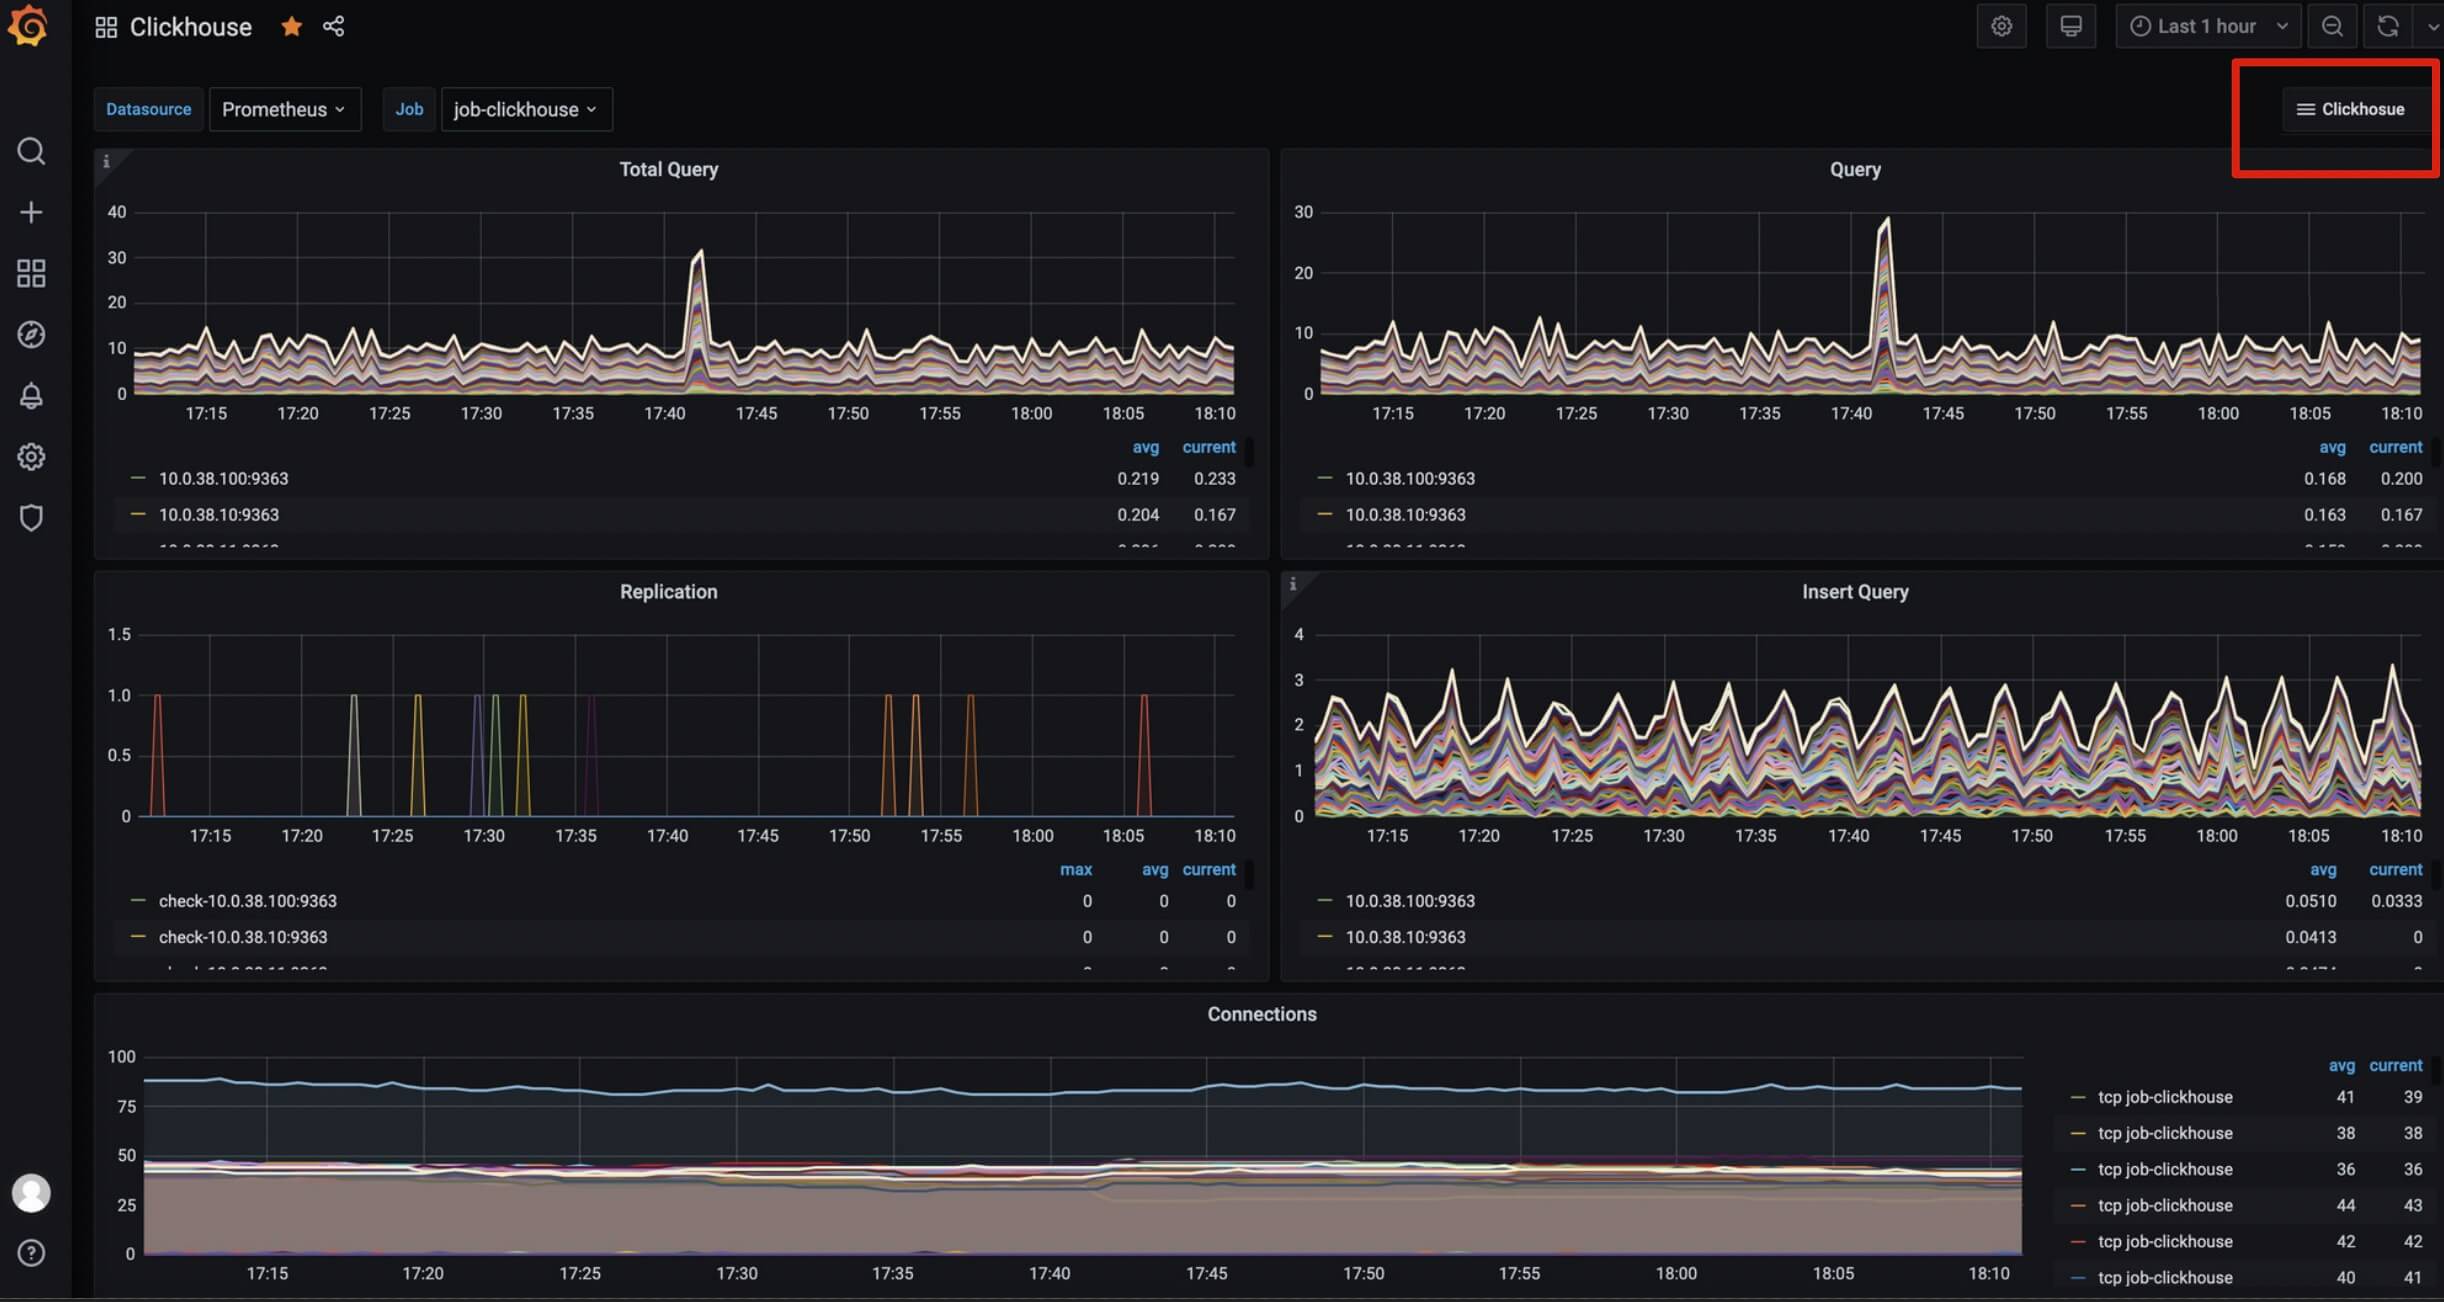
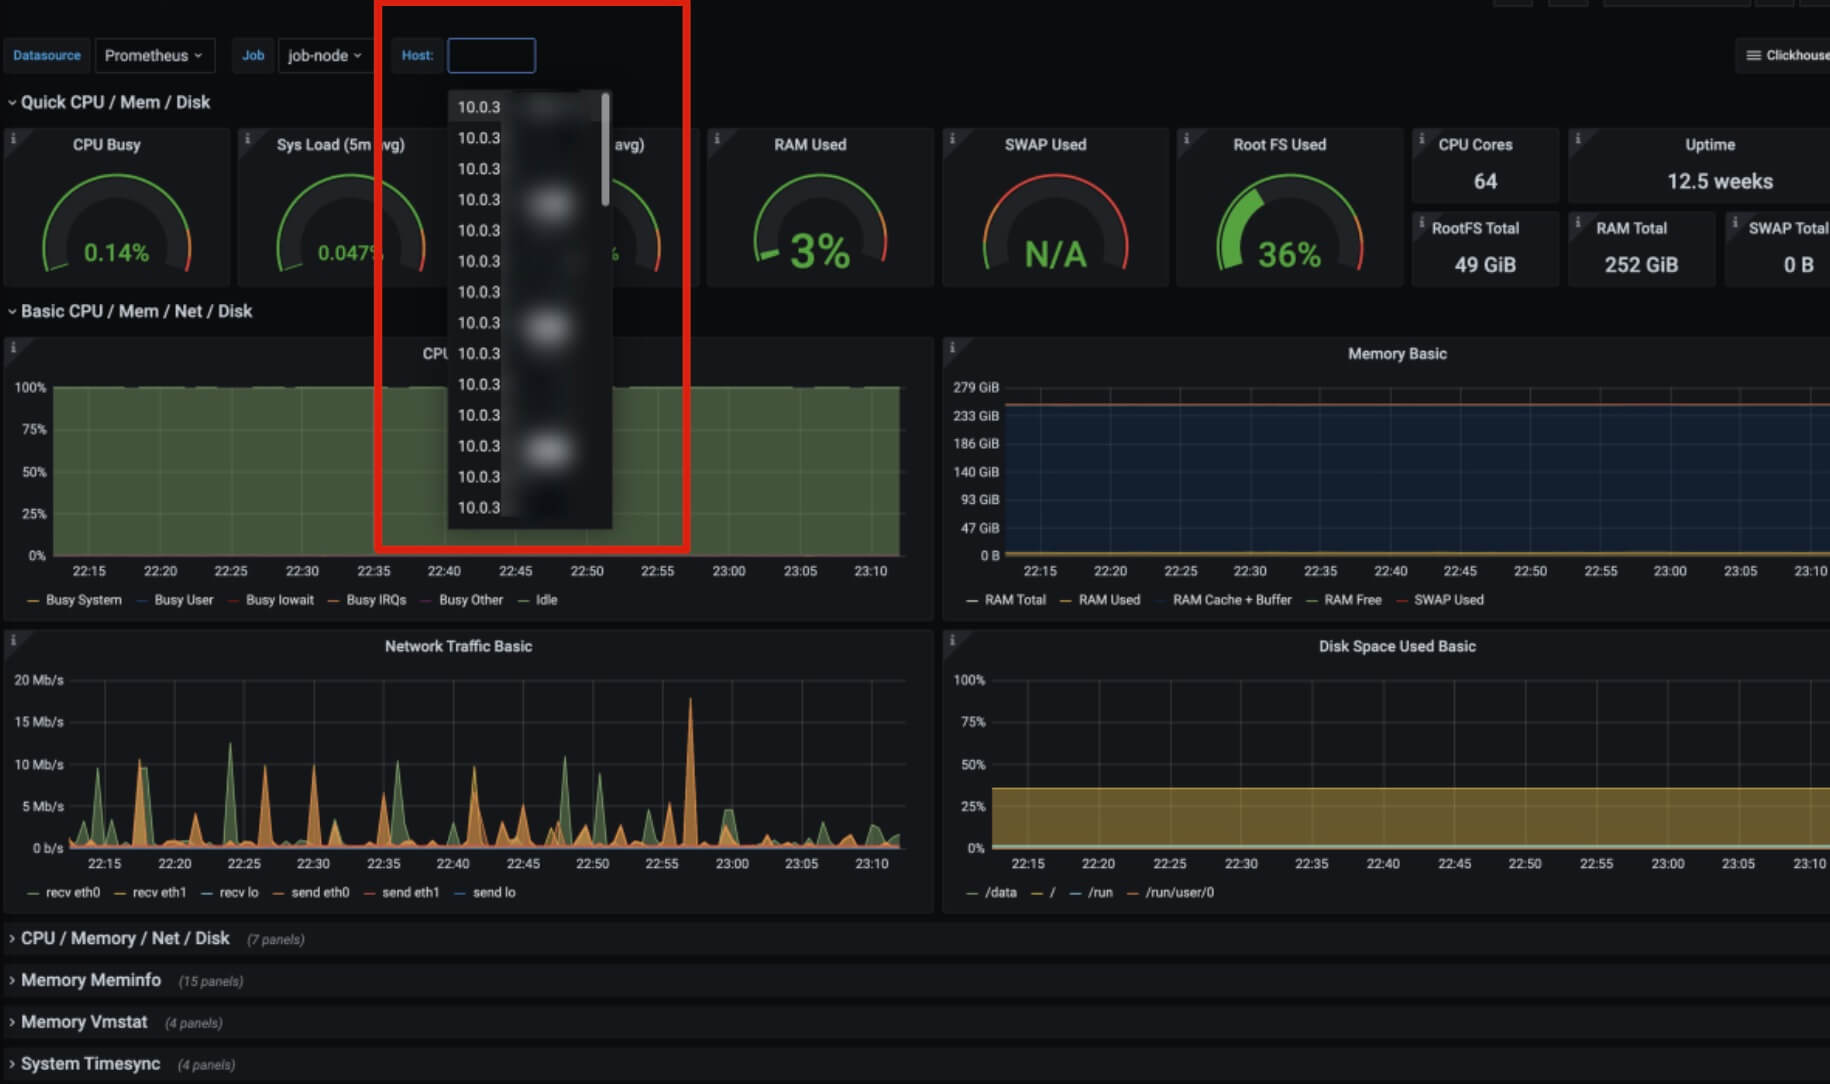
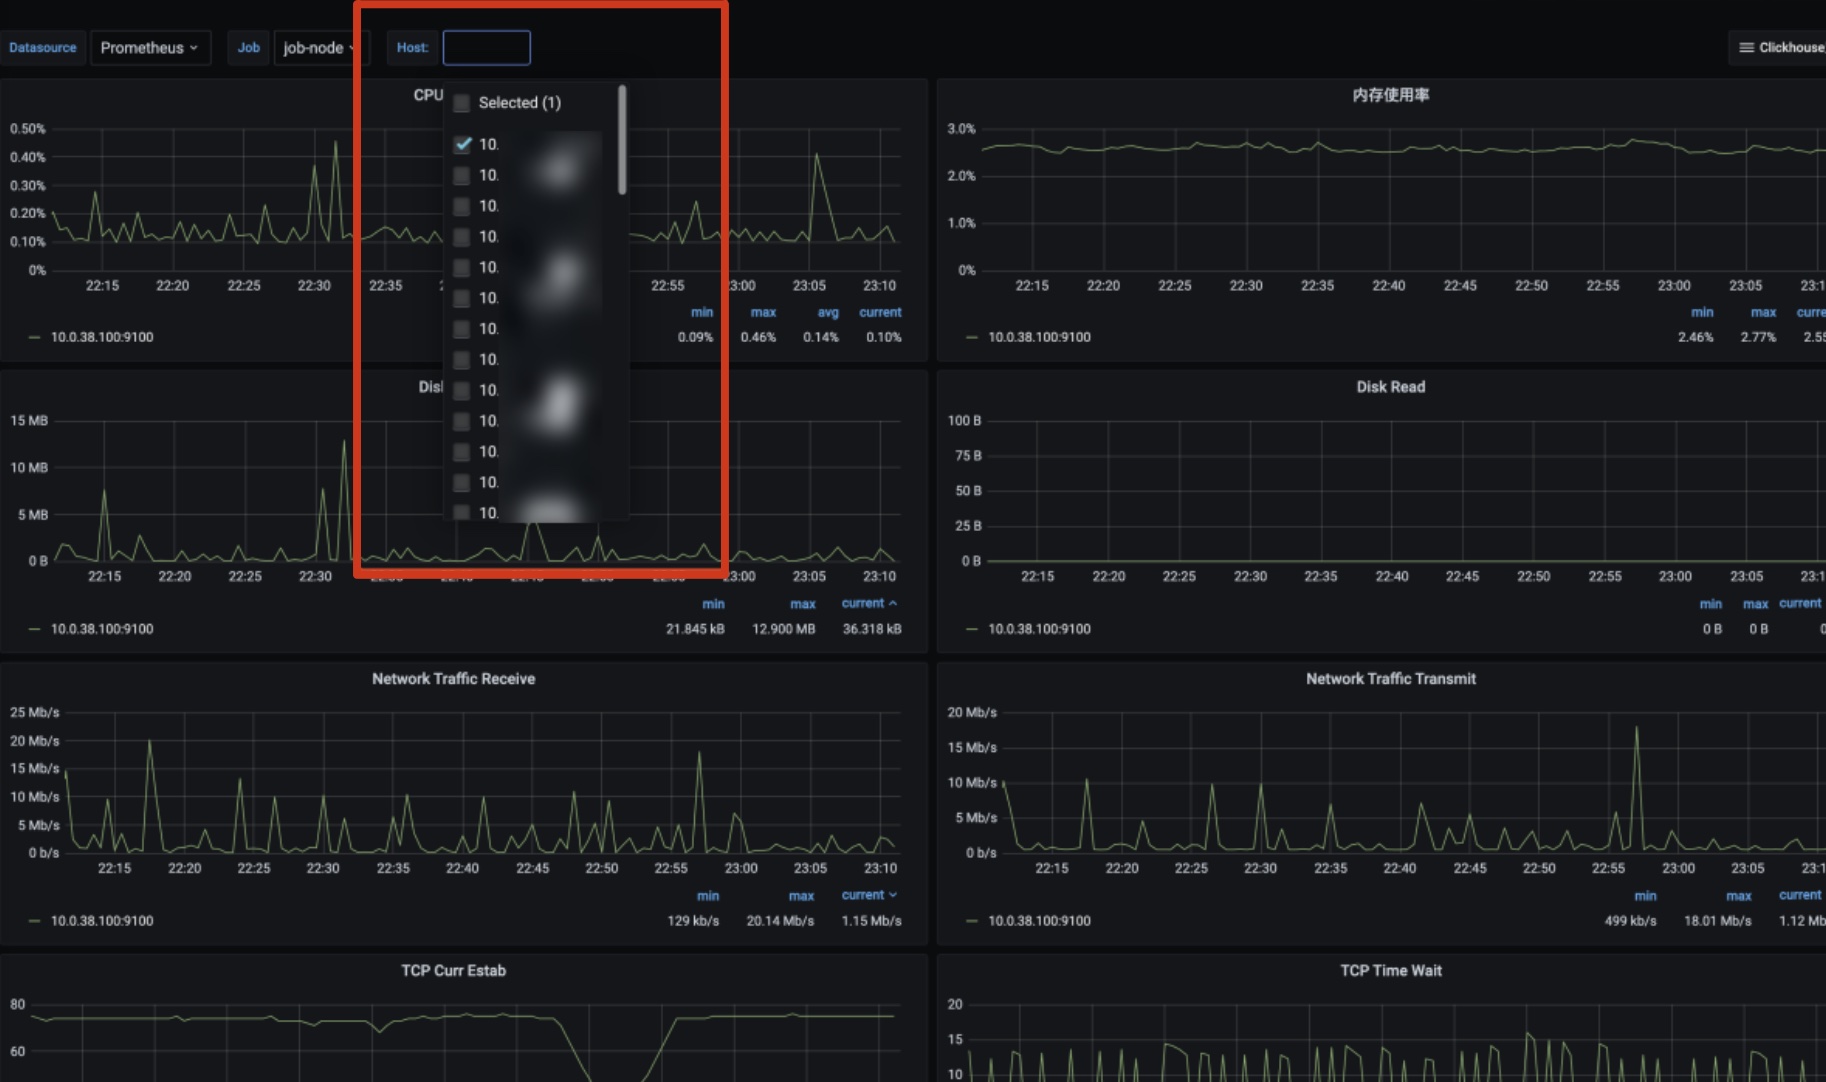
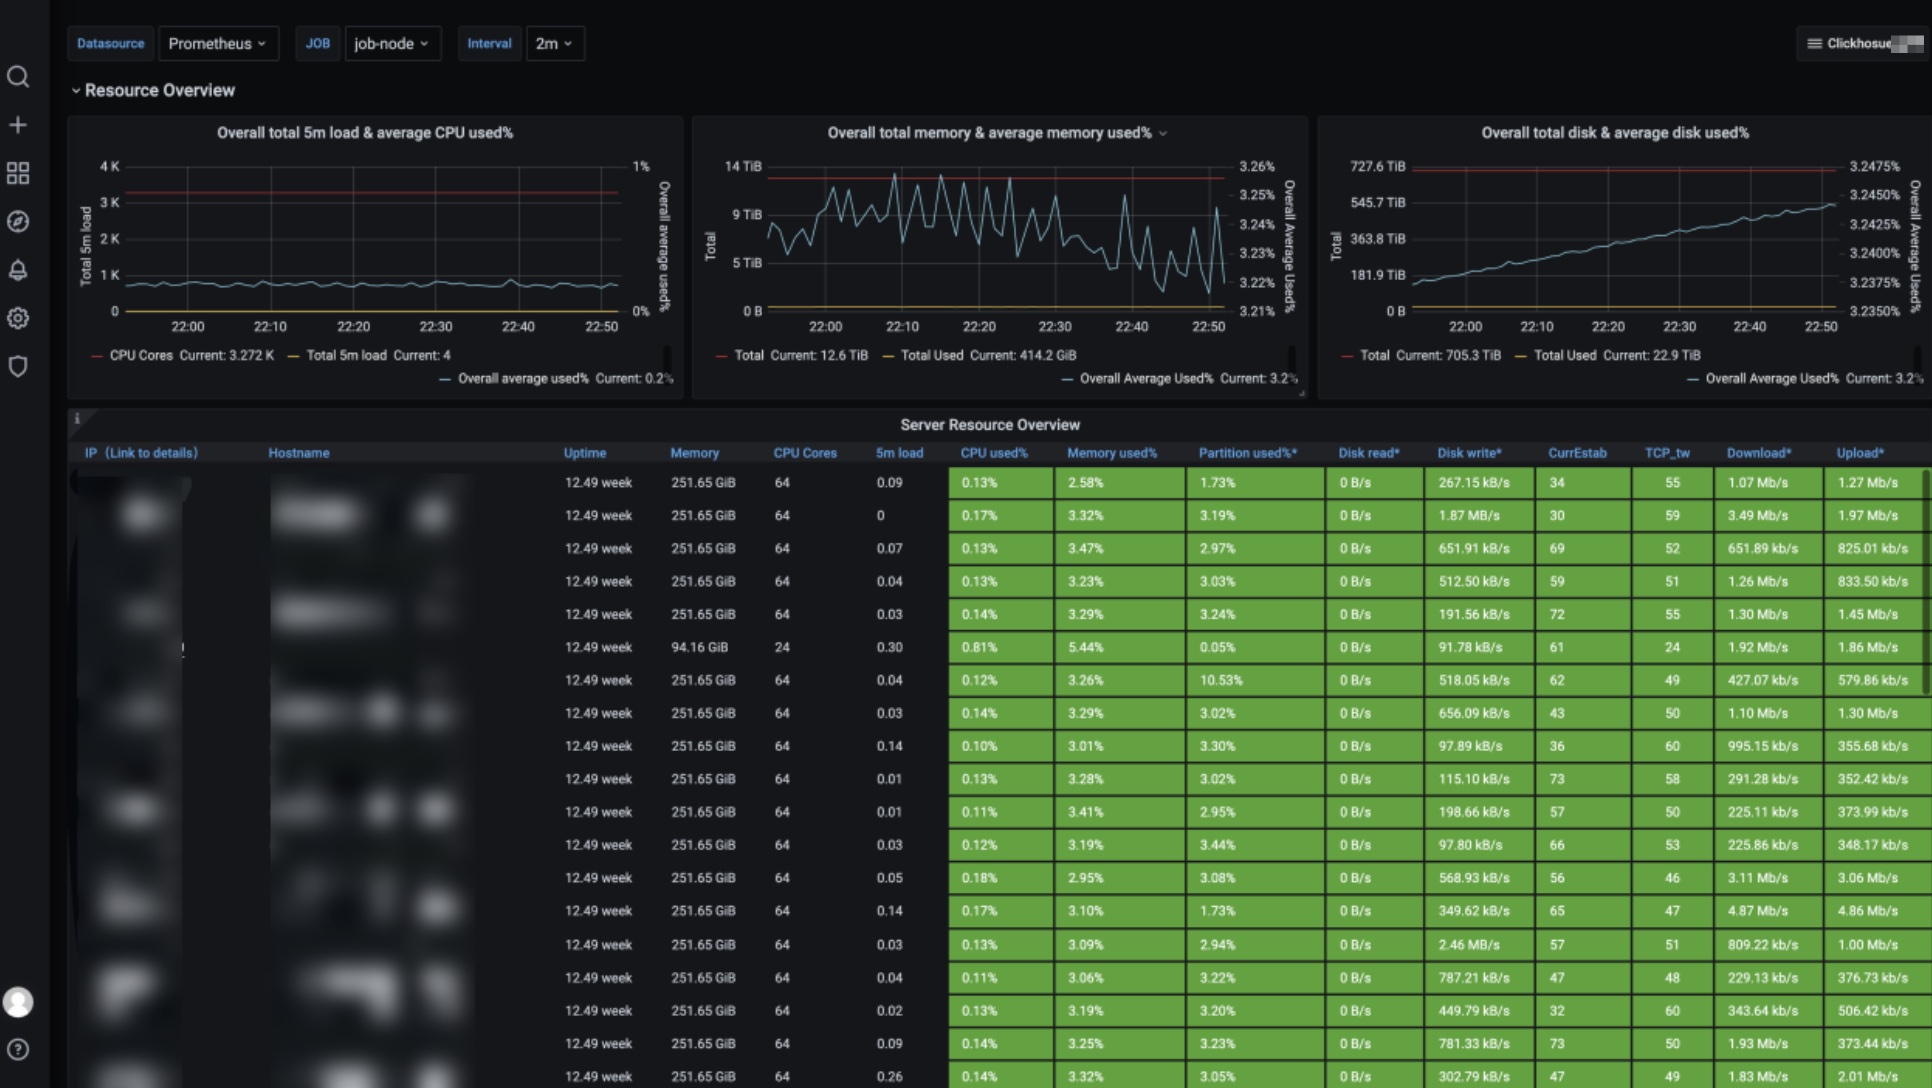
腾讯云数据仓库 TCHouse-C 集群监控信息共内置4个监控看板,用户也可按需配置个性化的监控看板。内置监控看板分别为 Clickhouse 集群看板、主机单节点详情、主机多节点详情和主机节点概览,下面针对每个看板的指标及公式进行详细说明。
Clickhouse 集群看板,详细说明见 指标项说明。单击右上角 Clickhouse 监控,可切换至集群的其他监控看板。
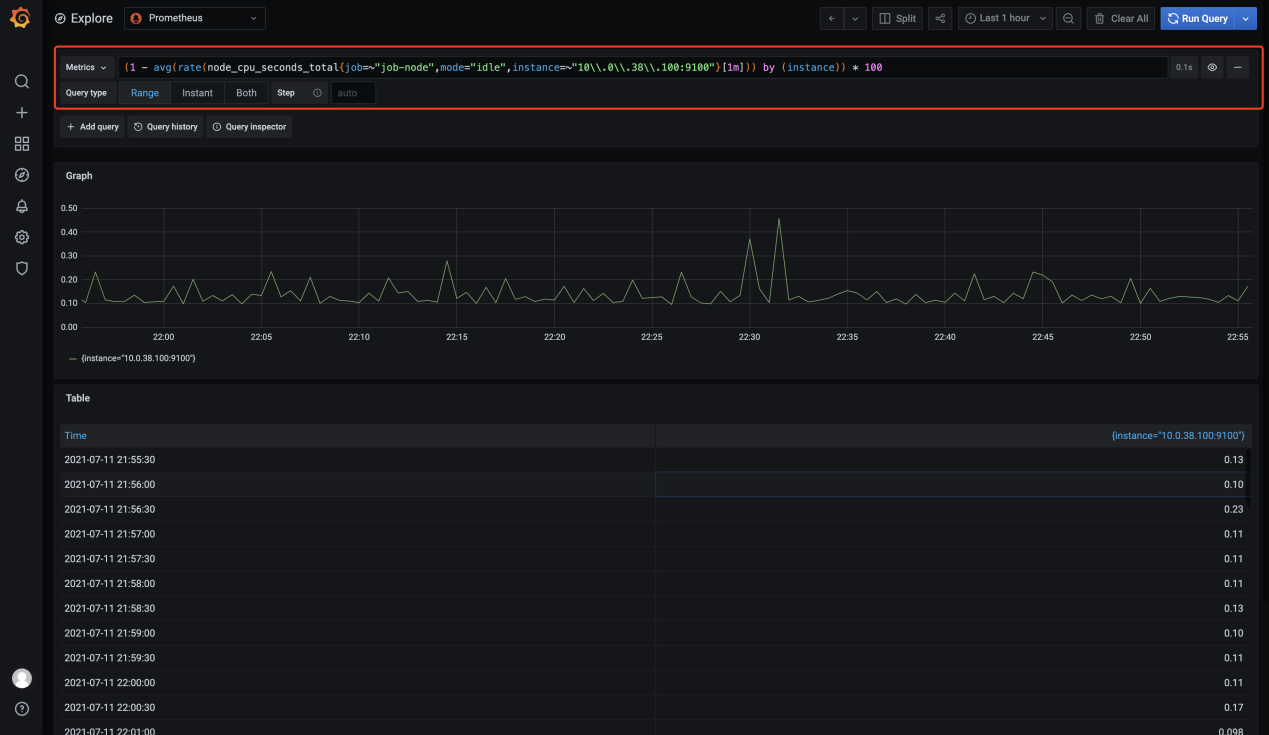
指标计算公式
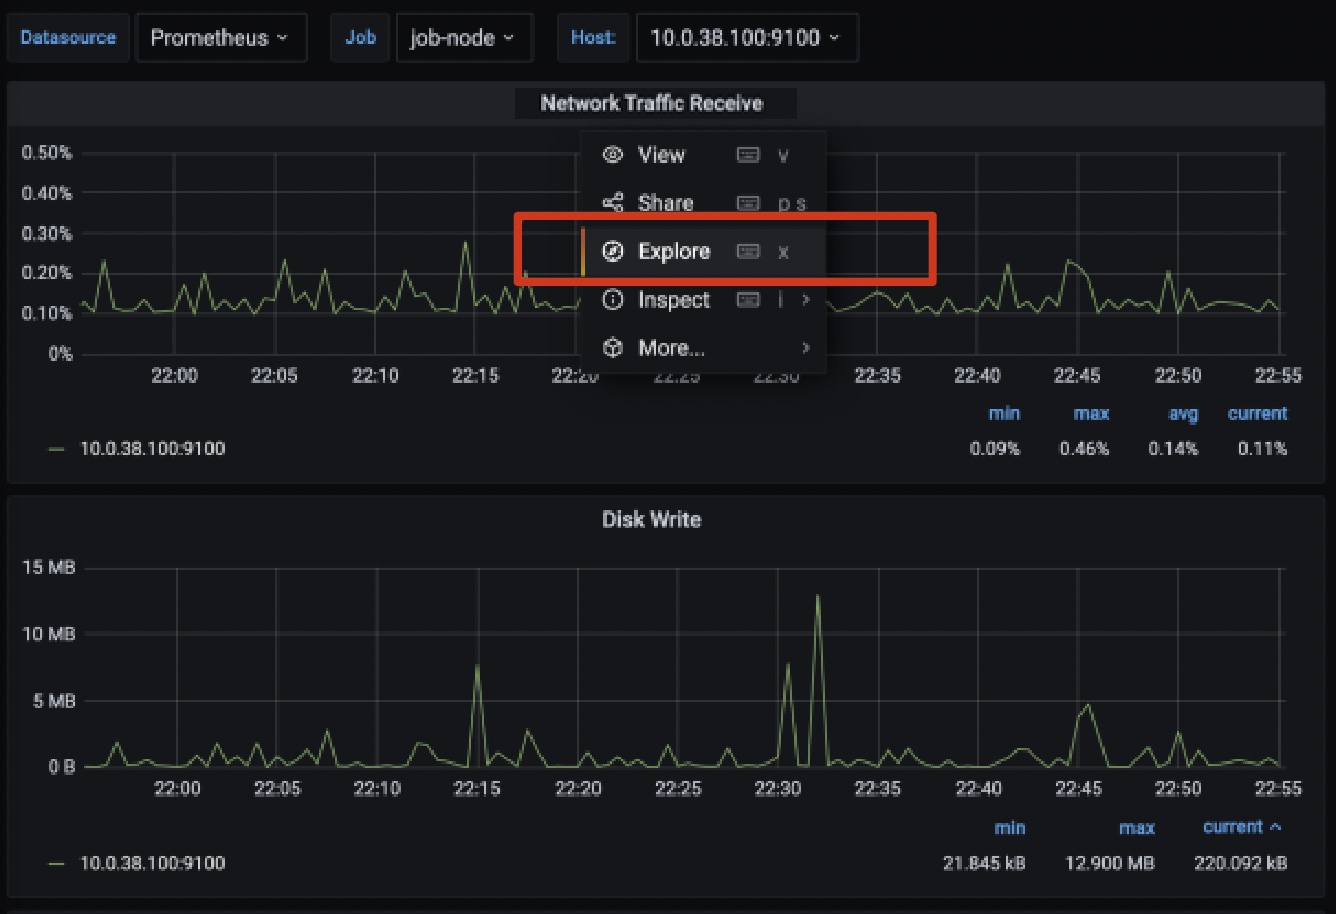
用户如果需要了解看板的某个指标的具体释义,可单击看板标题,在下拉菜单中选择 Explore。
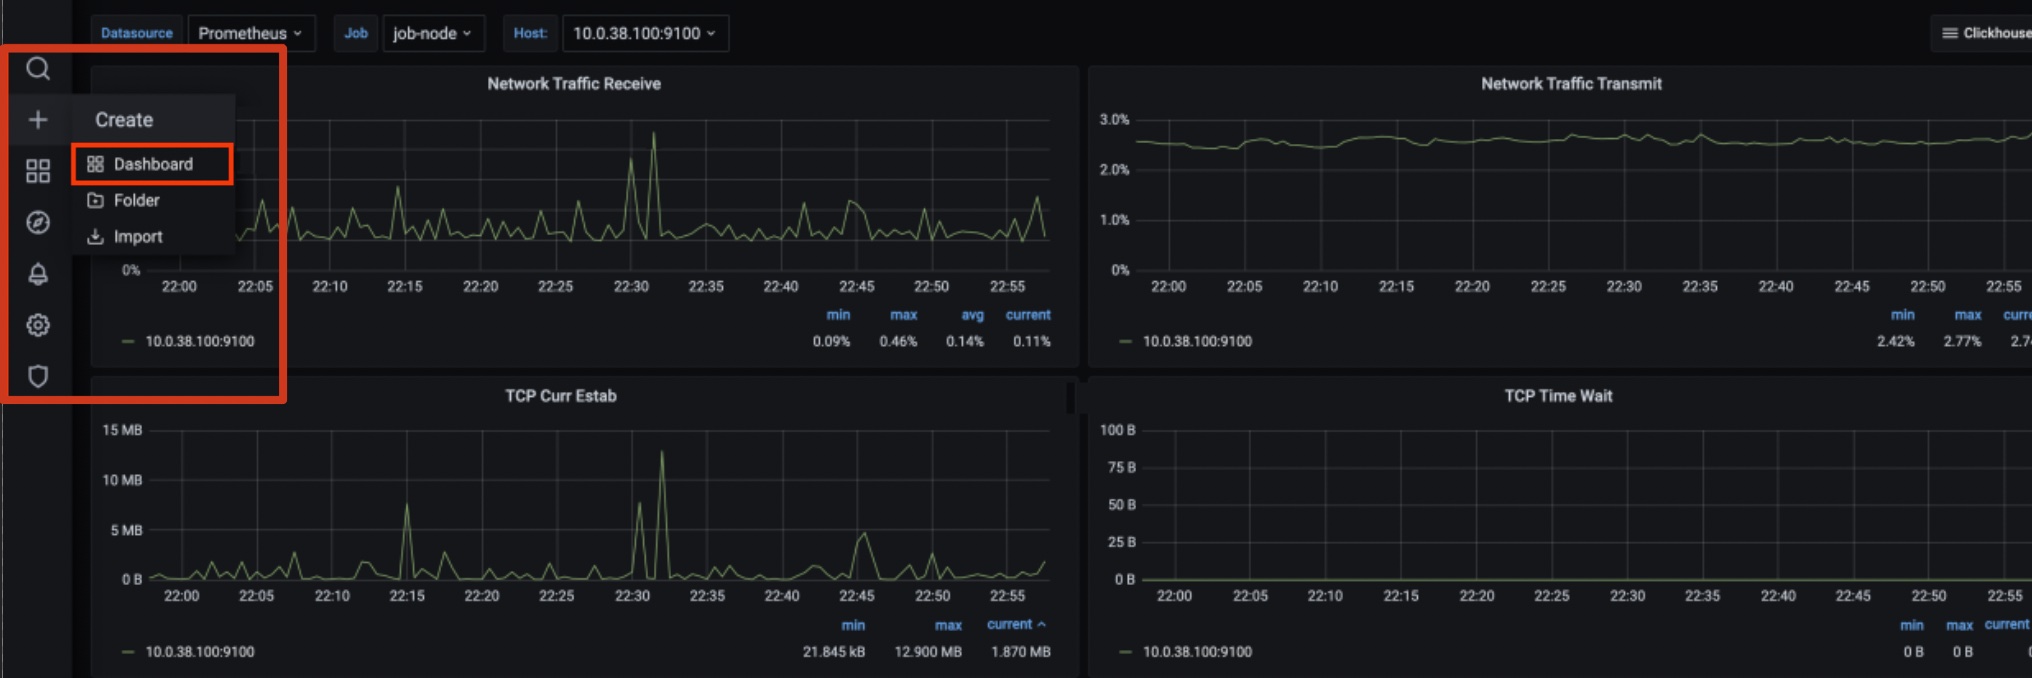
配置个性化指标看板
若现有看板不满足用户的使用习惯,可自行新建看板或者面板。
1. 在左侧菜单栏单击**+**,并在下拉菜单中单击 Dashboard。
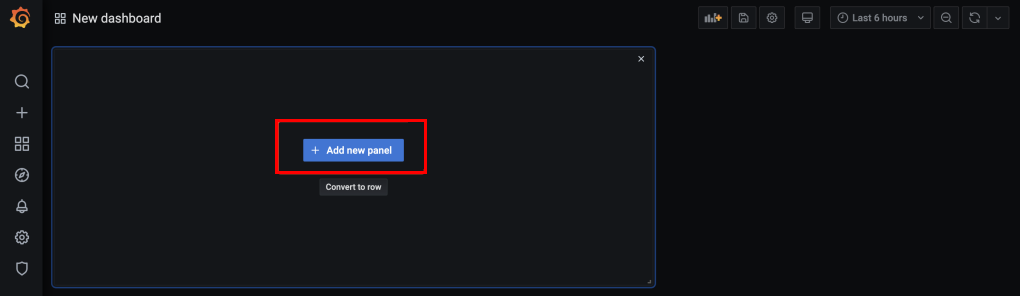
2. 然后单击+ Add new panel 新建看板。
3. 
4. 输入指标或者单击 Metrics 查看计算的指标。
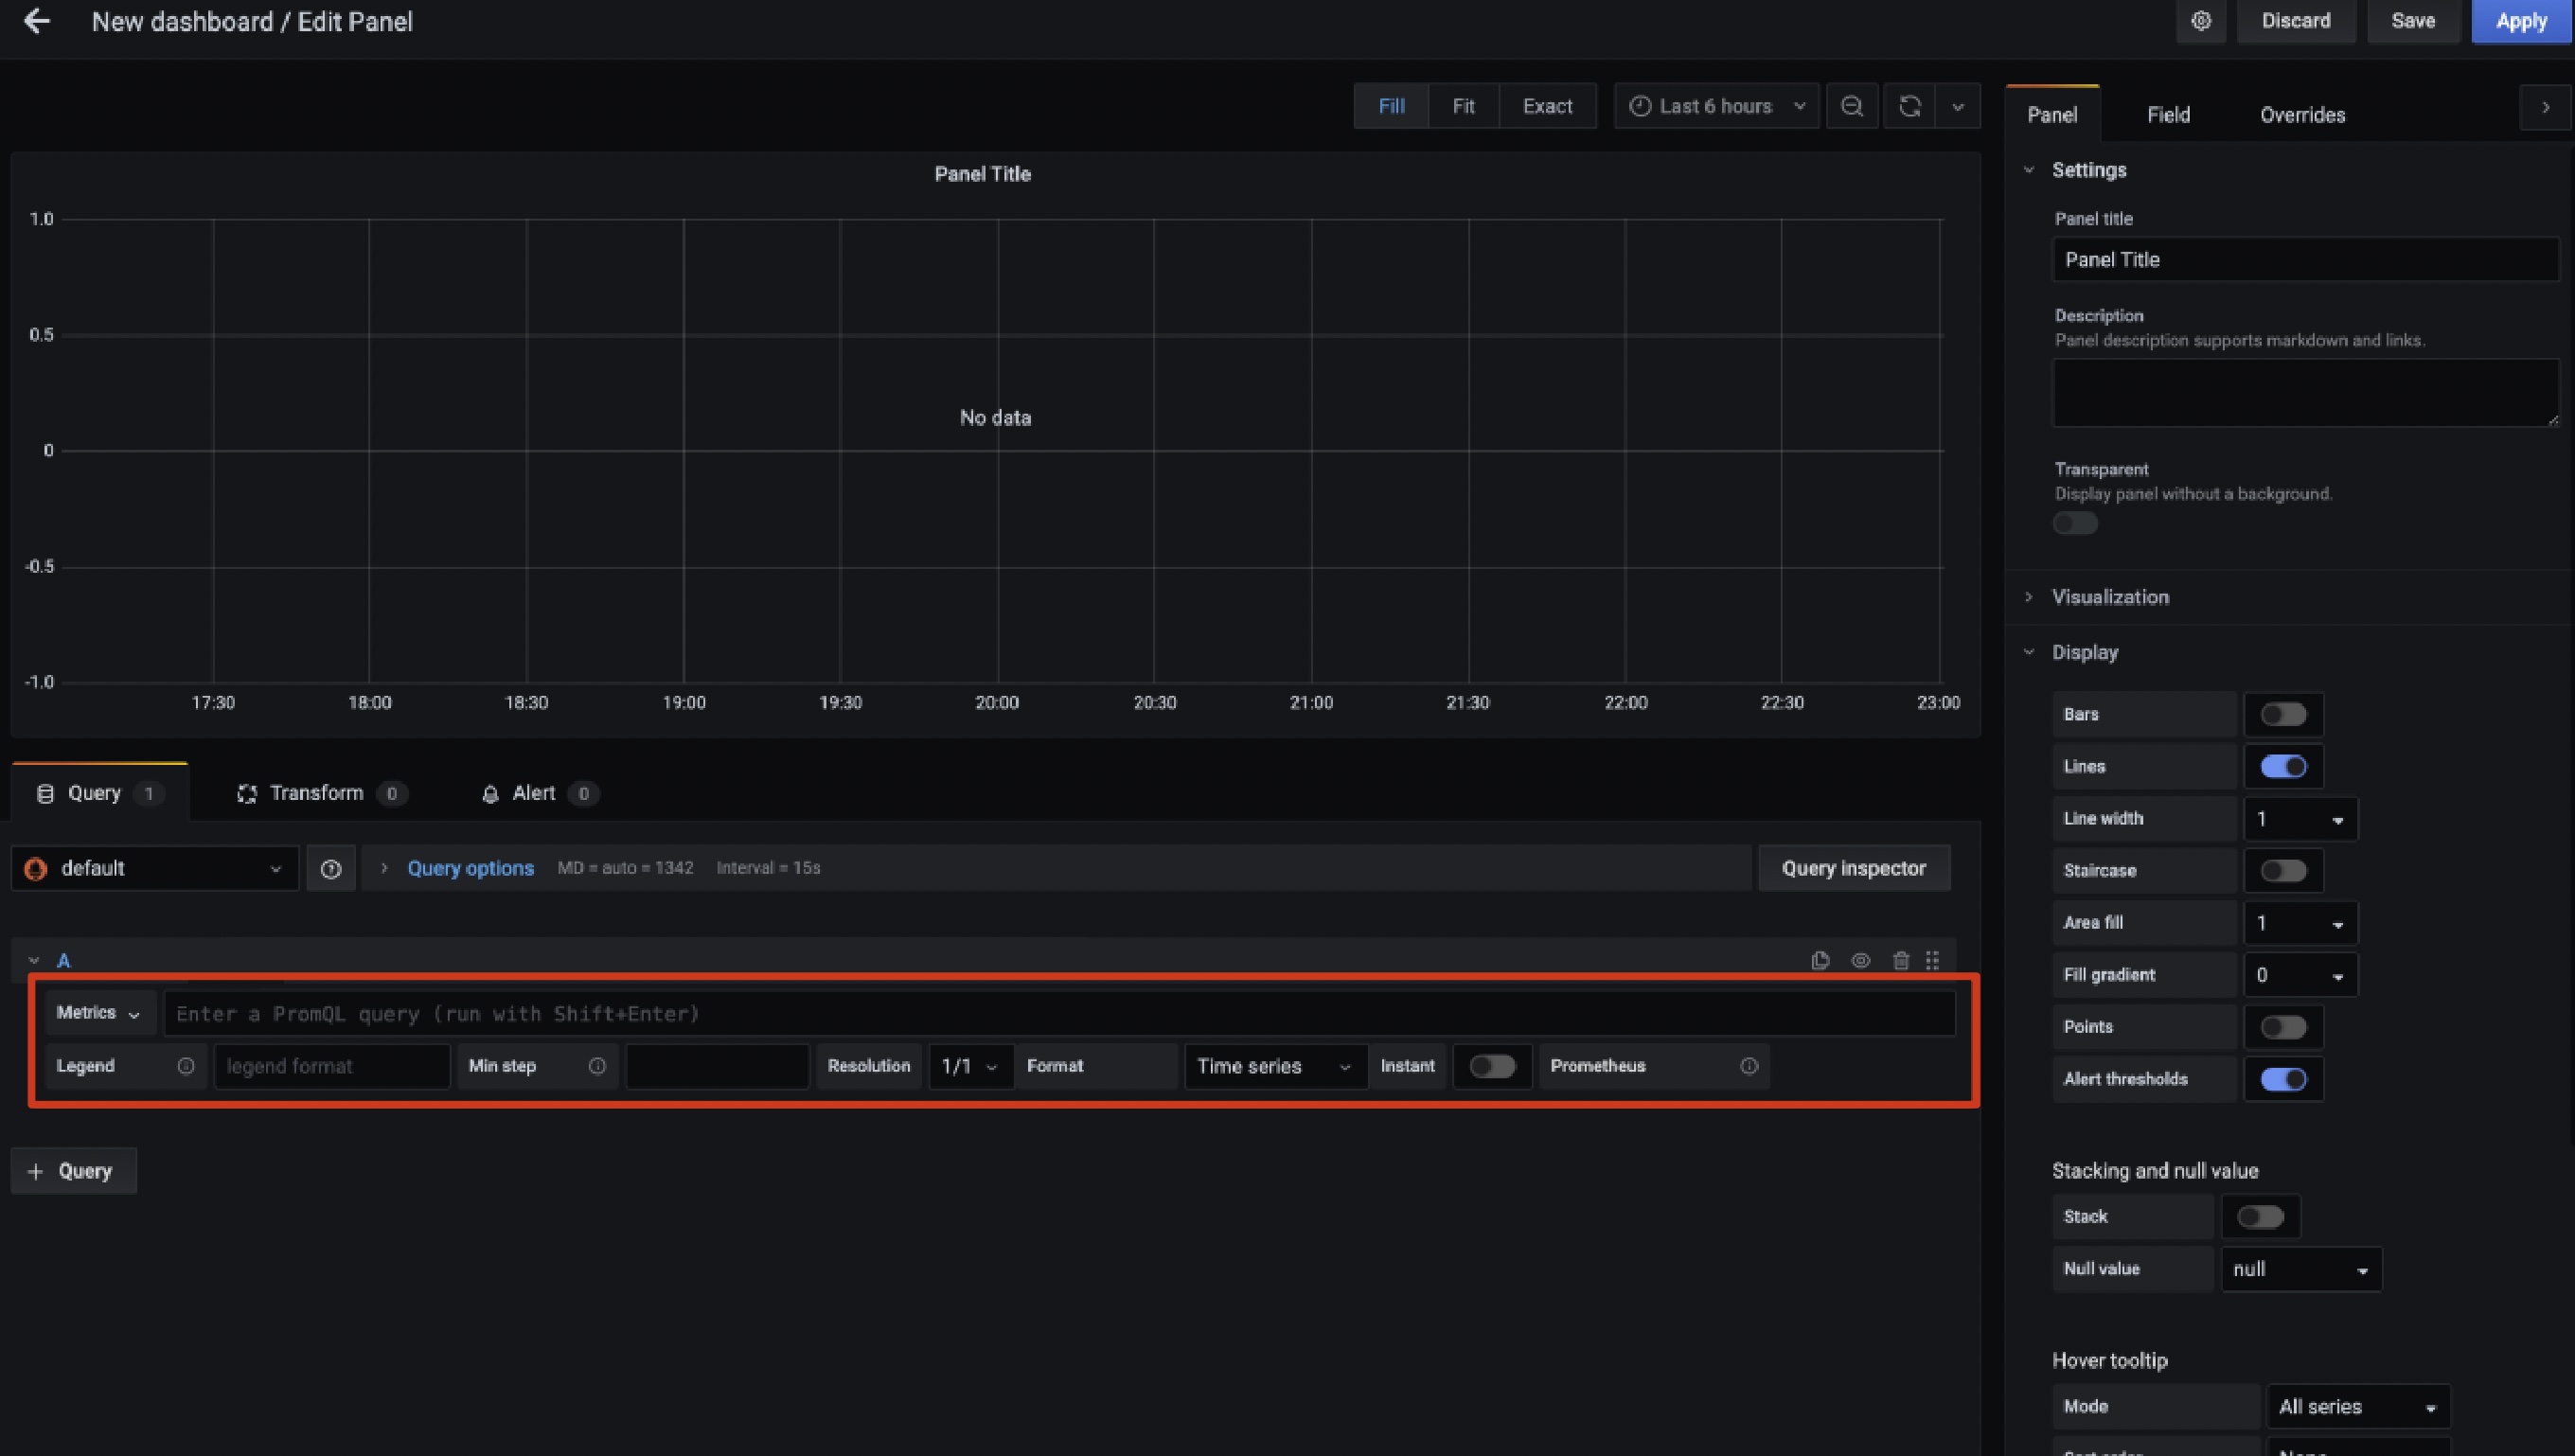
5. 右侧可以选择展示样式,具体可参见 Grafana 官网。
6. 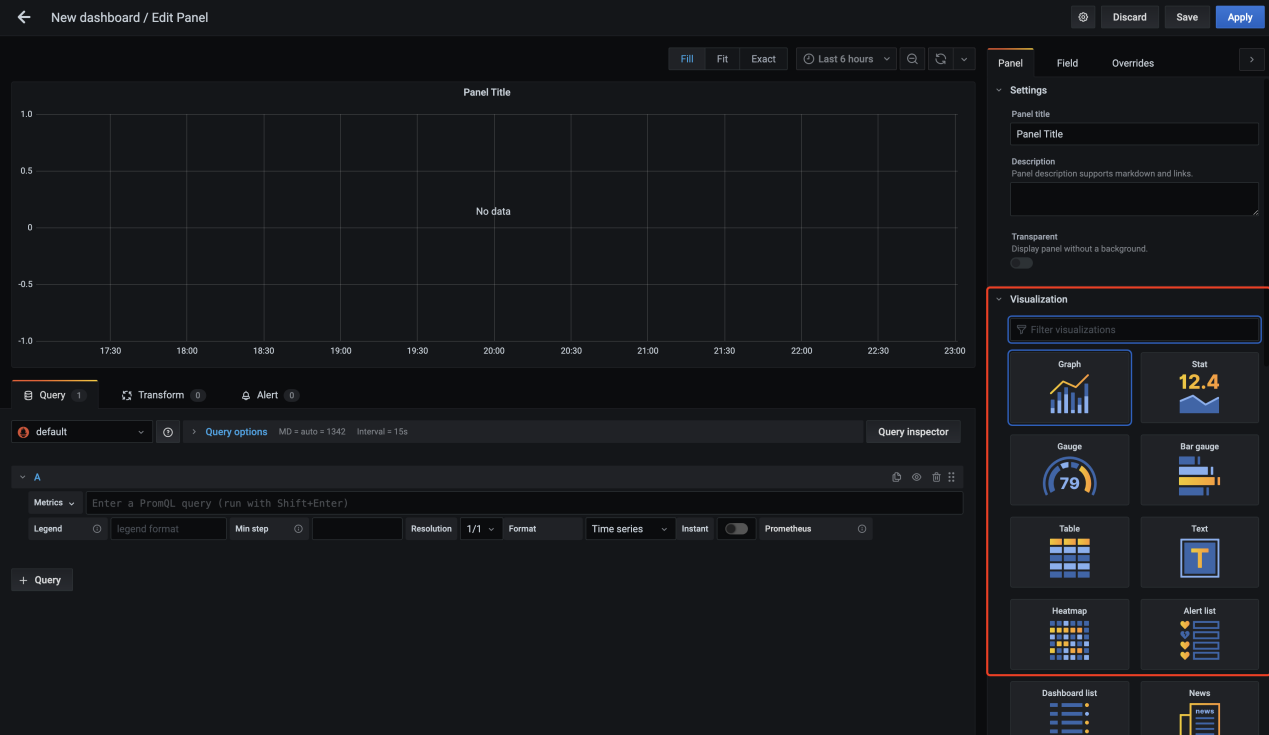
7. 单击右上角 Apply 即可完成看板的配置,最后单击 Save 保存看板。
指标项说明
指标名 | 释义 | 备注 |
Total Query | 单位时间内增删改查语句的执行次数 | - |
Query | 单位时间内执行查询次数 | - |
Replication | 单副本的发送、获取、检查的执行情况 | - |
Insert Query | 单位时间内执行插入次数 | - |
Connections | 各节点的连接数展示 | - |
Read/Write Syscalls | 各节点读写的系统调用次数 | - |
Number of Read/Write with a File Descriptor | 单位时间文件读写的句柄数及读写失败的句柄数 | - |
Bytes of Read/Write with a File Descriptor | 单位时间文件读写的大小 | - |
Cache Rate | 缓存命中几率及未命中几率 | 体现业务的重复查询情况 |
Selected Ranges | 查询命中索引的个数,匹配某个命中 SQL 的查询数据量 | - |
Selected Marks | 查询命中索引的个数,匹配某个 SQL 的查询数据量,粒度更细 | - |
Merge1 | 正在合并中的线程数量 | num of Merge 的个数不能设置太大,Merge Rate 太大,说明导入每批次数据量太小,数据比较集中,part 文件目录成正比 |
Merge2 | 正在合并中的 MergedRows 数量 | - |
Merges Time | 反应压缩消耗时间(速率) | 跟压缩的数据量有关 |
Parts of ReplicatedMergeTree Merged | 单位时间内的 Replicated Part 合并数 | - |
Mutations | 单位时间内的 Replicated Part 变化次数 | - |
Pool Tasks | 后台执行的任务数 | - |
Open Files | 单位时间内打开的文件数 | - |
Compressed Read Buffer | 单位时间内使用的压缩读缓存大小 | - |
Memory | 各节点的内存使用大小 | - |
文档反馈