Usage statistics
Download
Mode fokus
Ukuran font
Feature Overview
The Usage Statistics page helps you comprehensively monitor AI resource consumption and provides two core capabilities:
Usage Ranking (Language Models Only): It aggregates total Token consumption and provides Top rankings by service, model, and API Key dimensions, and supports downloading detailed data.
Usage Trend: It displays the trends of various usage metrics over time in charts and supports filtering by multiple dimensions, including model, service, and API Key.
Usage Ranking
Note:
The Usage Ranking feature is currently available only under the Language Model tab. Vision models and multimodal understanding are not yet supported.
It provides total aggregation and Top rankings for language model Token consumption by service / model / API Key dimensions, helping you quickly identify the highest-consumption resources and locate abnormal usage.
Statistics Dimensions
Go to the Language Model > Usage Ranking tab. You can then switch between the following statistical dimensions in the drop-down list in the upper-left corner:
Dimension | Description | Typical Use Case |
By Service | Summarize Token consumption by online inference service | Identify which inference service has the highest usage. |
By Model | Summarize Token consumption by model ID | Compare the usage share of different models |
By Key | Summarize Token consumption by API Key | Locate high-consumption keys and perform accounting by business line. |
Time Range and Granularity
Time Range: It supports 1 hour, Today, Last 3 days, Last 7 days, Last 30 days, or a custom start and end time.
Time Granularity: It supports aggregating trend data at a specified granularity (such as 1 hour).
Display Content
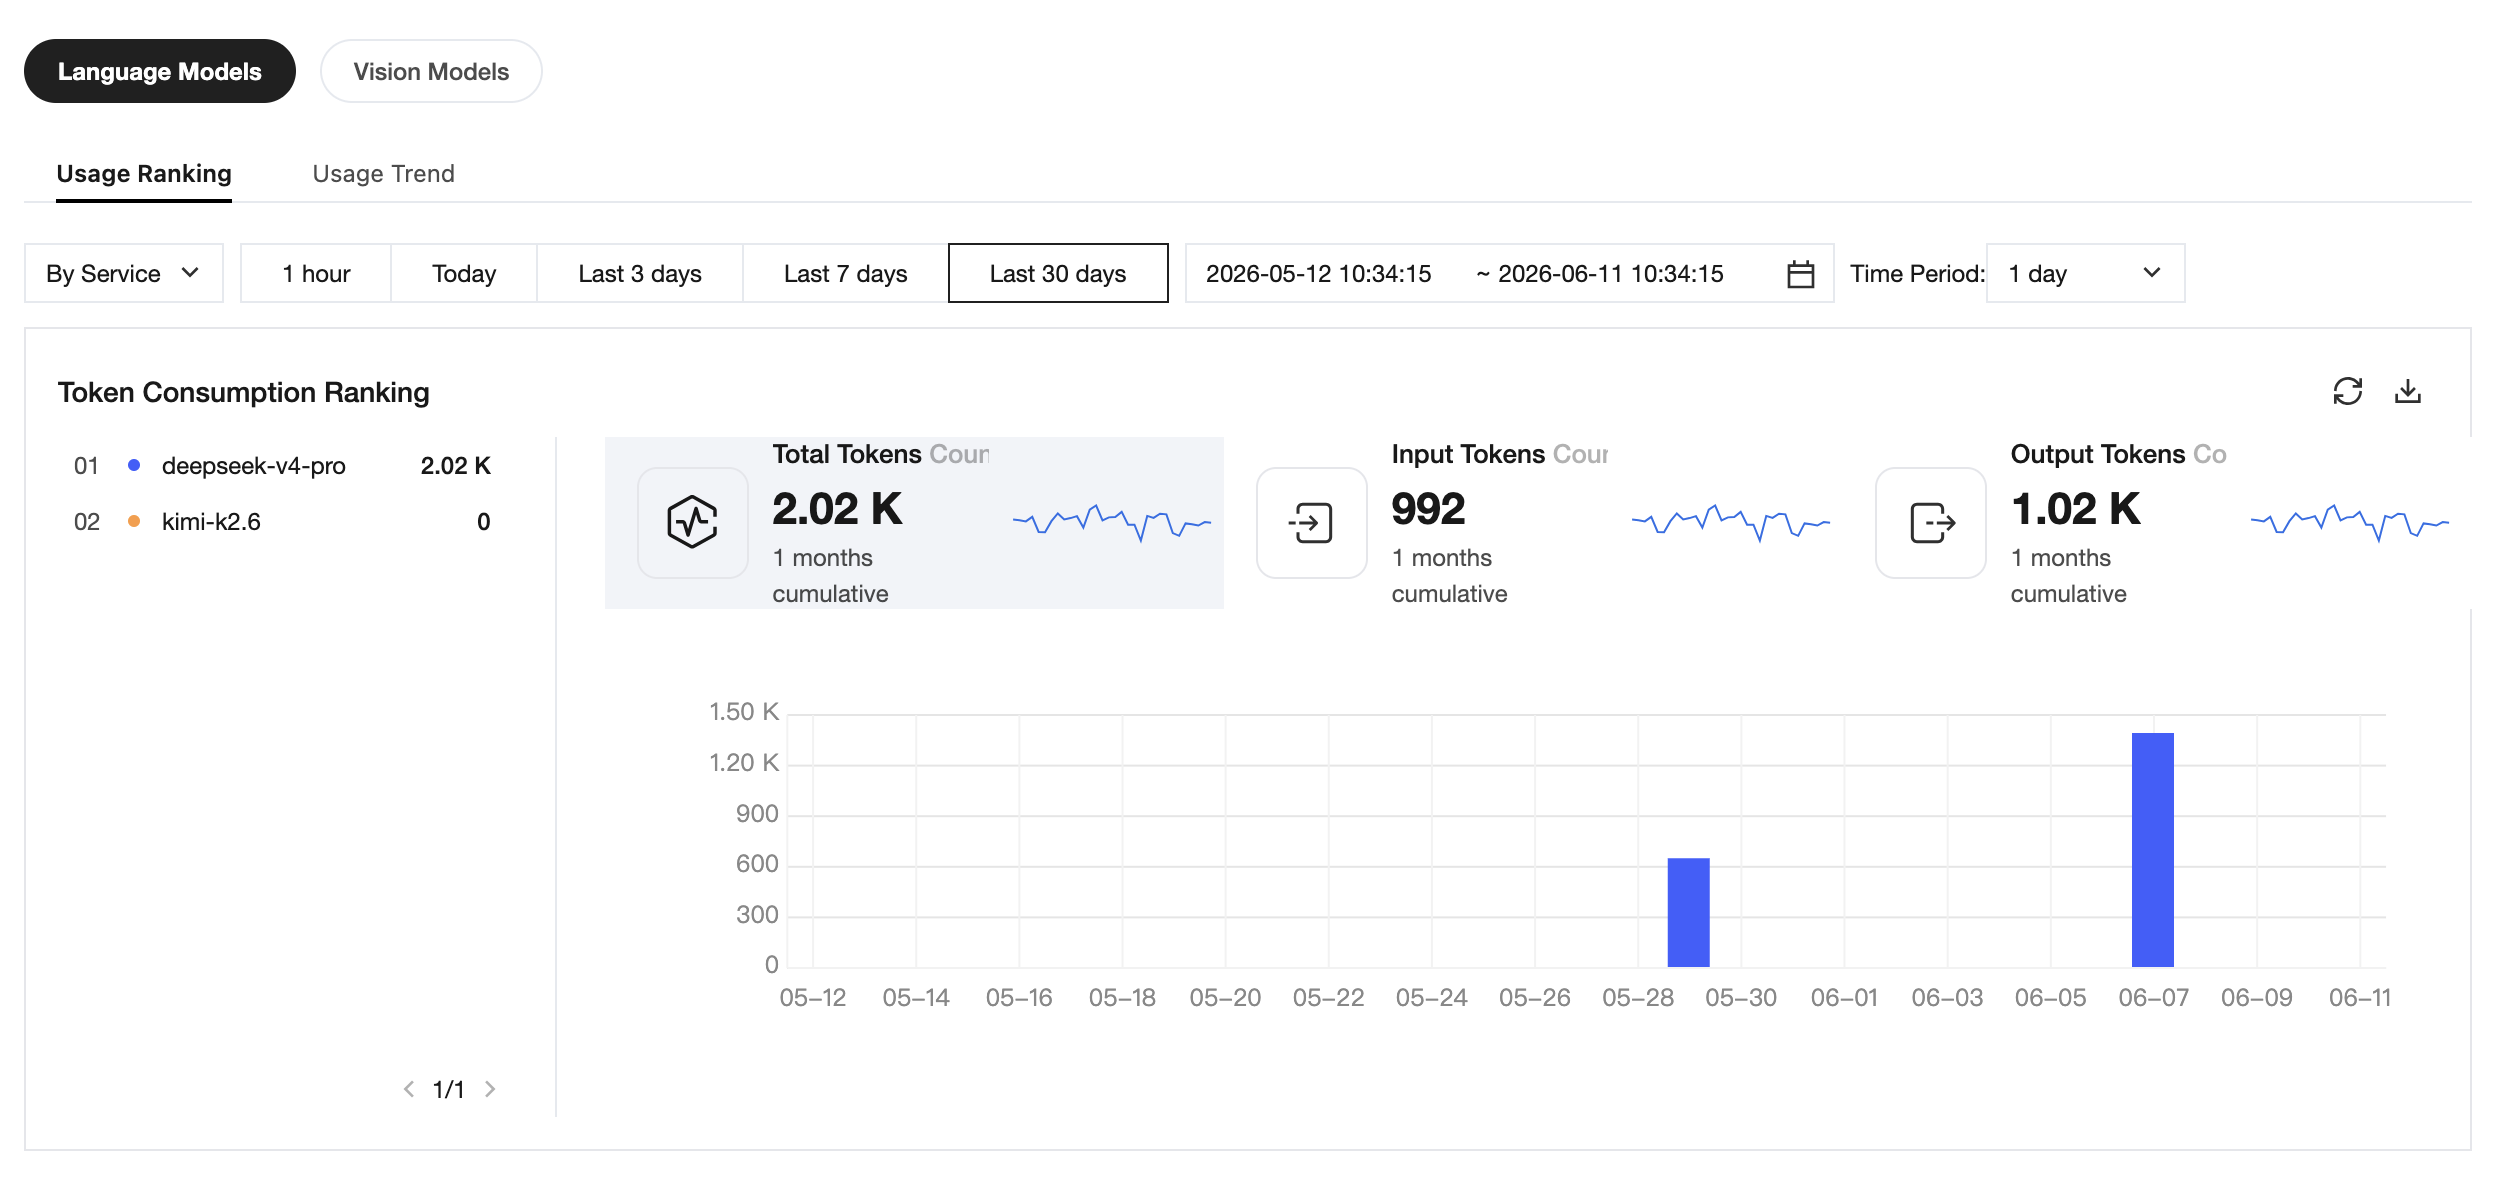
The page simultaneously displays the following three types of information:
Total Card: The total of Total Tokens Consumed, Input Tokens, and Output Tokens within the selected time range.
Ranking List: The list on the left displays the Top resources under the selected dimension, including the resource name and total number of Tokens.
Trend Chart: The bar chart on the right displays the consumption distribution of each resource across different time intervals at a specified time granularity, helping to identify peak usage periods.
Downloading Detailed Data
A download entry is provided in the upper-right corner of the ranking list. Click the download icon to export the detailed ranking data under the current query conditions as a local file, facilitating further reconciliation or offline analysis.
Usage Trend
Aggregate call data by model dimension, supporting categorized views by model type.
Filter by category
The top of the page provides filter tabs for quick categorization by model type, while supporting filtering by Online Inference Service and API Key to view specific service usage.
Model Type | include model |
Text generation | DeepSeek V4, GLM-5, kimi-k2.5, MiniMax-M2.5, and others |
Metric Details
Key call metrics for each model within the selected time range, with supported granularities of 1 minute / 5 minutes / 1 hour:
Field | Model Type | Description |
Total Tokens | Text generation | Input number of Tokens + Output number of Tokens. |
Input Tokens | | Number of Tokens consumed by the request (Prompt) portion, including cache. |
Output Tokens | | Number of Tokens consumed by the model response (Completion) portion. |
Total Tokens per Minute | | Input number of Tokens per minute + Output number of Tokens per minute. |
Input Tokens per Minute | | Input-side Token throughput (measured in tokens/min). |
Output Tokens per Minute | | Output-side Token throughput (measured in tokens/min). |
Number of cache read tokens | | Number of Tokens that hit the cache within a unit of time. |
Number of cache write tokens | | Number of Tokens for which cache is created within a unit of time (supported by some models). |
Time | All models | Time range of the request. |
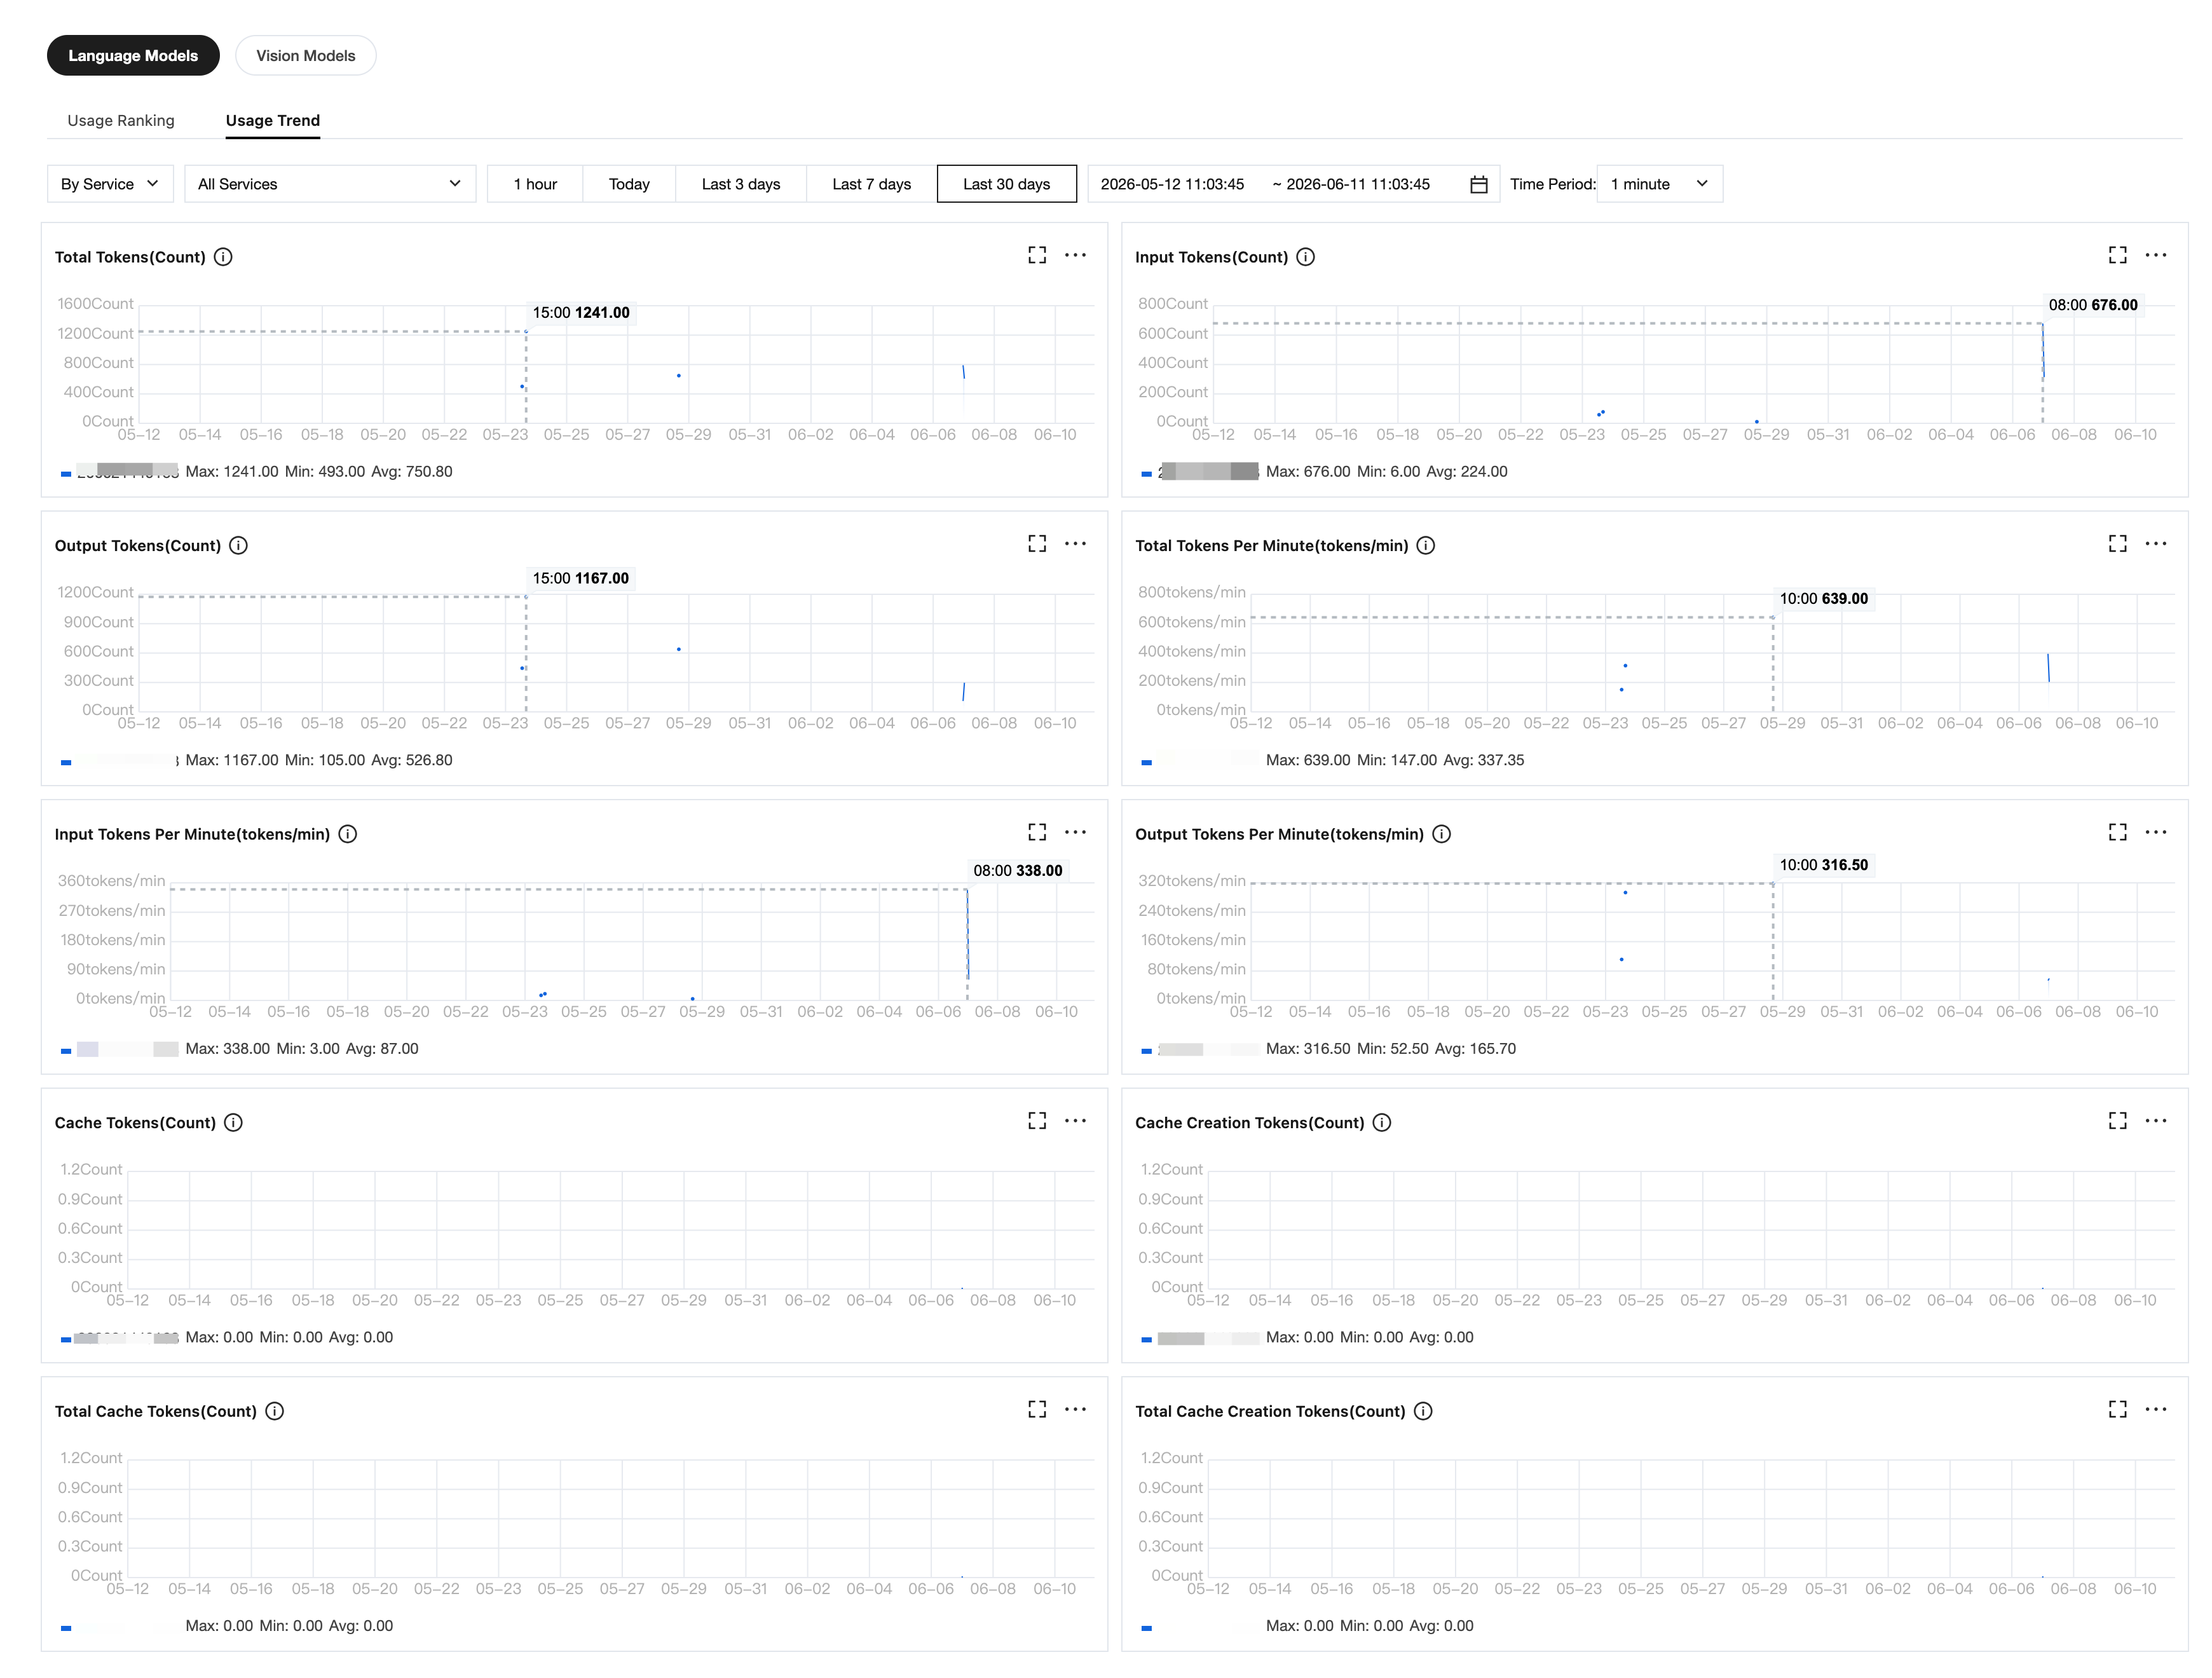
Usage Trend Chart
Visual charts display call trends, with each metric providing maximum, minimum, and average statistical summaries to help users quickly identify peak usage and overall trends.
Text Generation
Providing trend monitoring across six Token dimensions:
Token Consumption Trends: Total number of Tokens / Input number of Tokens / Output number of Tokens over Time
Token Throughput Trends: Total Tokens per Minute / Input Tokens per Minute / Output Tokens per Minute - Concurrency Variations
Bantuan dan Dukungan
Apakah halaman ini membantu?
Anda juga dapat Menghubungi Penjualan atau Mengirimkan Tiket untuk meminta bantuan.
masukan