Monitoring and Alarms
Unduh
Mode fokus
Ukuran font
You can configure alarms for the usage and performance metrics displayed by TokenHub in the console through TCOP to promptly detect situations such as Token surges, latency degradation, and rate limiting exceptions, ensuring the stable operation of your online inference service.
Note:
Alarms are only effective for metrics that have been collected by the TokenHub console. Alarms are not supported for metrics that are not exposed in usage statistics or model monitoring. Currently, alarm configuration is only supported for text generation models.
Alarm View
TokenHub has been integrated with TCOP. The steps to create an alarm view are as follows:
1. In Alarm Management > Alarm Configuration, choose the Alarm Policy tab.
2. Click Create Policy, and then select Custom Alarm Policy.
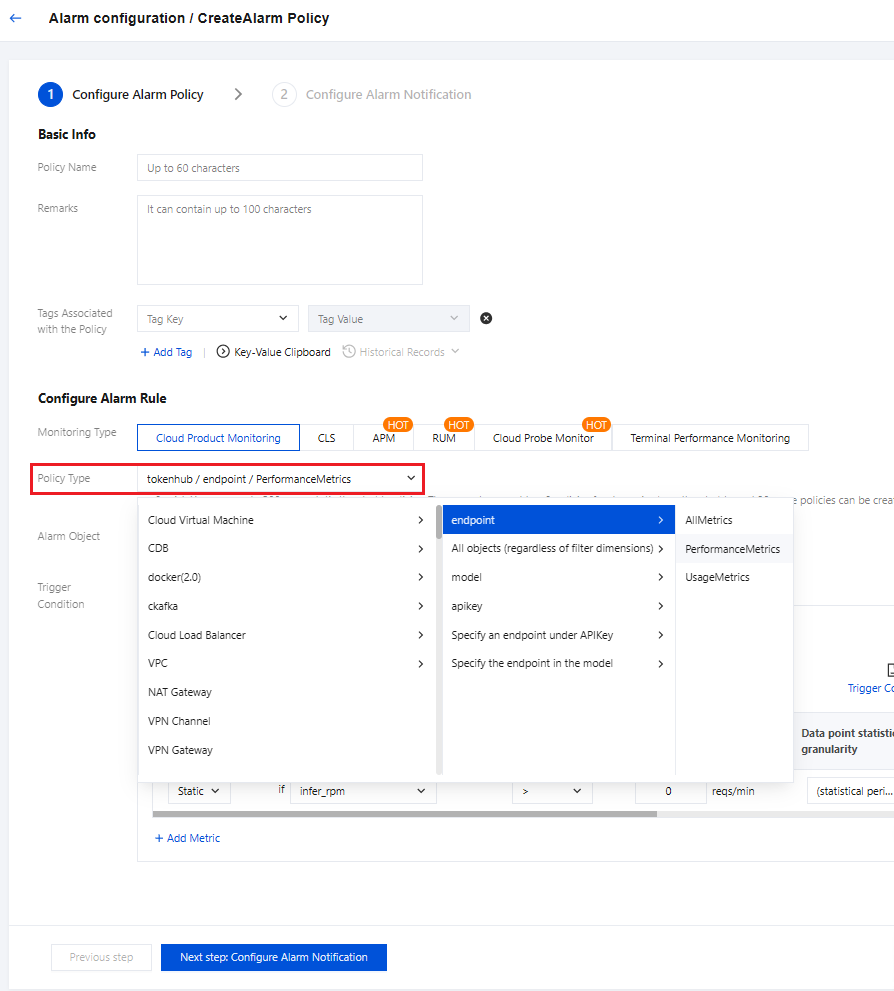
3. In Create Alarm Policy, select tokenhub from the Policy Type drop-down list to configure alarm policies for operational metrics.
The secondary menu under the policy type tokenhub provides six alarm views, which correspond to the filtering dimensions in the console. Each view is further subdivided into two policy subcategories: Usage Metrics and Performance Metrics. These subcategories correspond to the metric sets on the usage statistics page and the model monitoring page respectively. You can select the corresponding view based on the object you want to monitor.
Alarm View | Console Filter Dimension | Use Cases |
Endpoint | Corresponds to the Model Monitoring page, aggregated by service. | Monitor the overall metrics of a single online inference service and configure alarms. |
Model | Corresponds to the Model Monitoring page, aggregated by model. | Monitor the metrics of a single model across all services and configure alarms. |
APIKey | Corresponds to the Usage Statistics > Usage Trends page, aggregates all services by API Key. | Monitor the usage and performance of a Key by business line / sub-account, covering all services. |
Service under a specific API Key | Corresponds to the Usage Statistics > Usage Trends page, filtered by API Key × Service (secondary filter). | When a single Key invokes multiple services, distinguish the monitoring alarms for a specific service. |
Service under a specific model | Corresponds to the Usage Statistics > Usage Trends page, filtered by Model × Service (secondary filter). | When a single model is deployed across multiple services, distinguish the monitoring alarms for a specific service. |
All objects | All monitored objects of the current account (Uin dimension) | Monitor the total amount at the account level, for example, the total Token consumption under this Uin. |
Note:
"Service under APIKey" and "Service under Model" correspond to the two-level dropdown linkage in the console.
Alarm Metric Description
Usage Metrics: These metrics refer to Usage Statistics and include total tokens, input/output tokens, tokens per minute (TPM), cache read/write tokens, and so on.
Performance Metrics: These metrics refer to Model Monitoring and include requests per minute (RPM), time to first Token (TTFT), time per output Token (TPOT), non-streaming API latency, rate limiting error rate, timeout error rate, error rate, and cache hit rate.
Configuring Alarm
On the Create Alarm Policy page in TCOP, complete the configuration of the three sections—Basic Information, Alarm Rules, and Alarm Notifications—for the policy to take effect.
Step 1: Basic Information
Configuration Item | Description |
Policy Name | Up to 60 characters. It is recommended to reflect the alarm object and metric, for example, tokenhub-glm5-input-tpm. |
Remarks | Up to 100 characters. You can enter a business description. |
Tags | Add tags as needed to facilitate policy categorization and permission management. |
Step 2: Configuring Alarm Rules
Configuration Item | Description |
Monitoring Type | Select Cloud Product Monitoring |
Policy Type | Select TokenHub, select a specific view (Endpoint / All Objects / Model / API Key / Specify an endpoint under APIKey / Specify the endpoint in the model), and select Usage Metrics or Performance Metrics. |
Alarm object | Supports Specific Instance or All Instances. When "Specific Instance" is selected, select the specific service, model, or API Key from the dropdown list on the right. |
Trigger condition | Supports Select Template or Configure manaually. When manual configuration is performed, it is defined by the combination of "Metric + Comparison relationship + Threshold + Data point statistical granularity + Abnormal duration + Alarm frequency". |
Step 3: Configuring Alarm Notifications
Bind an alarm notification template, which allows you to select from multiple notification channels such as SMS, email, phone, WeCom, and Webhook. For specific configurations, see the Alarm Notification Template documentation in TCOP.
Common Configuration Cases
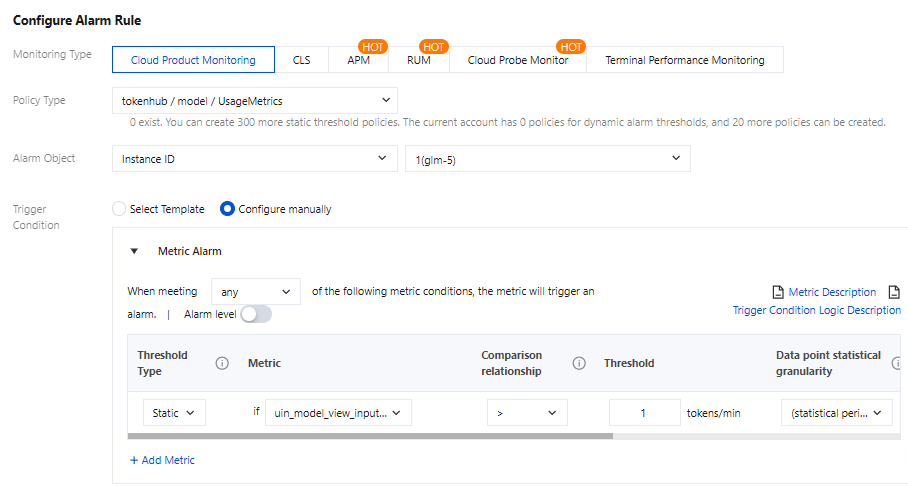
Case 1: Monitoring the Tokens per Minute (TPM) for a Model
Scenario: The business side uses the
glm-5 model and is concerned that a sudden traffic surge may cause the input TPM to reach the quota limit. They want to receive an alarm in advance when the usage approaches the limit.Configuration Steps:
Step | Configuration Item | Value |
1 | Policy Type | Under TokenHub, select Model and Usage Metrics in sequence. |
2 | Alarm Object | Select Specified Instance, and select glm-5. |
3 | Trigger Conditions | Select Configure manually. |
4 | Metric | Input Tokens per Minute |
5 | Data Point Aggregation Granularity | 1 minute |
Note:
Selecting the "Model" view means that the alert for total input TPM will be aggregated across all services and all Keys for this model. To pinpoint a specific service, please switch to the "Specify the endpoint in the model" view.
If output-side monitoring is also required, you can overlay a "Output Tokens per Minute" metric, or add it via "Add Metric" within the same alert policy.
Case 2: Monitoring the Time to First Token (TTFT) for a Service
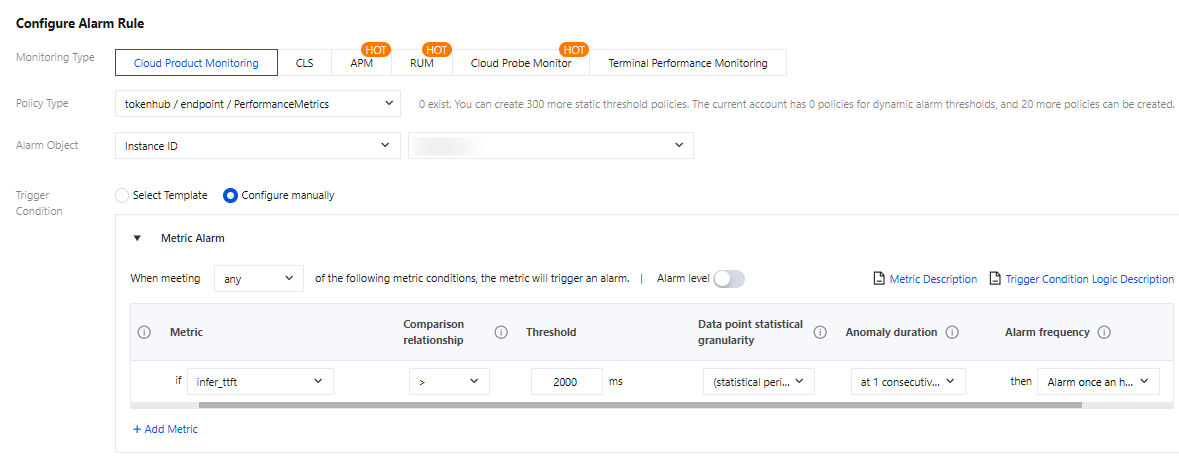
Scenario: The online inference service is sensitive to response speed and requires timely alarms when TTFT continuously degrades.
Configuration Steps:
Step | Configuration Item | Value |
1 | Policy Type | Under TokenHub, select Endpoint and Performance Metrics in sequence. |
2 | Alarm Object | Select Specified Instance, and select ep-xxx. |
3 | Trigger Conditions | Select Configure manually. |
4 | Metric Value | First Token Latency (TTFT) |
5 | Comparison Operator / Threshold | > 2000 (Unit: ms, set according to business SLA) |
6 | Data Point Aggregation Granularity | 1 minute |
Note:
TTFT only counts streaming requests. If your service primarily uses non-streaming calls, we recommend switching to the Non-streaming API Latency metric.
Setting the anomaly duration to 5 data points (5 minutes) can effectively filter out occasional jitter and prevent false alarms caused by single-point fluctuations.
Monitoring both the Timeout Error Rate and Error Rate metrics together can establish a comprehensive service health monitoring system. We recommend configuring them in combination within the same policy using the "Add Metric" function.
FAQs
Q1: Why can't I find the service / Key I just created in the alarm target dropdown?
Due to data synchronization latency in the Cloud Observability Platform's object list, newly created objects typically appear in the dropdown after 5 to 10 minutes. Please try again later.
Q2: Why do the alarms in the "All Objects (No Filtering Dimensions)" view differ from the alarm results for individual objects?
The "All Objects" view displays the aggregated value of all objects under the current account, while an alarm for a single object only targets that specific object. These two have different scopes and should be used separately based on your monitoring objectives. Use the "All Objects" view to monitor the total volume at the account level, and use the specific object view to monitor single-point risks.
Bantuan dan Dukungan
Apakah halaman ini membantu?
Anda juga dapat Menghubungi Penjualan atau Mengirimkan Tiket untuk meminta bantuan.
masukan