Log Analysis is a native visual log query and analytics feature provided by EdgeOne. It helps you quickly understand website traffic trends, security risks, and performance. By delivering EdgeOne logs to EdgeOne Log Analysis with low latency, you can search, analyze, and download logs directly in the console, without configuring an external log service or third-party analytics tool.
Use cases:
Security analysis: Identify attack sources and affected requests.
Traffic insights: Monitor traffic peaks, geographic distribution, status code distribution, and other traffic patterns.
Performance troubleshooting: Identify potential performance bottlenecks based on metrics such as latency, cache hit ratio, and request volume.
Log audit and compliance: Store and analyze log data to meet security audit and compliance requirements.
Note:
Log Analysis is currently supported only in the Enterprise plan.
Billing Overview
After Log Analysis is enabled, value-added service fees will be charged based on the peak log storage volume within the billing cycle. For details, refer to Log Analysis Fees (Postpaid).
Quick Start
Create a delivery task with the destination set to EdgeOne Log Analysis through Real-time Log Delivery. You can then view the delivered logs in the EdgeOne console on the site details page under Log Service > Log Analysis. For details, refer to Deliver to EdgeOne Log Analysis.
Supported Capabilities
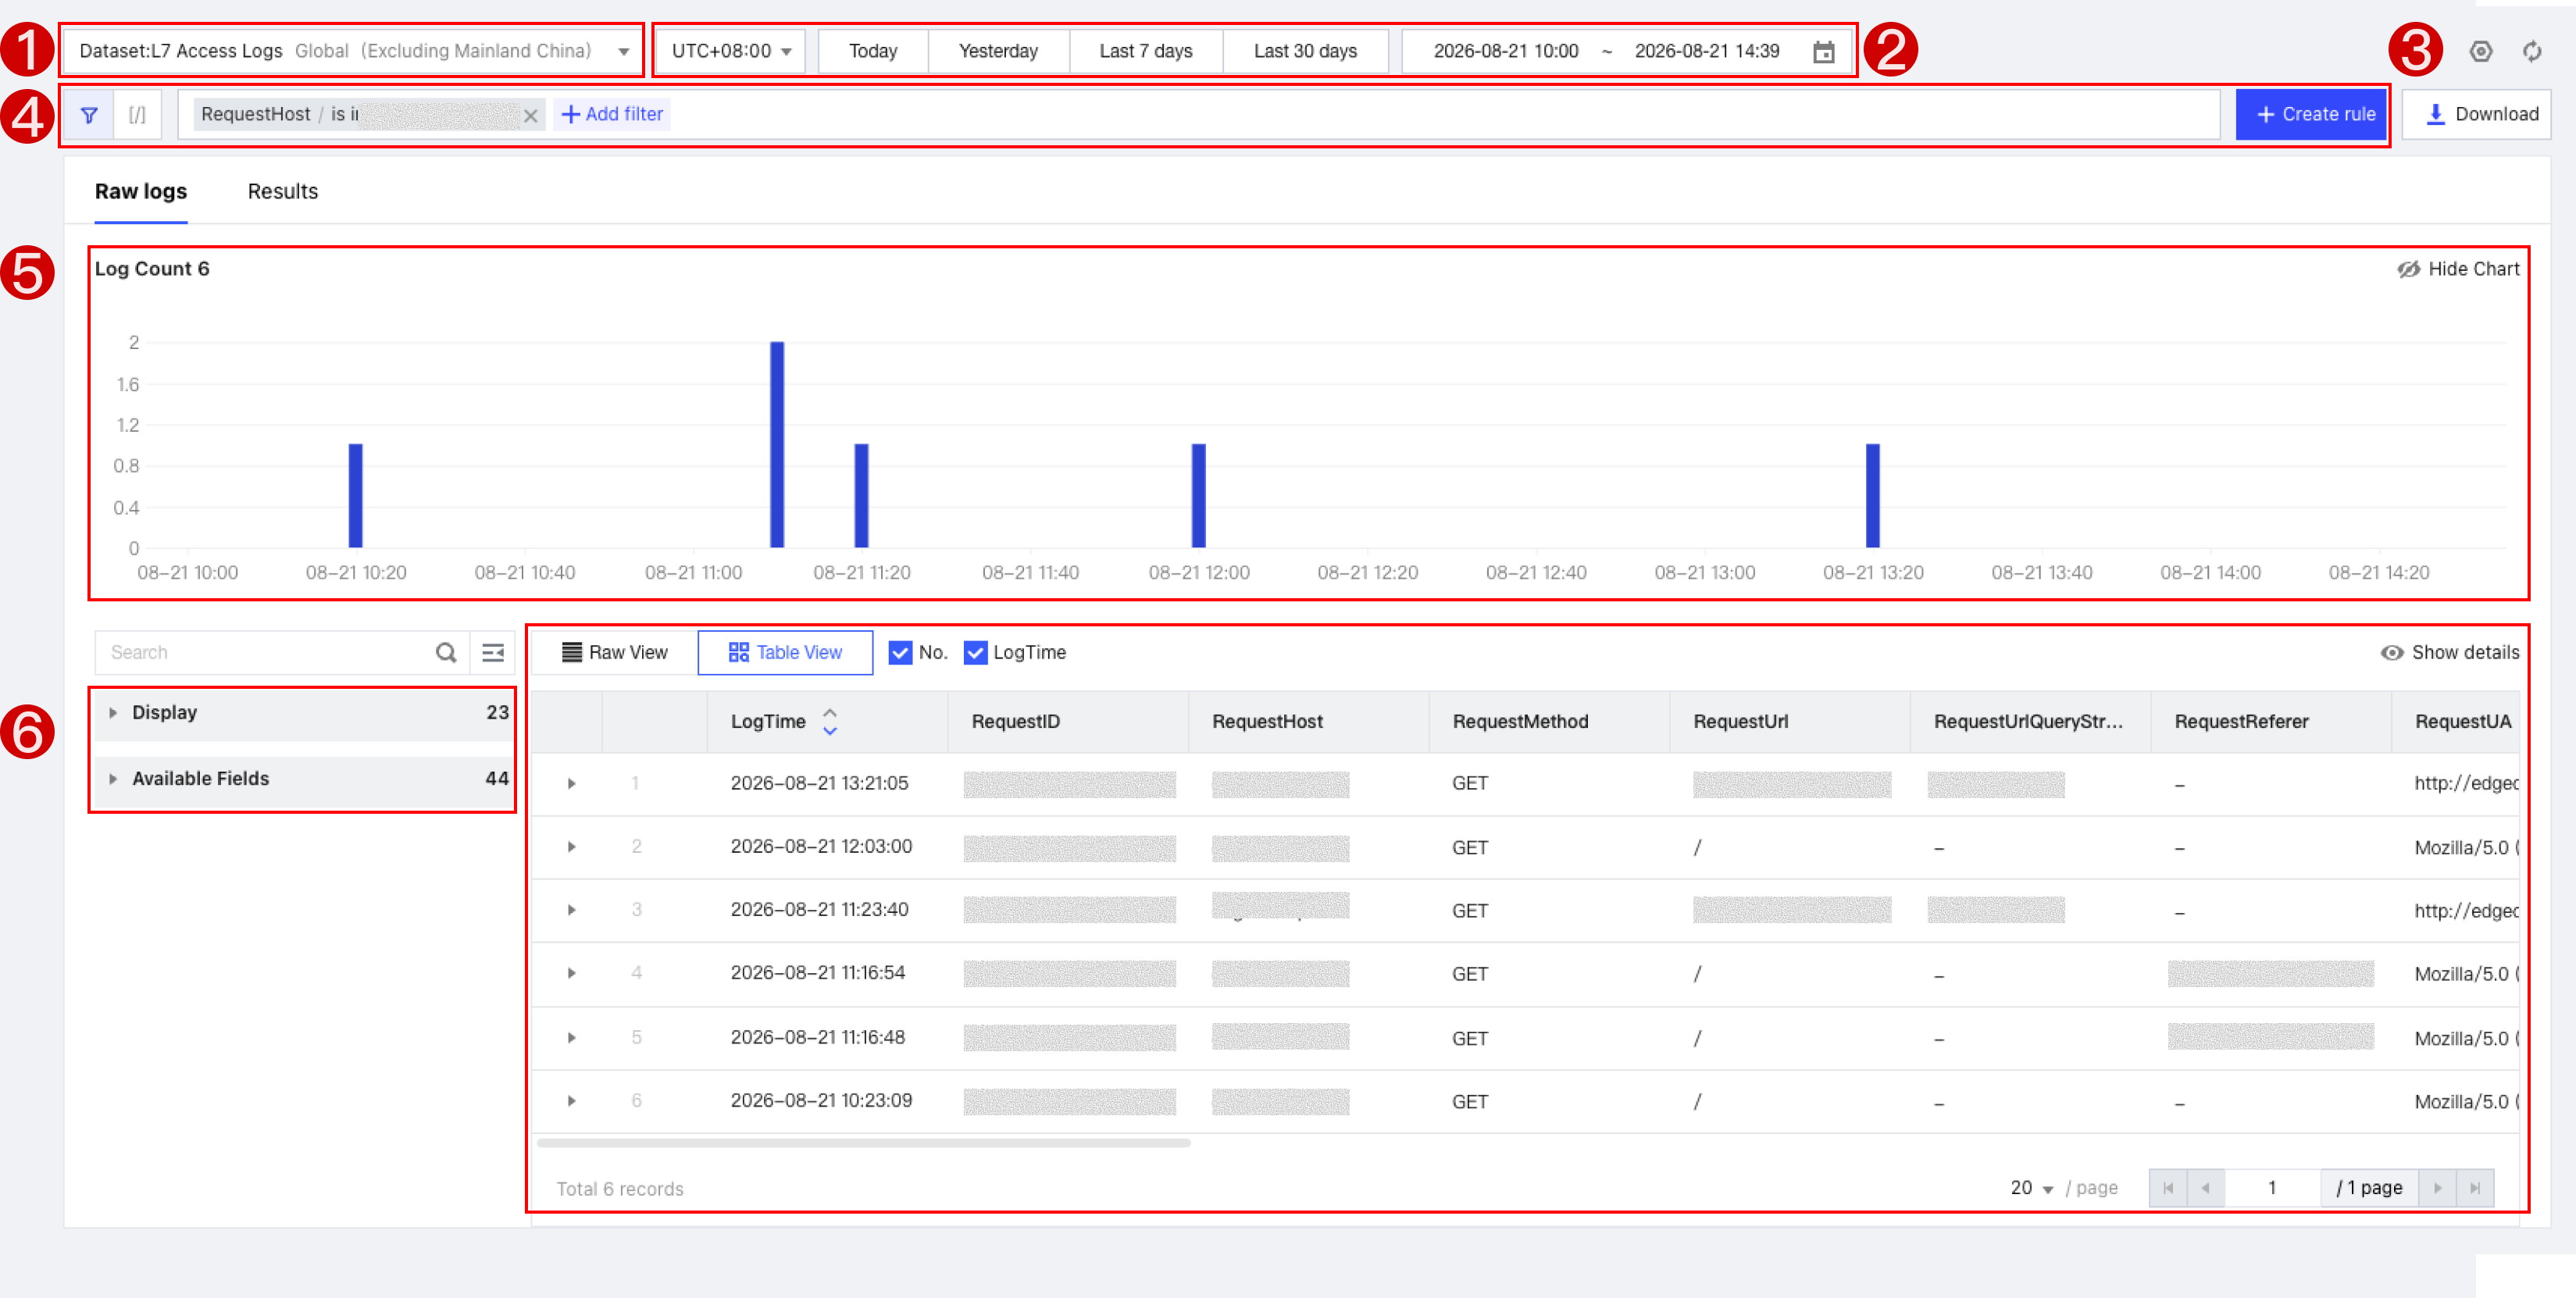
1. Log Sources
Switch the log data source displayed on the current page. Available log sources correspond to real-time log delivery tasks created for the current site and delivered to EdgeOne Log Analysis.
2. Log Time Range
Customize the query time range. Logs can be queried for any time range within the current retention period. For details, please refer to How to Modify Log Analysis Query Time Range.
3. Log Retention Period
Log Analysis supports custom retention periods of 31, 183, or 365 days. After the retention period is updated, both existing and new logs are retained based on the new setting. The change takes effect in approximately 24 hours.
Note:
After the retention period is extended, new logs are retained based on the new retention period.
After the retention period is shortened, historical logs that exceed the new retention period are deleted and cannot be recovered. Before submitting the change, make sure that your audit, troubleshooting, and compliance retention requirements are met.
4. Log Search and Rule Creation
Log Analysis supports adding filter conditions through the interactive mode or query mode. In query mode, you can append SQL statements to perform aggregation and analysis. For the search query structure, SQL aggregation syntax, supported fields, and examples, see How to Use Log Analysis Search Queries.
In interactive mode, you can create rules based on the current filter conditions. At least one request host filter condition is required. You can create Web Security Exception Rules and Precise Match Rules.
Note:
A single request may hit multiple rules. When filtering by Rule ID, logs of other rules hit at the same time will also be displayed.
5. Log Volume Trend
The Log Analysis page provides a visual log volume trend chart. Based on the selected filters and time range, the chart displays log volume trends at different granularities, including minute, hour, and day. It helps identify changes in request volume, Web Security rule hits, and error distribution.
6. Displayed Fields and Available Fields
Displayed fields: By default, the fields defined in the current real-time log delivery task are displayed. You can hide fields or adjust the fields shown under Displayed Fields to change the log details displayed on the right.
Available fields: Displays all fields supported by the current log source. To add delivery fields, go to the Real-time Log Delivery Task and modify the existing task.
7. Log Details
The Log Details section displays raw log entries that match the current filter conditions and time range. Logs can be sorted by time in ascending or descending order. Each row represents a single Layer 7 request log, containing two columns: Log Time and Log Data. The fields shown in the Log Data column are determined by the Displayed Fields settings.
8. Log Download
Click Download to export the query result under the current filter conditions and time range. After a successful download task creation, you can view the progress and details in Download Records. Once the file generation is complete, you can download the CSV file.
Note:
A download task cannot be created while log results are loading or when the query result is empty.
The maximum number of logs that can be downloaded at a time is 50,000,000.