This task guides you on how to use API Gateway to view the statistical data of all APIs in the service environment.
Directions
1. Log in to the API Gateway console and click Service in the left sidebar to access the service list page.
2. On the service list page, click a service name to access its service details page.
3. At the top of the service details page, click Monitoring to go to the monitoring page of the service.
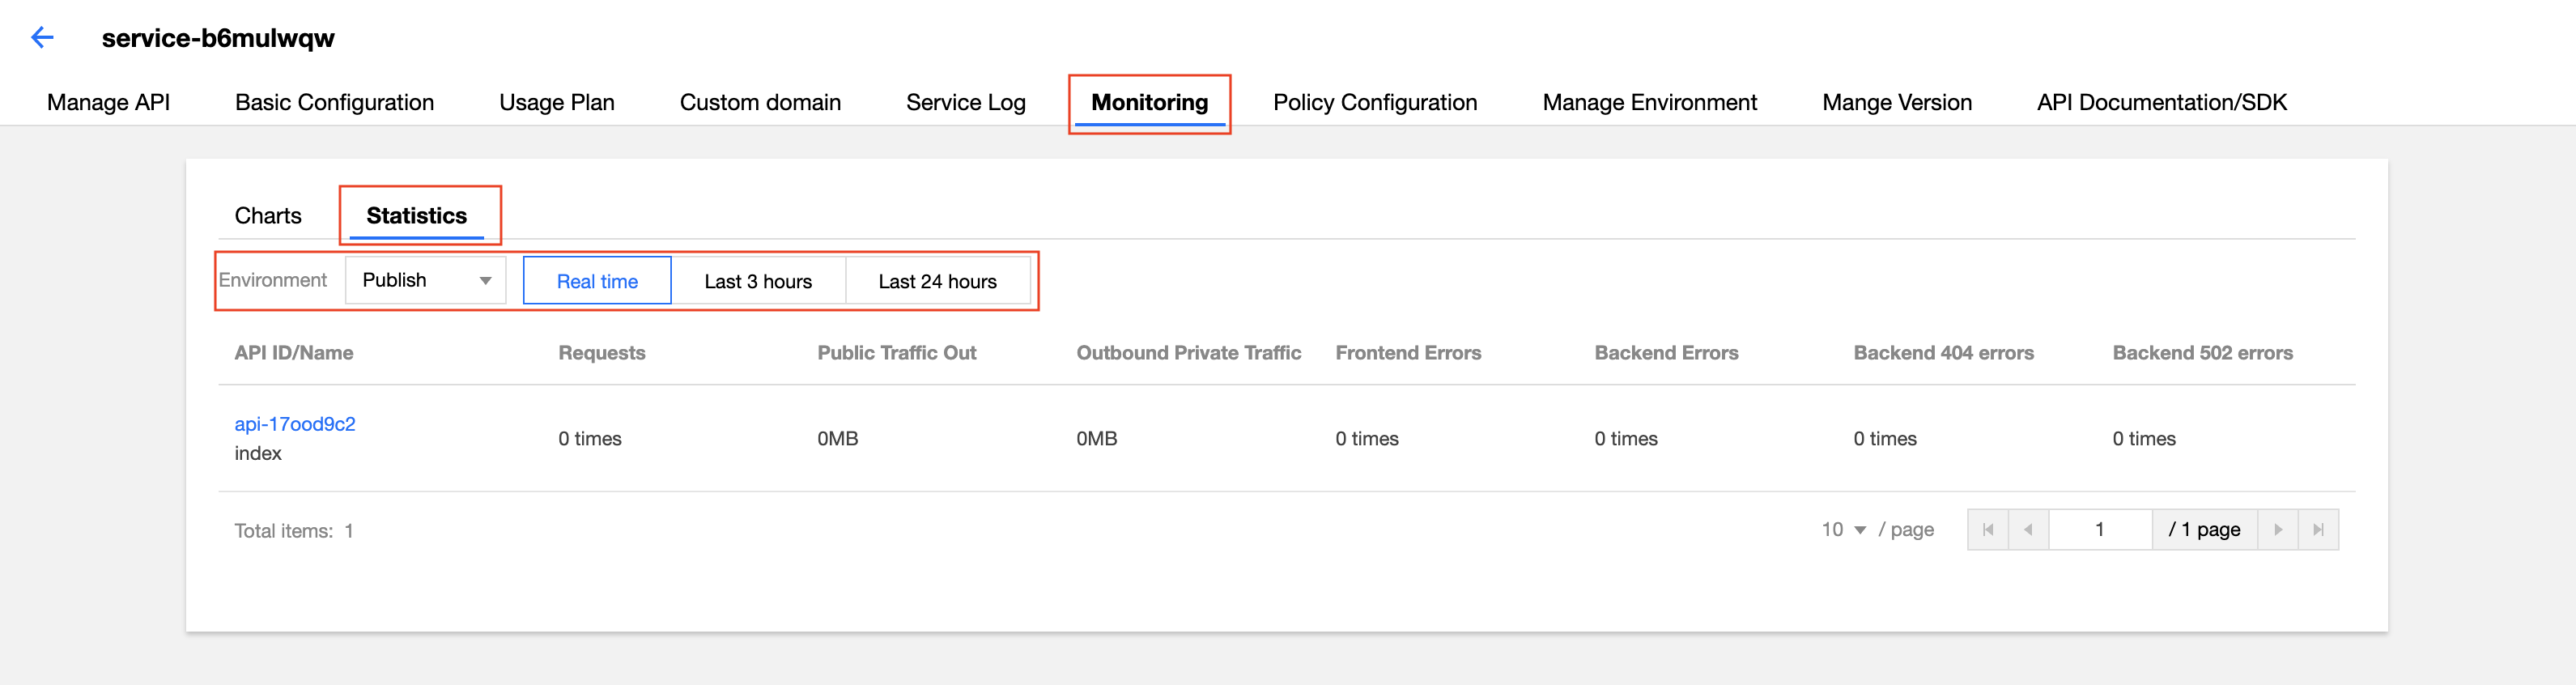
4. On the Monitoring page, choose the Statistics tab and then select the Environment and time to view the monitoring data of all APIs in the service environment within the specified time period.
Note:
Currently, monitoring data in real time, in the last 3 hours, and in the last 24 hours are supported.
Currently, the following 7 metrics are supported: Requests (times), Public Outbound Traffic, Outbound Private Traffic, Frontend Errors (times), Backend Errors (times), Backend 404 Errors (times), Backend 502 Errors (times). For more information about the monitoring metrics, please see Monitoring Metrics.

 はい
はい
 いいえ
いいえ
この記事はお役に立ちましたか?