- Release Notes and Announcements
- Product Introduction
- Purchase Guide
- Getting Started
- Operation Guide
- Development Guide
- Best Practices
- API Documentation
- SDK Documentation
- FAQs
- General References
- Service Level Agreement
- Contact Us
- Release Notes and Announcements
- Product Introduction
- Purchase Guide
- Getting Started
- Operation Guide
- Development Guide
- Best Practices
- API Documentation
- SDK Documentation
- FAQs
- General References
- Service Level Agreement
- Contact Us
Overview
A TDMQ for RabbitMQ exclusive cluster can monitor resources created under your account, including clusters and nodes. You can analyze the cluster usage based on the monitoring data and handle possible risks promptly. You can also set alarm rules for monitoring metrics to receive alarm messages when metrics are abnormal. This helps you deal with risks in time and ensure the stable operations of your system.
Monitoring Metrics
You can check monitoring metrics of a TDMQ for RabbitMQ exclusive cluster from four dimensions: cluster, node, vhost, and queue. The following table describes supported monitoring metrics.
Type | Monitoring Metric | Unit | Description |
Basic Information | Connection Count | Count | Number of opened connections |
| Channel Count | Count | Number of opened channels |
| Queue Count | Count | Total number of available queues |
| Consumer Count | Count | Total number of online consumers |
| Message Backlog | Count | Total number of messages in the Ready state (accumulated but not delivered) |
| Inbound Public Network Bandwidth | Mbps | Inbound public network bandwidth |
| Outbound Public Network Bandwidth | Mbps | Outbound public network bandwidth |
| Recommended TPS Limit (Production + Consumption) | Count/s | Recommended TPS limit for the cluster when the mirror queue is not enabled |
| Total Opened Channels | Count | Total number of opened channels |
Production and Consumption | Production Confirmation Rate | Count/s | Rate that the broker confirms to return a packet after the client successfully generates a message |
| Messages Produced per Second | Count/s | Rate that the client generates messages |
| Unacknowledged Message Count | Count | Total number of messages that are delivered to but are not acknowledged by the consumer |
| Consumption Acknowledgment Rate | Count/s | Rate that the consumer acknowledges messages |
| Messages Consumed per Second | Count/s | Number of messages consumed per second, including scenarios in which autoAck = false and autoAck = true |
| Redelivery Rate | Count/s | Rate for redelivering messages to the consumer in a channel |
| Message Discard Rate | Count/s | Rate for dropping messages that are sent to an exchange with mandatory = false due to no matching route |
Type | Monitoring Metric | Unit | Description |
Basic Information | Connection Count | Count | Number of open connections |
| Channel Count | Count | Number of opened channels |
| Queue Count | Count | Total number of available queues |
| Consumer Count | Count | Total number of online consumers |
| Message Backlog | Count | Total number of messages in the Ready state (accumulated but not delivered) |
| CPU Usage | % | CPU usage of a node |
| Memory Usage | % | Memory usage of a node |
| Disk Usage | % | Disk usage of a node |
Production and Consumption | Production Confirmation Rate | Count/s | Rate that the broker confirms to return a packet after the client successfully generates a message |
| Messages Produced per Second | Count/s | Rate that the client generates messages |
| Unacknowledged Message Count | Count | Total number of messages that are delivered to but are not acknowledged by the consumer |
| Consumption Acknowledgment Rate | Count/s | Rate that the consumer acknowledges messages |
| Messages Consumed per Second | Count/s | Number of messages consumed per second, including scenarios in which autoAck = false and autoAck = true |
| Redelivery Rate | Count/s | Rate for redelivering messages to the consumer in a channel |
| Message Discard Rate | Count/s | Rate for dropping messages that are sent to an exchange with mandatory = false due to no matching route |
Type | Monitoring Metric | Unit | Description |
Basic Information | Consumer Count | Count | Total number of online consumers |
| Message Backlog | Count | Total number of messages in the Ready state (accumulated but not delivered)
++ |
Production and Consumption | Production Confirmation Rate | Count/s | Rate that the broker confirms to return a packet after the client successfully generates a message |
| Messages Produced per Second | Count/s | Rate that the client generates messages |
| Unacknowledged Message Count | Count | Total number of messages that are delivered to but are not acknowledged by the consumer |
| Consumption Acknowledgment Rate | Count/s | Rate that the consumer acknowledges messages |
| Messages Consumed per Second | Count/s | Number of messages consumed per second, including scenarios in which autoAck = false and autoAck = true |
| Redelivery Rate | Count/s | Rate for redelivering messages to the consumer in a channel |
| Message Discard Rate | Count/s | Rate for dropping messages that are sent to an exchange with mandatory = false due to no matching route |
Type | Monitoring Metric | Unit | Description |
Basic Information | Consumer Count | Count | Total number of online consumers |
| Message Backlog | Count | Total number of messages in the Ready state (accumulated but not delivered) |
Production and Consumption | Unacknowledged Message Count | Count | Total number of messages that are delivered to but are not acknowledged by the consumer |
| Consumption Acknowledgment Rate | Count/s | Rate that the consumer acknowledges messages |
| Redelivery Rate | Count/s | Rate for redelivering messages to the consumer in a channel |
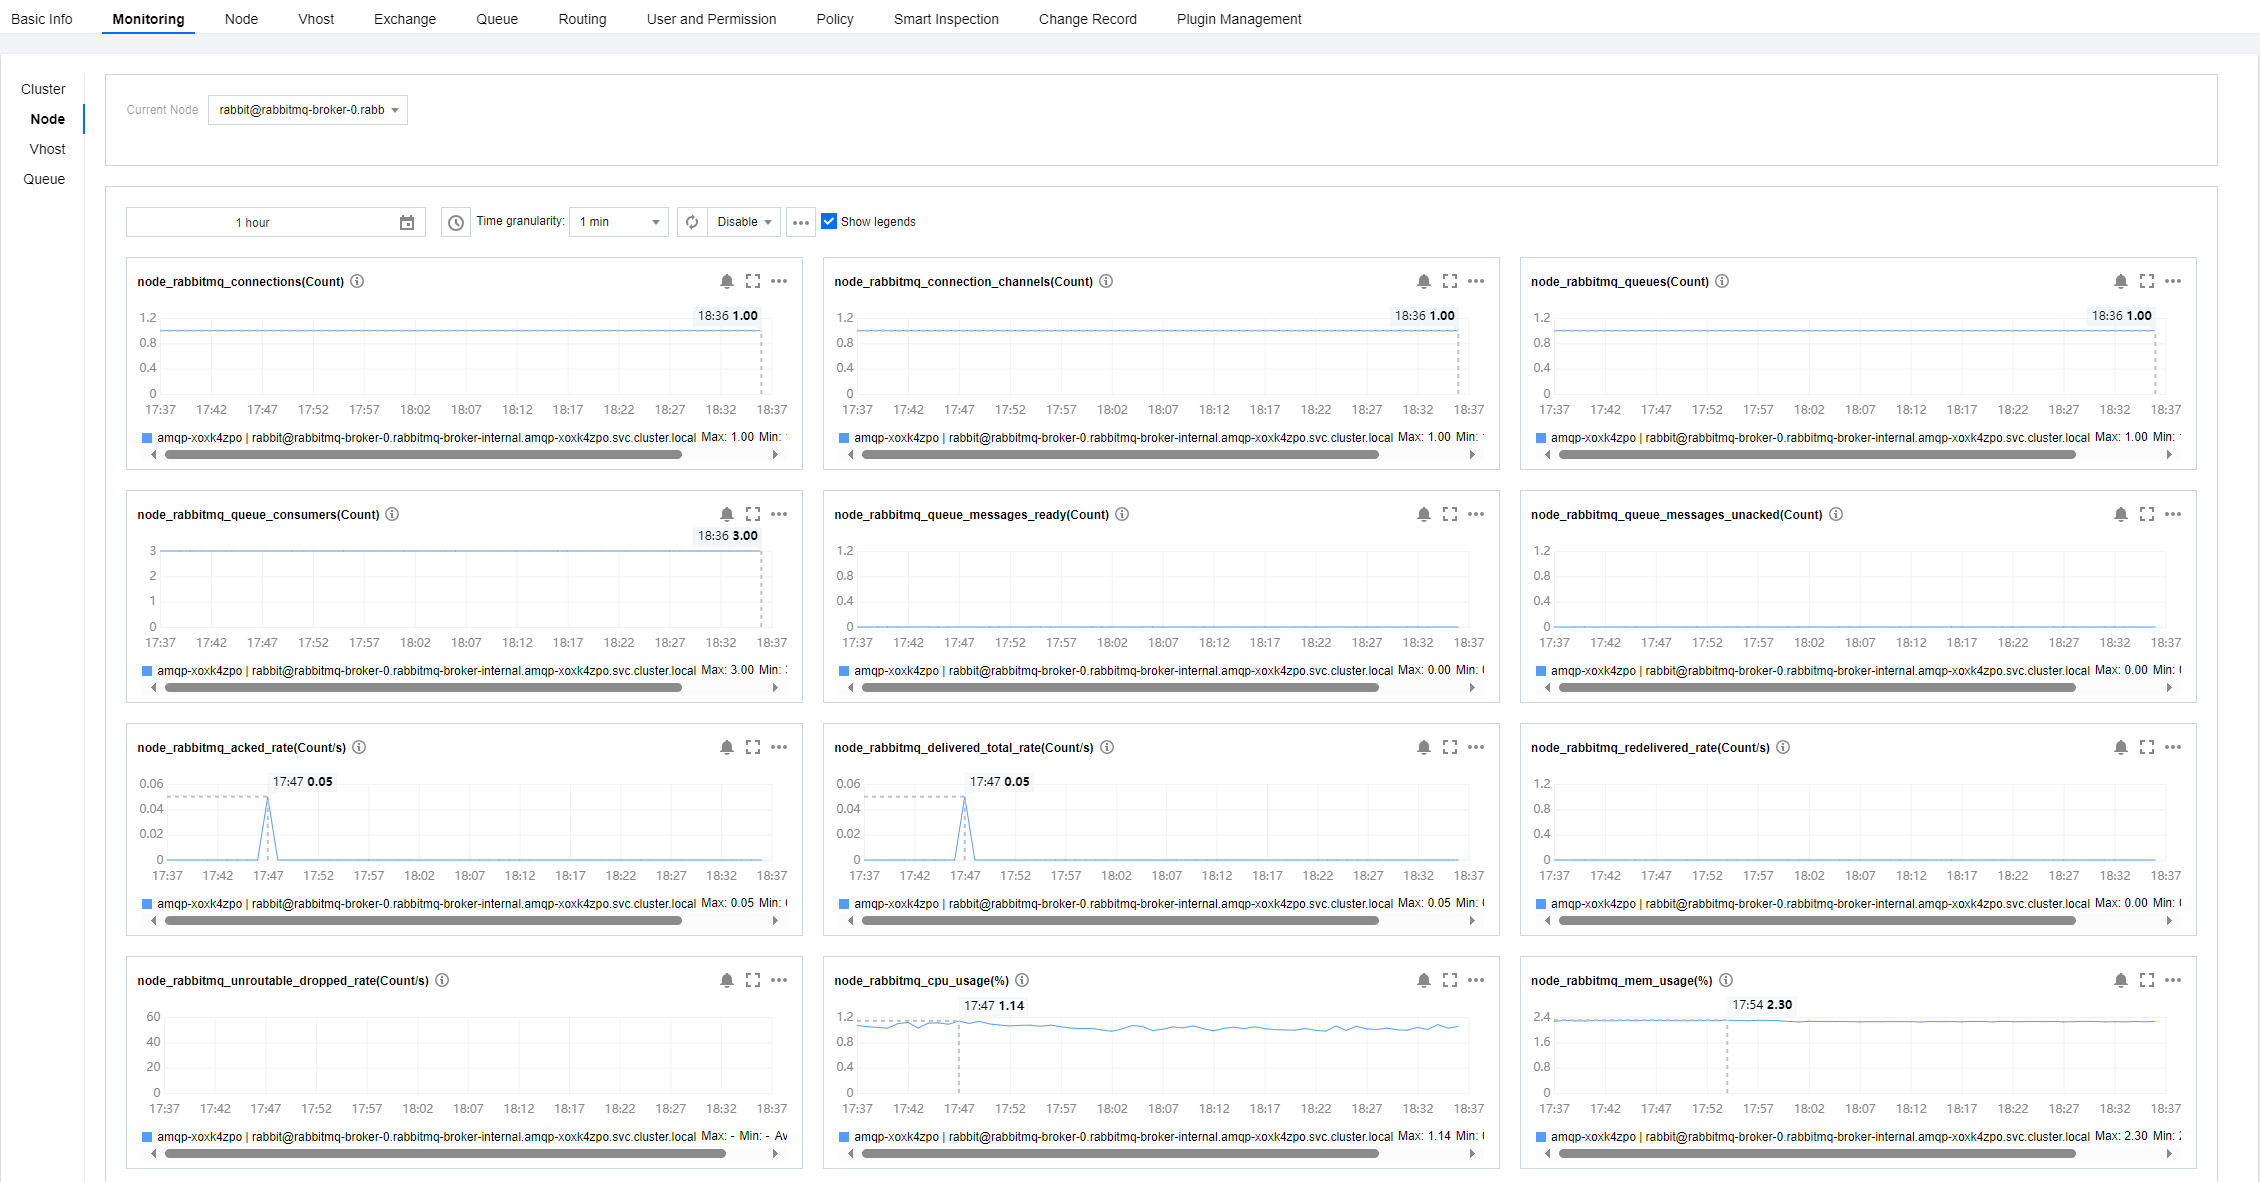
Viewing Monitoring Data
1. Log in to the TDMQ for RabbitMQ console.
2. In the left sidebar, select Cluster Management , select a region, and click the ID of the target cluster to enter the cluster details page.
3. At the top of the cluster details page, select the Monitoring tab to enter the monitoring page.
4. Select the Resource tab, select the resource you want to view, and set the time range to view monitoring data.
Icon | Note |
 | Click it to view the monitoring metrics on a YoY basis. YoY, MoM, and custom date are supported. |
 | Click it to refresh and obtain the latest monitoring data. Monitoring data can be refreshed at intervals of 30 seconds, 5 minutes, 30 minutes, and 1 hour. |
 | |
 | After it is selected, legend information can be displayed on the chart. |
Configuring Alarm Rules
Creating an Alarm Rule
You can configure alarm rules for monitoring metrics. When a monitoring metric reaches the set alarm threshold, Cloud Monitor will notify you of exceptions in time via email or SMS.
1. On the Monitoring page of the cluster, click the alarm icon below to enter the CM console and configure an alarm policy.
2. On the alarm configuration page, select a policy type and instance, and set the alarm rule and notification template.
Policy Type: Select TDMQ/RabbitMQ.
Alarm Object: Select the RabbitMQ resource for which to configure the alarm policy.
Trigger Condition: You can select Select template or Configure manually. The latter is selected by default. For more information on manual configuration, see the description below. For more information on how to create a template, see Creating a trigger condition template.
Note:
Metric: For example, if you select 1 minute as the statistical period for the "connections" metric, then if the average production duration exceeds the threshold for N consecutive data points, an alarm will be triggered.
Alarm Frequency: For example, "Alarm once every 30 minutes" means that there will be only one alarm triggered every 30 minutes if a metric exceeds the threshold in several consecutive statistical periods. Another alarm will be triggered only if the metric exceeds the threshold again in the next 30 minutes.
Notification Template: You can select an existing notification template or create one to set the alarm recipient objects and receiving channels.
3. Click Complete.
Note:
Creating a trigger condition template
1. Log in to the CM console.
2. On the left sidebar, click Trigger Condition Template to enter the Template list page.
3. Click Create on the Trigger Condition Template page.
4. On the template creation page, configure the policy type.
Policy Type: Select TDMQ/RabbitMQ.
Use preset trigger condition: Select this option and the system recommended alarm policy will be displayed.
5. After it is confirmed that everything is correct, click Save.
6. Return to alarm policy creation page and click Refresh. The alarm policy template just configured will be displayed.
Alarm Configuration Suggestions
This section describes some key metrics and their alarm configuration suggestions while using TDMQ for RabbitMQ.
Metric | Dimension | Suggested Alarm Configuration | Description |
Disk Usage (%) | Node | Statistical period of 1 minute, > 80%, and for 5 consecutive data points. Alarm once every 30 minutes | High disk usage may result in insufficient disk space on the node to accommodate messages assigned to it. As a result, messages cannot be written to the disk. You are advised to promptly clear data or scale out the cluster when the average disk usage exceeds 80%. |
Memory Usage (%) | Node | Statistical period of 1 minute, > 50%, and for 5 consecutive data points. Alarm once every 30 minutes | High memory usage blocks message production. You are advised to accelerate consumption, apply flow control to production, or scale out the cluster when the memory usage exceeds 50%. |
CPU Usage (%) | Node | Statistical period of 1 minute, > 70%, and for 5 consecutive data points. Alarm once every 30 minutes | High CPU usage affects the message production speed. You are advised to scale out the cluster when the CPU usage exceeds 70%. |
Message backlog (Count) | Node | Statistical period of 5 minutes, > expected message backlog for the business, and for 5 consecutive data points. Alarm once every 30 minutes | An excessive accumulation of messages causes a rapid disk usage increase of the broker node. As a result, other messages cannot be received, and scale-out is needed. |

 Yes
Yes
 No
No
Was this page helpful?