Prometheus is a flexible time series database generally used for monitoring data storage, computing, and alerting.
With the Pushgateway service provided by Prometheus, you can push Built-in Flink metrics and custom business metrics to your self-built or TencentCloud Managed Service for Prometheus server, so that you can group, aggregate, and display these metrics in Grafana.
We recommend you use TencentCloud Managed Service for Prometheus in Tencent Cloud Observability Platform (TCOP) to save you on deployment and Ops costs. Meanwhile, Notification Template is available, allowing alarm notifications to be sent to recipients via SMS, call, Email, WeCom bot, and other methods.
Importing Grafana dashboard for Stream Compute Service
1. Download the Grafana dashboard template here and unzip it to the local system.
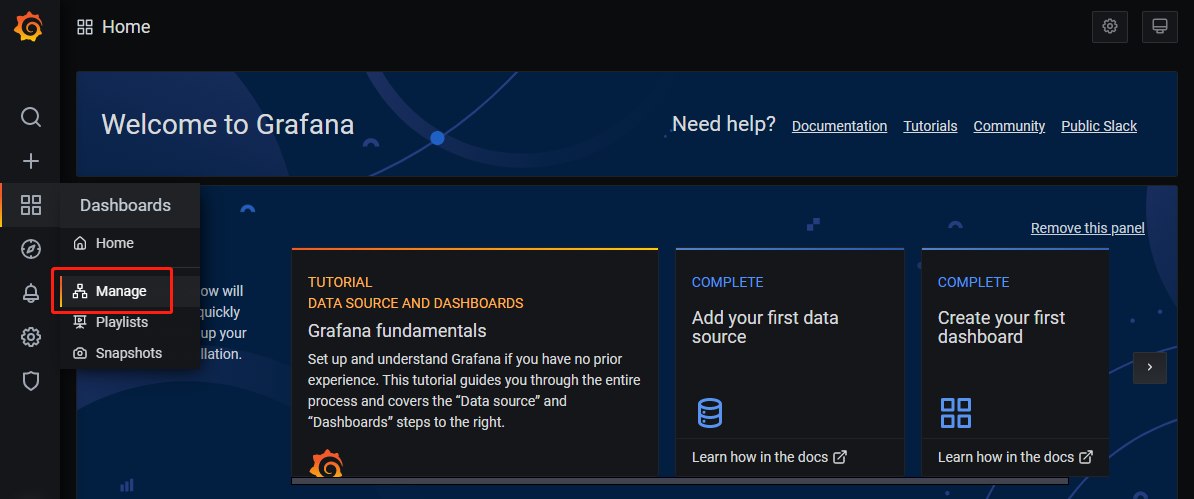
2. In the Grafana dashboard of Prometheus, click
> Manage on the left sidebar.
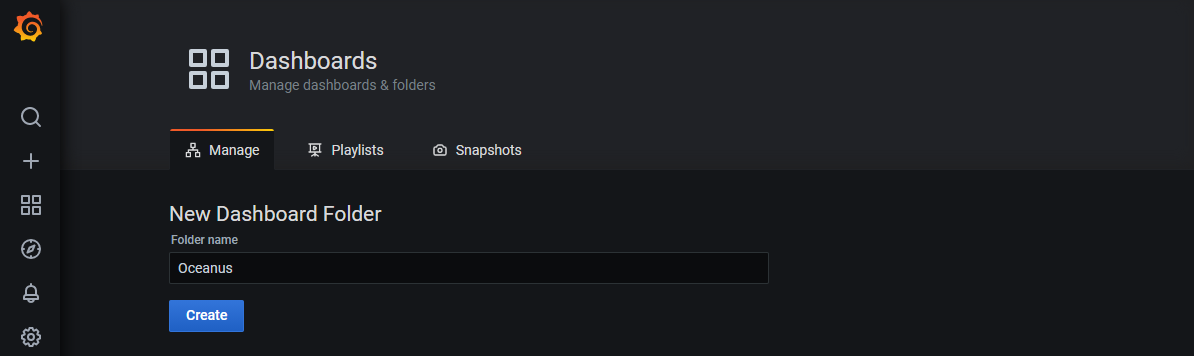
3. Create a new folder named Stream Compute Service.
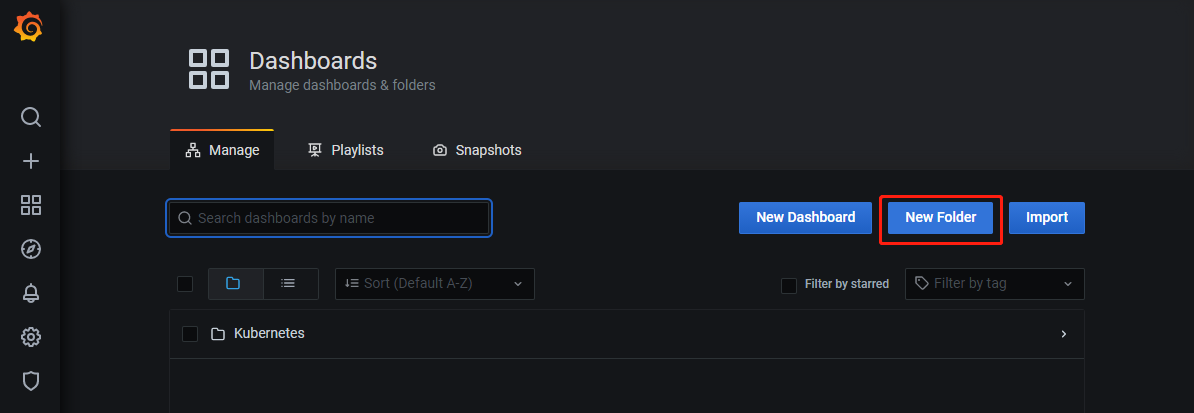
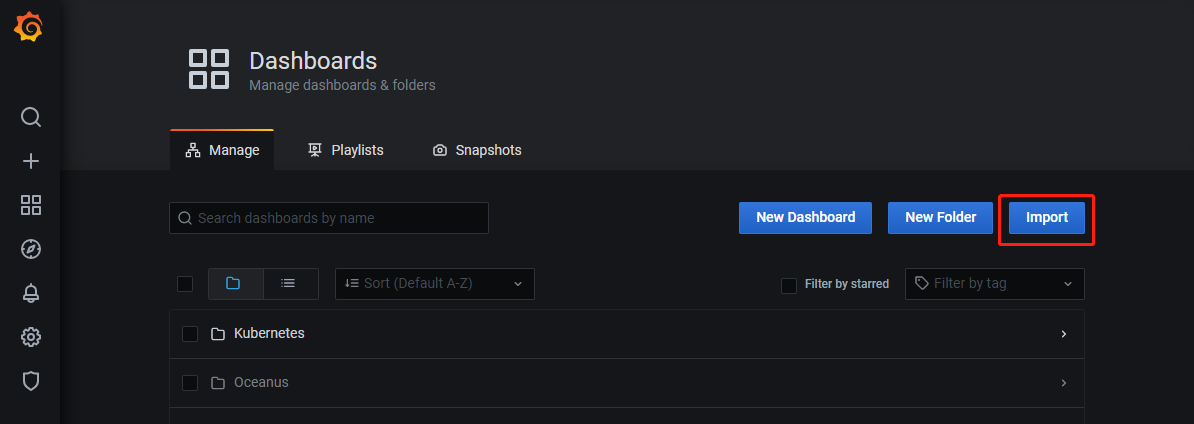
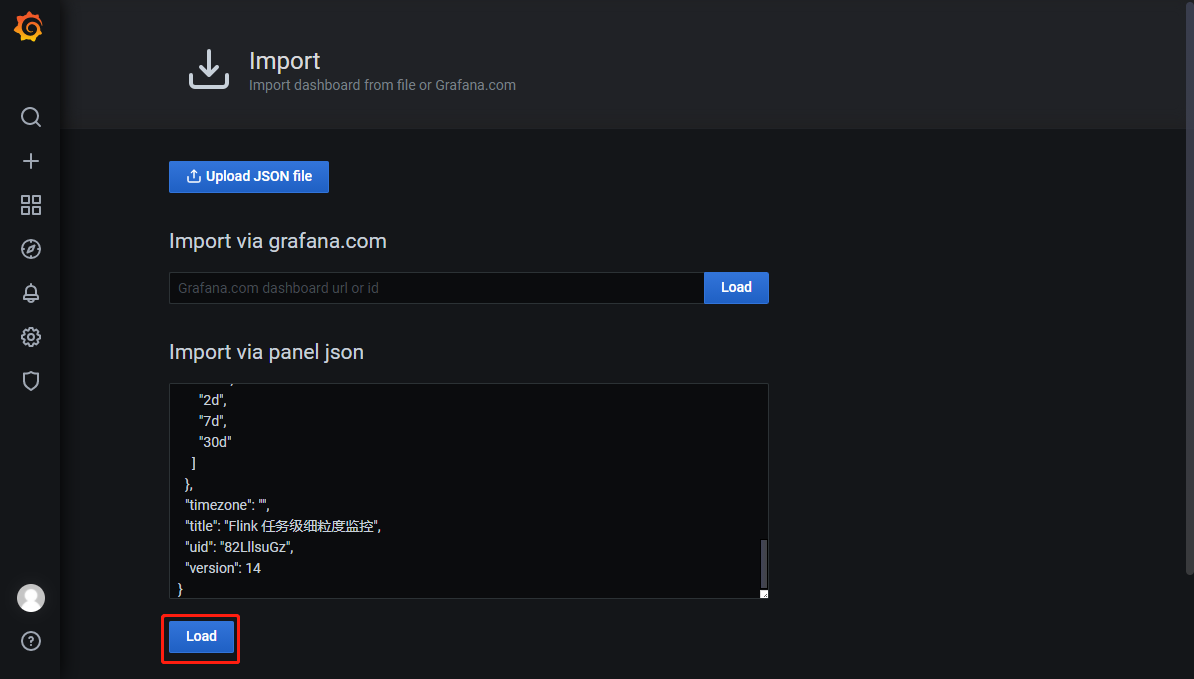
4. Go to the Manage page again, click Import in the top right corner, and paste the content of all uncompressed JSON files one by one.
Note
Import each JSON file as instructed below.
Don't change the dashboard UID (don't click Change uid) to avoid failures of links for redirecting between dashboards.
5. After all files are imported, check whether the Stream Compute Service directory contains the dashboard.
Enabling Prometheus metric reporting for a job
Note
You need to separately configure Prometheus metric reporting for each job.
After the configurations of a job are modified, you must click Publish draft and Run version to restart the job before monitoring data is reported.
If TencentCloud Managed Service for Prometheus provided by TCOP is used, the following authentication information (password is the token shown in the console) is also required:
3. Publish and start the job with new configurations, wait about 1 minute (reporting period), and view data in the dashboard.
4. Edit the Prometheus dashboard to meet your specific monitoring requirements.
Configuring alarms
To configure an alarm based on a metric, job_numberoffailedcheckpoints, for example, and display the configured alarm policy in TencentCloud Managed Service for Prometheus, follow these steps:
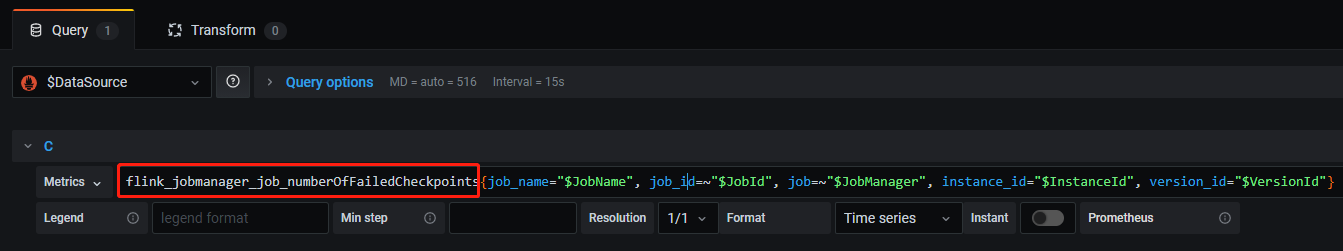
1. Select a target metric (here is job_numberoffailedcheckpoints) on the dashboard.
2. View the query condition of the metric on its editing page.
3. Add a rule on the Prometheus alarm configuration page.
Note
In the rule PromQL, do not enter any Grafana variable shown above in { }, such as instance_id="$InstanceId". If filters are required, enter specific values in { }, such as instance_id="cql-abcd0012".
A tag in the source (such as job_id) can be referenced in the alarm object and alarm message, such as {{ $labels.job_id }}, and the value of the query statement can be expressed as {{ $value }}.
4. When an alarm is triggered or cleared, a notification will be sent via the specified receiving channels. In addition, you can configure other receiving channels such as SMS, call, and Email in Notification Template.
Note
The following shows notifications sent via the WeCom bot