CDN 访问日志分析
Download
Focus Mode
Font Size
简介
内容分发网络(Content Delivery Network,CDN) 是非常重要的互联网基础设施,用户可以通过 CDN,快速地访问网络中各种图片,视频等资源。在访问过程中,CDN 会产生大量的访问日志数据。这些日志详细记录了用户的访问请求,包括访问时间、访问的资源、用户的地理位置、设备信息以及请求的状态等信息(完整日志字段说明请参见 日志字段说明)。CLS 日志服务联合 CDN,支持将 CDN 域名访问日志实时采集至 CLS,并基于 CLS 的日志分析能力,帮助您完成 CDN 的质量和性能的分析、错误诊断、客户端分布、用户行为分析等。通过本篇实践,您可以详细的了解如下内容:
实践场景案例
您也可通过以下 Demo,快速体验 CLS 与 CDN 的强大结合。
功能优势
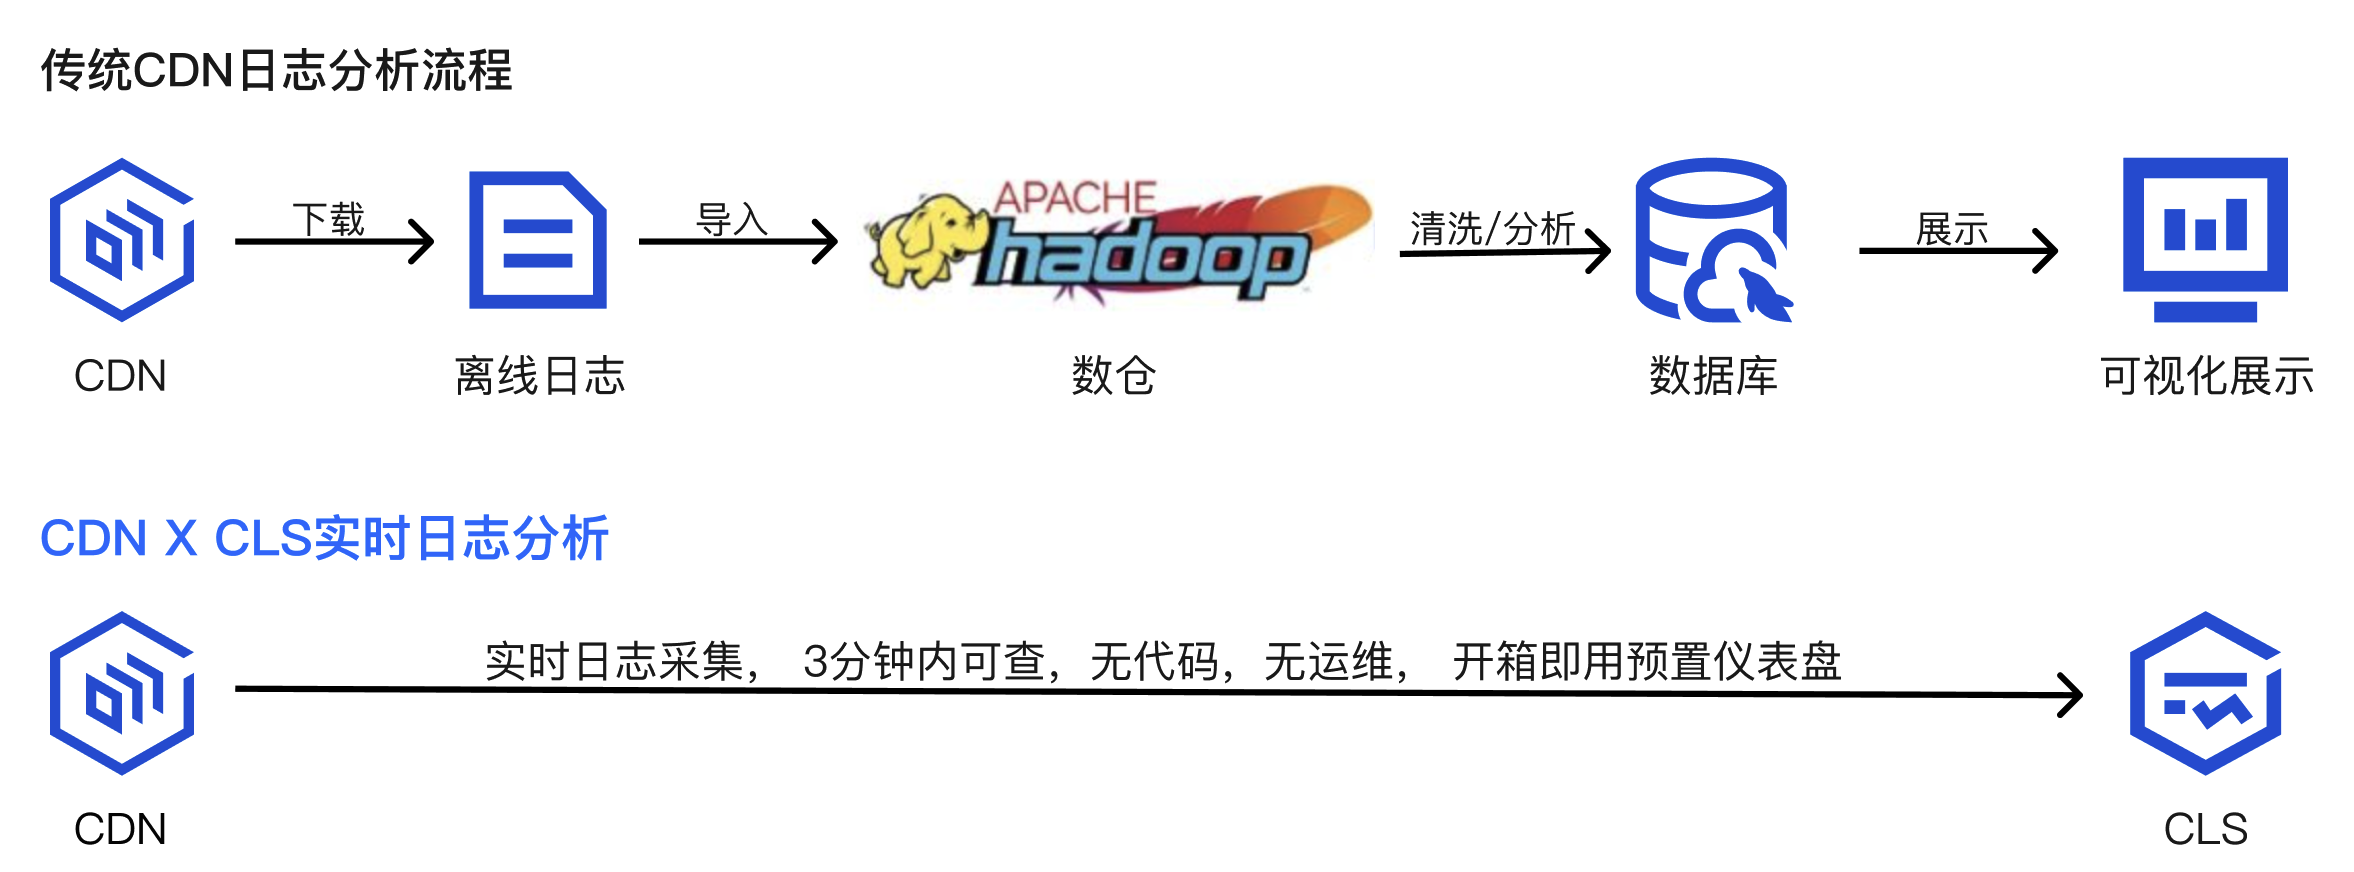
日志实时分析:
CLS 实时采集 CDN 的域名访问日志,日志数据延迟不超过3分钟。而传统 CDN 日志分析场景中,往往需要下载日志进行离线分析,延迟通常在24小时以内。
分析报表开箱即用:
CLS 为 CDN 访问日志分析场景提供了开箱即用的访问分析仪表盘,仪表中包含 CDN 质量和性能、错误诊断、客户端分布,以及用户行为等分析看板。 而在传统 CDN 日志分析场景中,需下载日志至离线,再上传至数据仓库,然后在数据仓库进行一系列的数据清洗和数据模型定义。这一过程繁琐又消耗较多人力成本。
采集 CDN 域名访问日志
步骤1:进入 CDN 云产品中心
1. 登录 日志服务控制台。
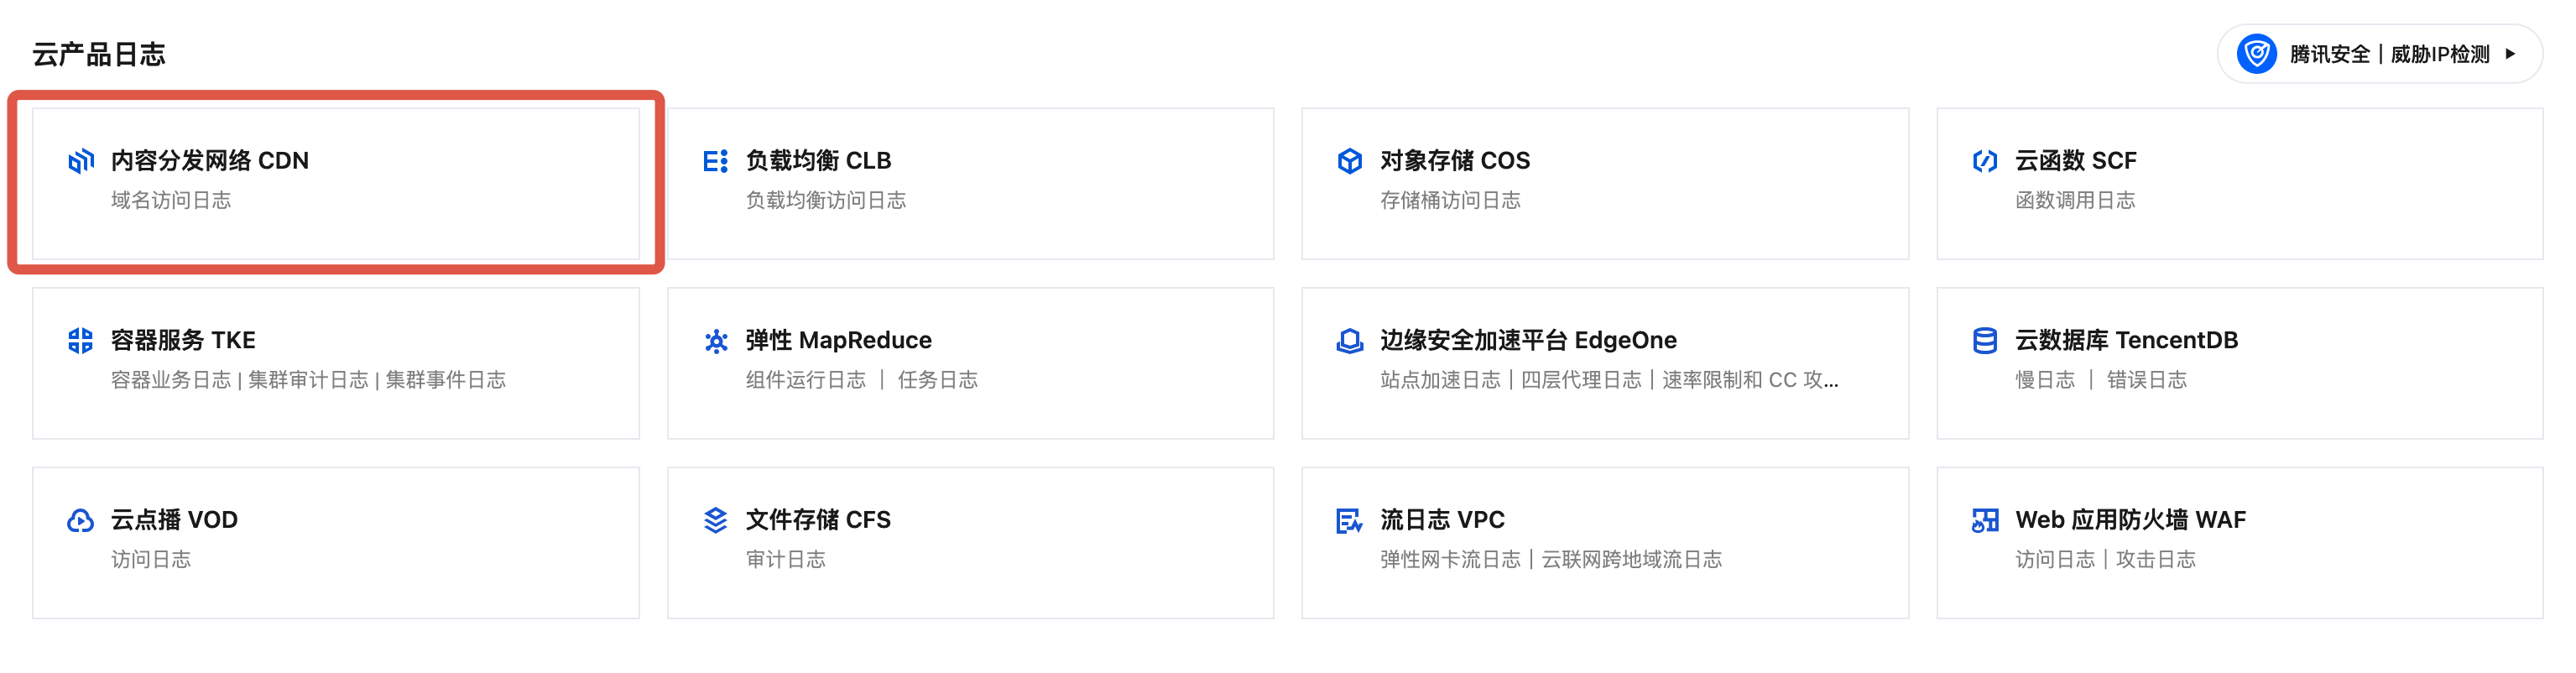
2. 在左侧导航栏中,单击云产品中心,进入云产品中心页面。
3. 在云产品日志中,选择并单击内容分发网络 CDN。
步骤2:开启域名访问日志采集
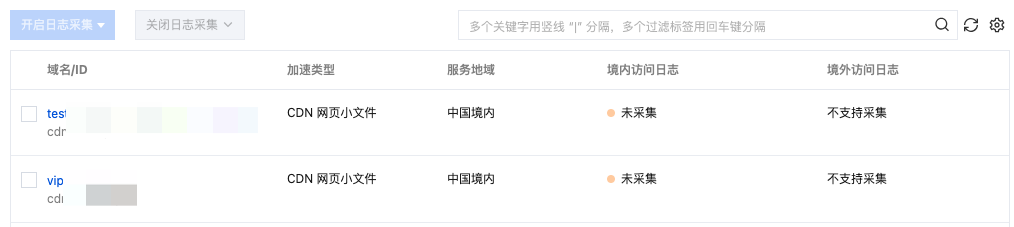
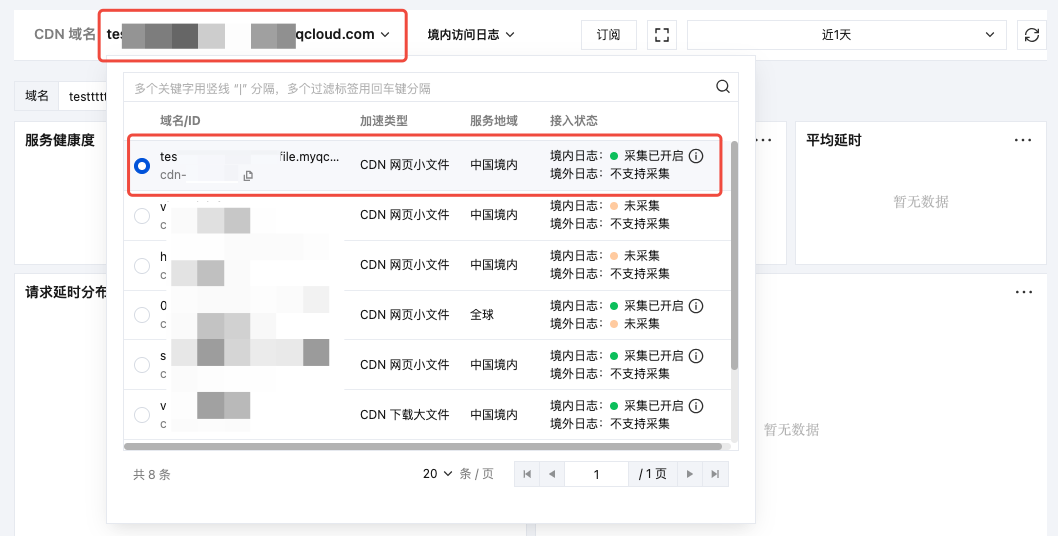
1. 在上方Tab 页选择接入管理 > 实例接入。

2. 在域名/ID 列表中,勾选一个或多个目标域名。
3. 单击开启日志采集,在下拉选项中选择开启境内或境外域名的访问日志。
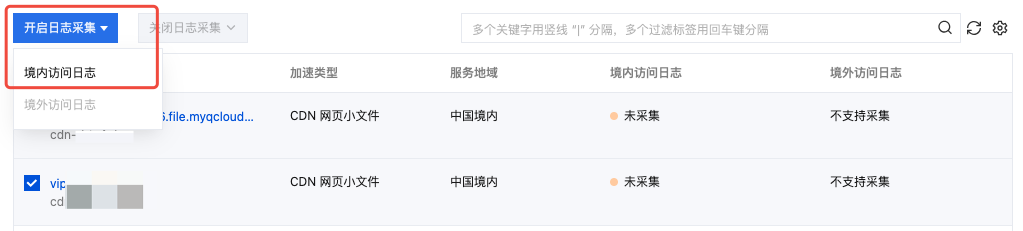
注意:
ECDN 域名与境内域名不支持开启境外访问日志采集。
境外域名不支持开启境内访问日志采集。
4. 在开启日志采集弹窗中,选择已有日志主题或 创建目标日志主题,并单击确认。
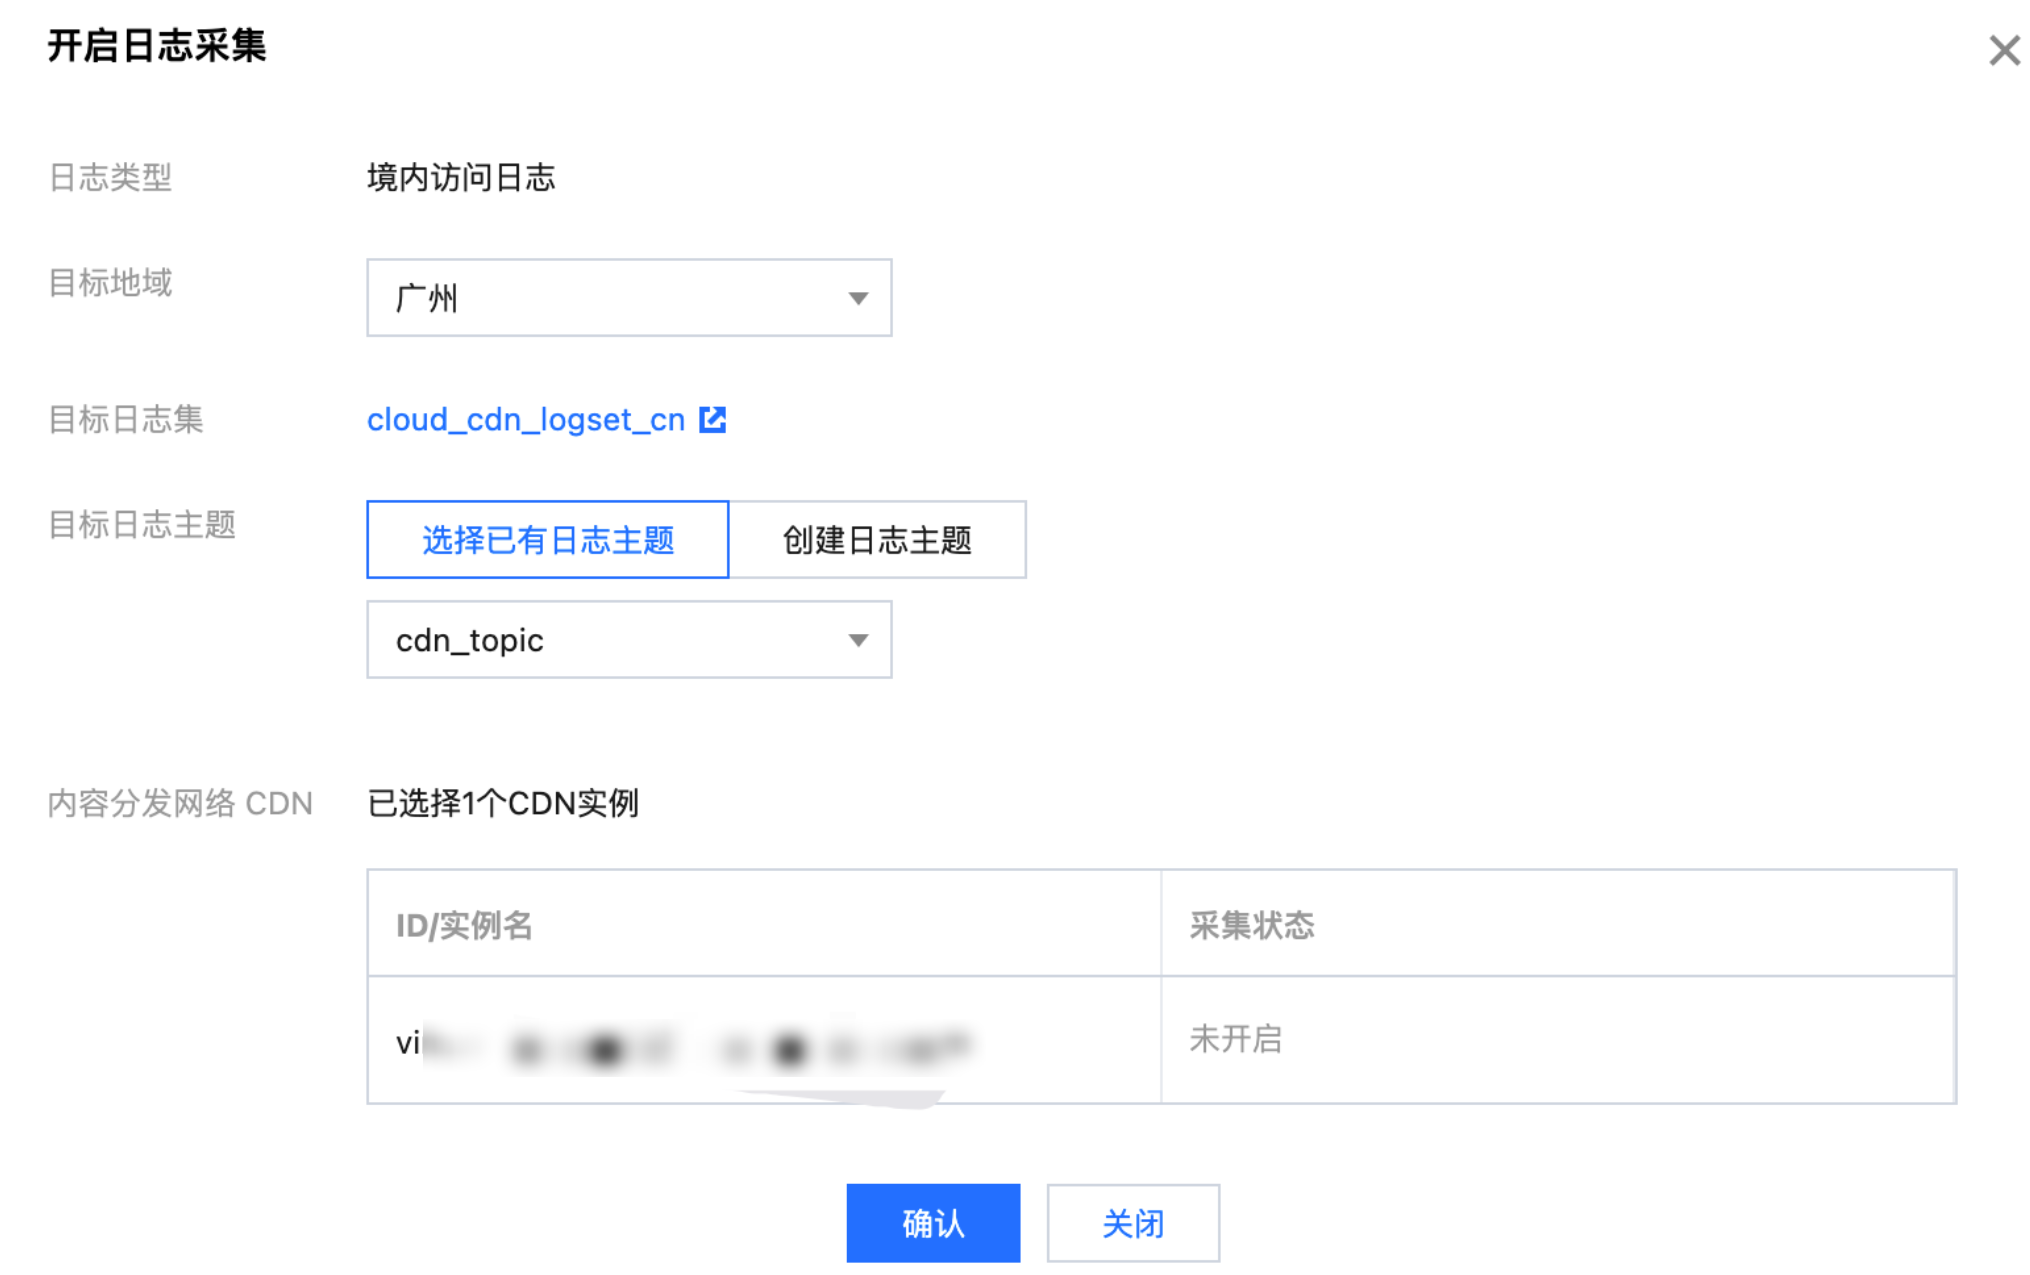
注意:
CDN 日志主题默认投递到cloud_cdn_logset_cn 日志集中统一管理。
查看 CDN 域名访问分析仪表盘
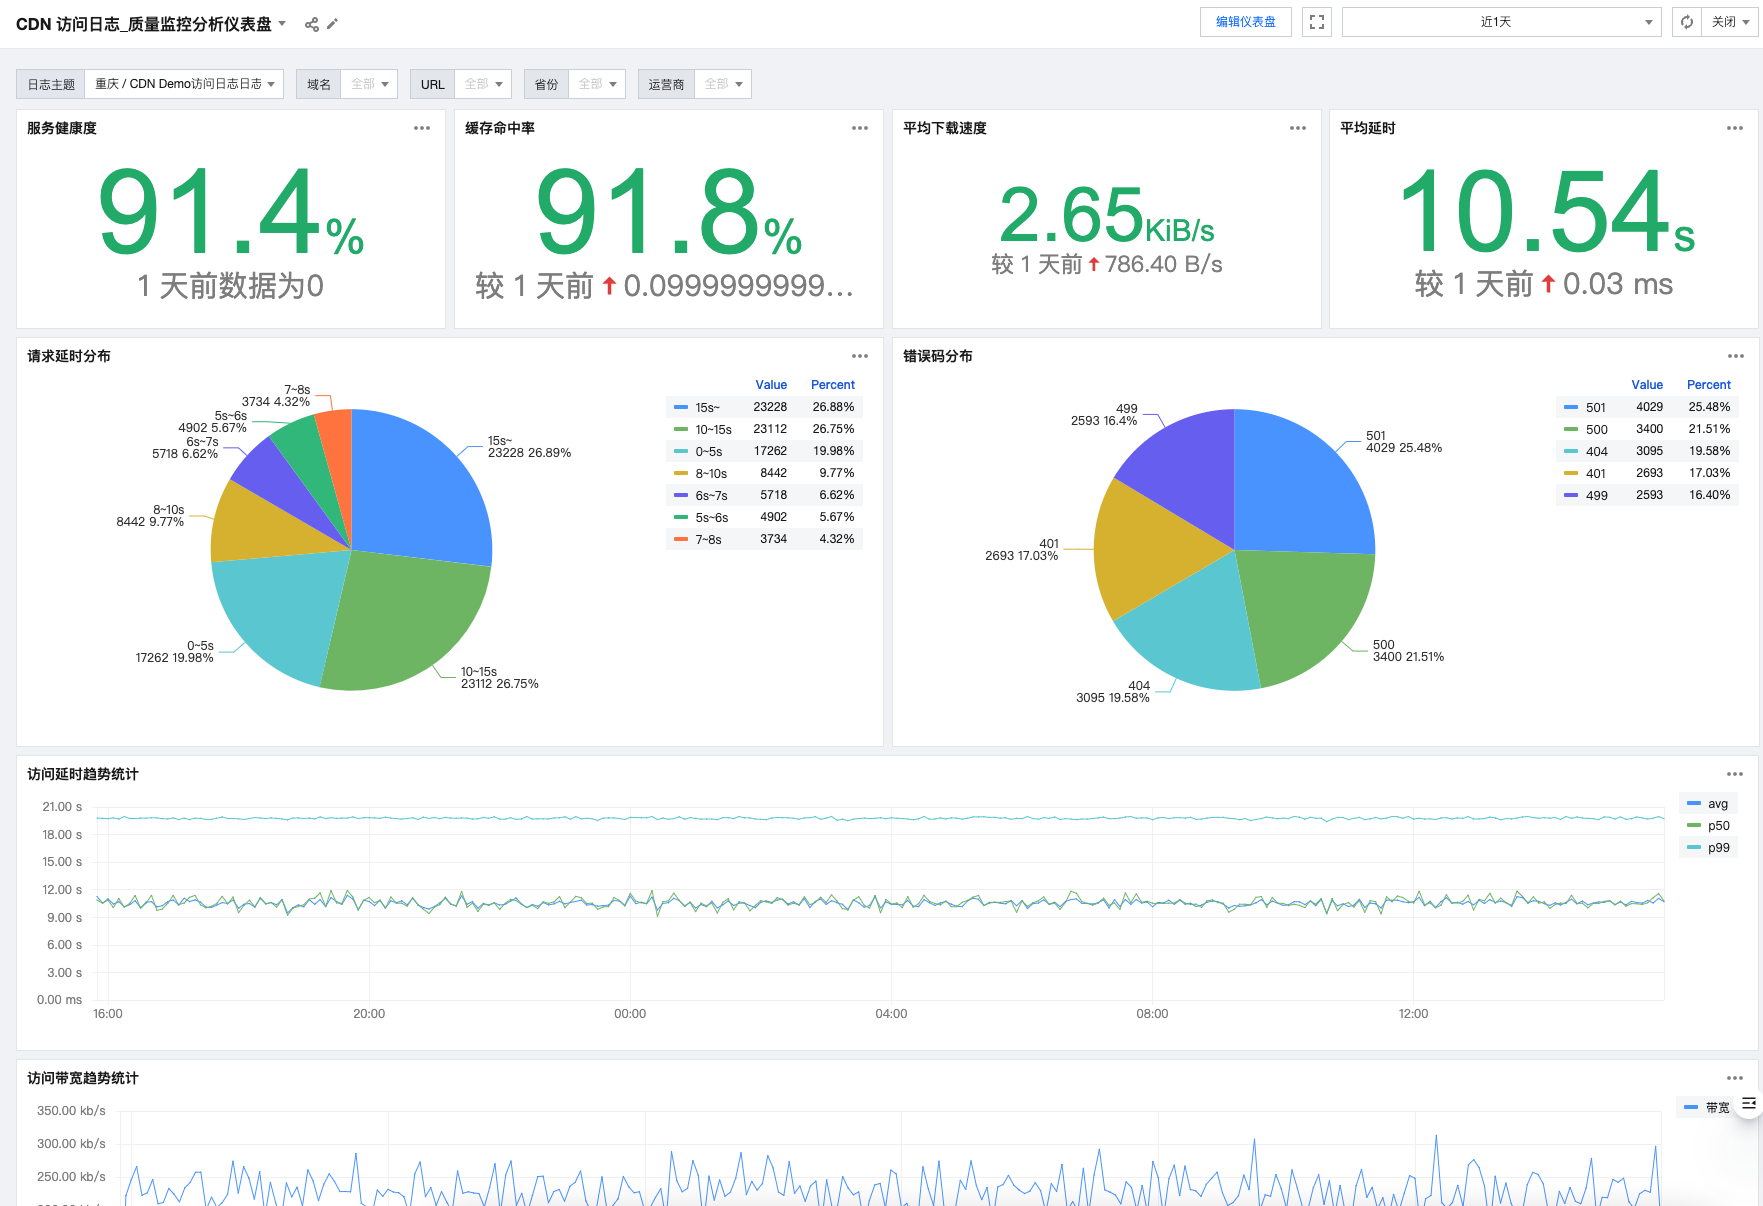
访问质量监控分析仪表盘:可视化展示 CDN 域名的访问质量情况(如缓存命中率、延时等),助力运维排障场景。
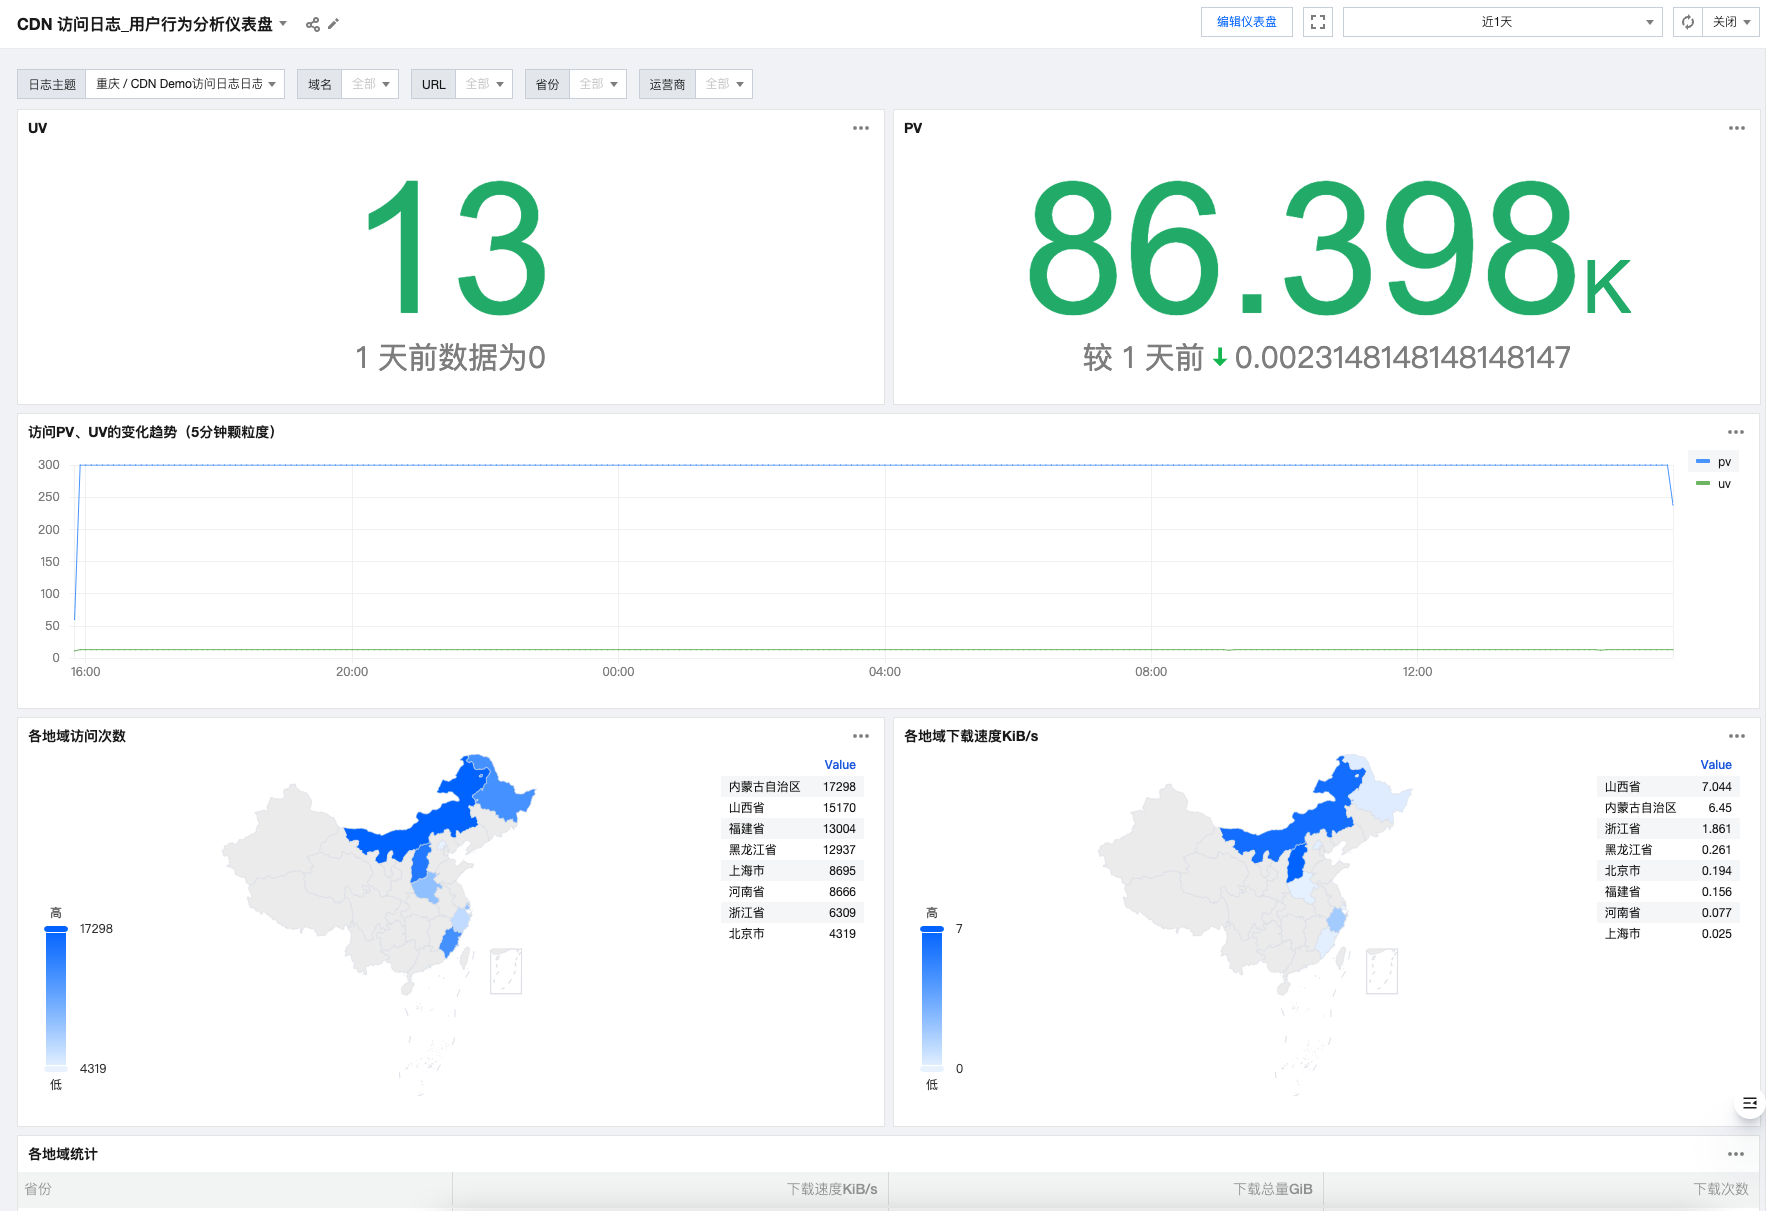
用户行为分析仪表盘:可视化展示用户的访问行为(如 PV、UV 等),助力运营分析场景。
您可通过以下操作操作查看以上 CDN 预置仪表盘:
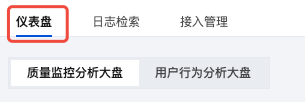
1. 页面上方 Tab 页单击仪表盘,选择质量监控分析仪表盘或用户行为分析仪表盘。
2. 在CDN 域名处选择已开启投递的域名
检索分析 CDN 域名访问日志
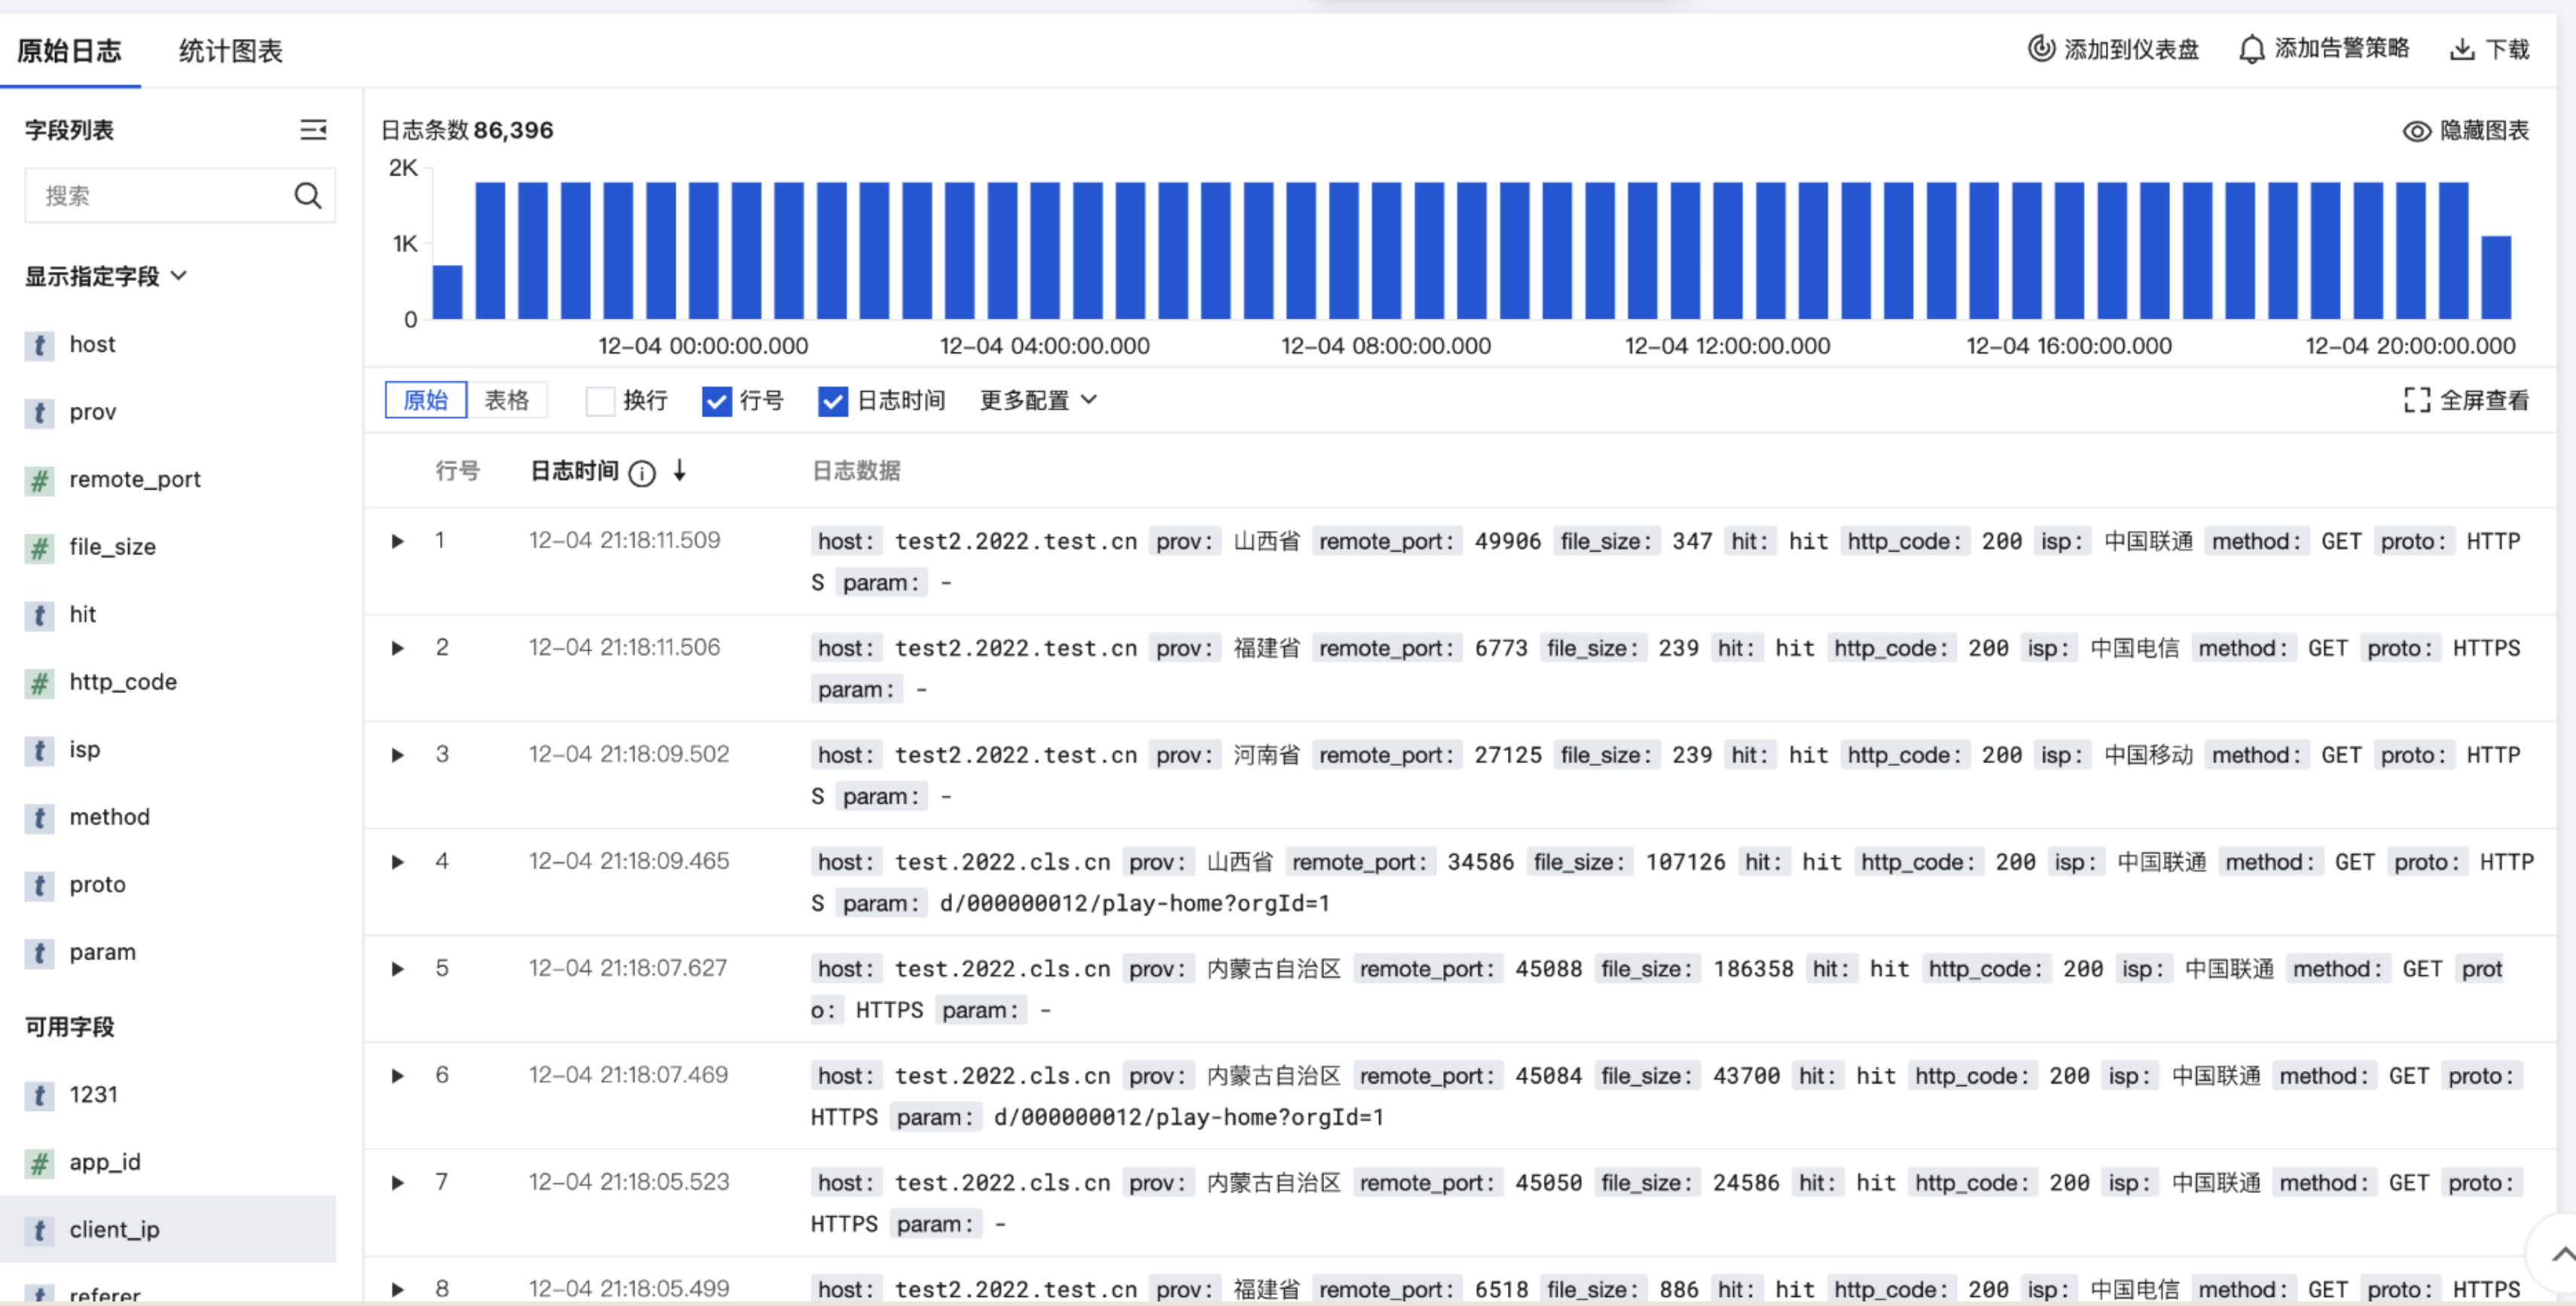
1. 完成开启域名访问日志采集后,在域名列表中,找到已开启访问日志采集的域名,单击日志检索。

2. 单击后将跳转至日志检索页,即可检索分析访问日志。日志字段的详细介绍请参见 日志字段说明。
日志字段说明
针对 CDN 访问日志中的字段解释,可参见下表:
字段名 | 说明 |
app_id | 腾讯云账号 APPID |
client_ip | 客户端 IP |
file_size | 文件大小 |
hit | 缓存 HIT / MISS,在 CDN 边缘节点命中、父节点命中均标记为 HIT |
host | 域名 |
http_code | HTTP 状态码 |
isp | 运营商 |
method | HTTP Method |
param | URL 携带的参数 |
proto | HTTP 协议标识 |
prov | 运营商省份 |
referer | Referer 信息,HTTP 来源地址 |
request_range | Range 参数,请求范围 |
request_time | 响应时间(毫秒),指节点从收到请求后响应回包所花费的时间 |
request_port | 客户端与 CDN 节点建立连接的端口。若无,则为 - |
rsp_size | 返回字节数 |
time | 请求时间,UNIX 时间戳,单位为:秒 |
ua | User-Agent 信息 |
url | 请求路径 |
uuid | 请求的唯一标识 |
version | CDN 实时日志版本 |
实践场景案例
您可以基于 CDN 访问日志配置异常监控告警,实时监控 CDN 访问流量中发生的异常。以下提供了两个案例。
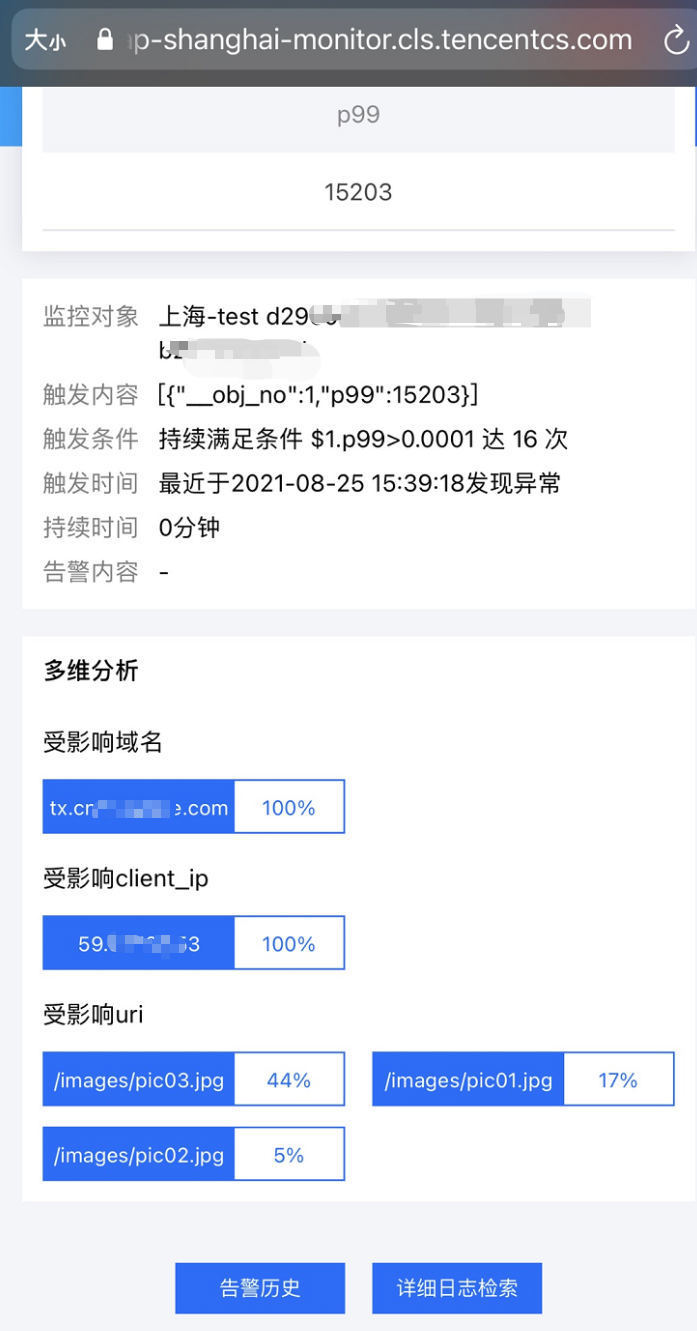
案例1:针对99%的延时大于100ms进行告警,并且在告警信息中展示受影响域名、url、client_ip,以便快速判断错误情况。
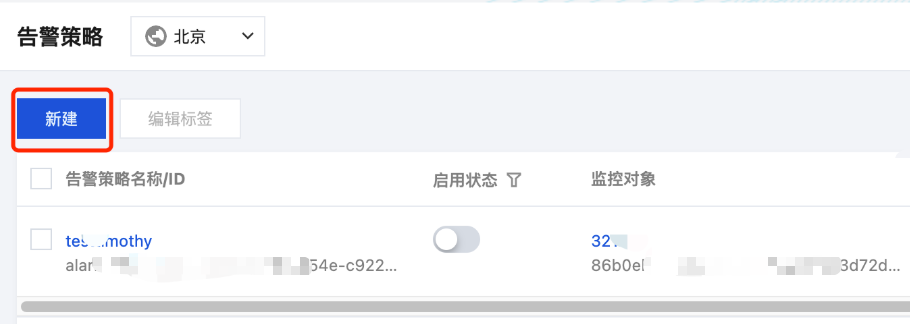
2. 在告警策略页中,配置如下内容:
基本信息
告警策略名称:CDN 访问延迟告警。
启用状态:启用。
监控对象:选中在 采集 CDN 访问日志 步骤中创建的日志主题。
监控任务
执行语句:输入以下语句,时间范围选择15分钟,统计近15分钟内的99%延时。
* | select approx_percentile(request_time, 0.99) as p99
触发条件: 配置如下,即99%延时大于100ms 时,满足告警条件。
$1.p99 > 100
执行周期:固定频率,每1分钟执行一次。
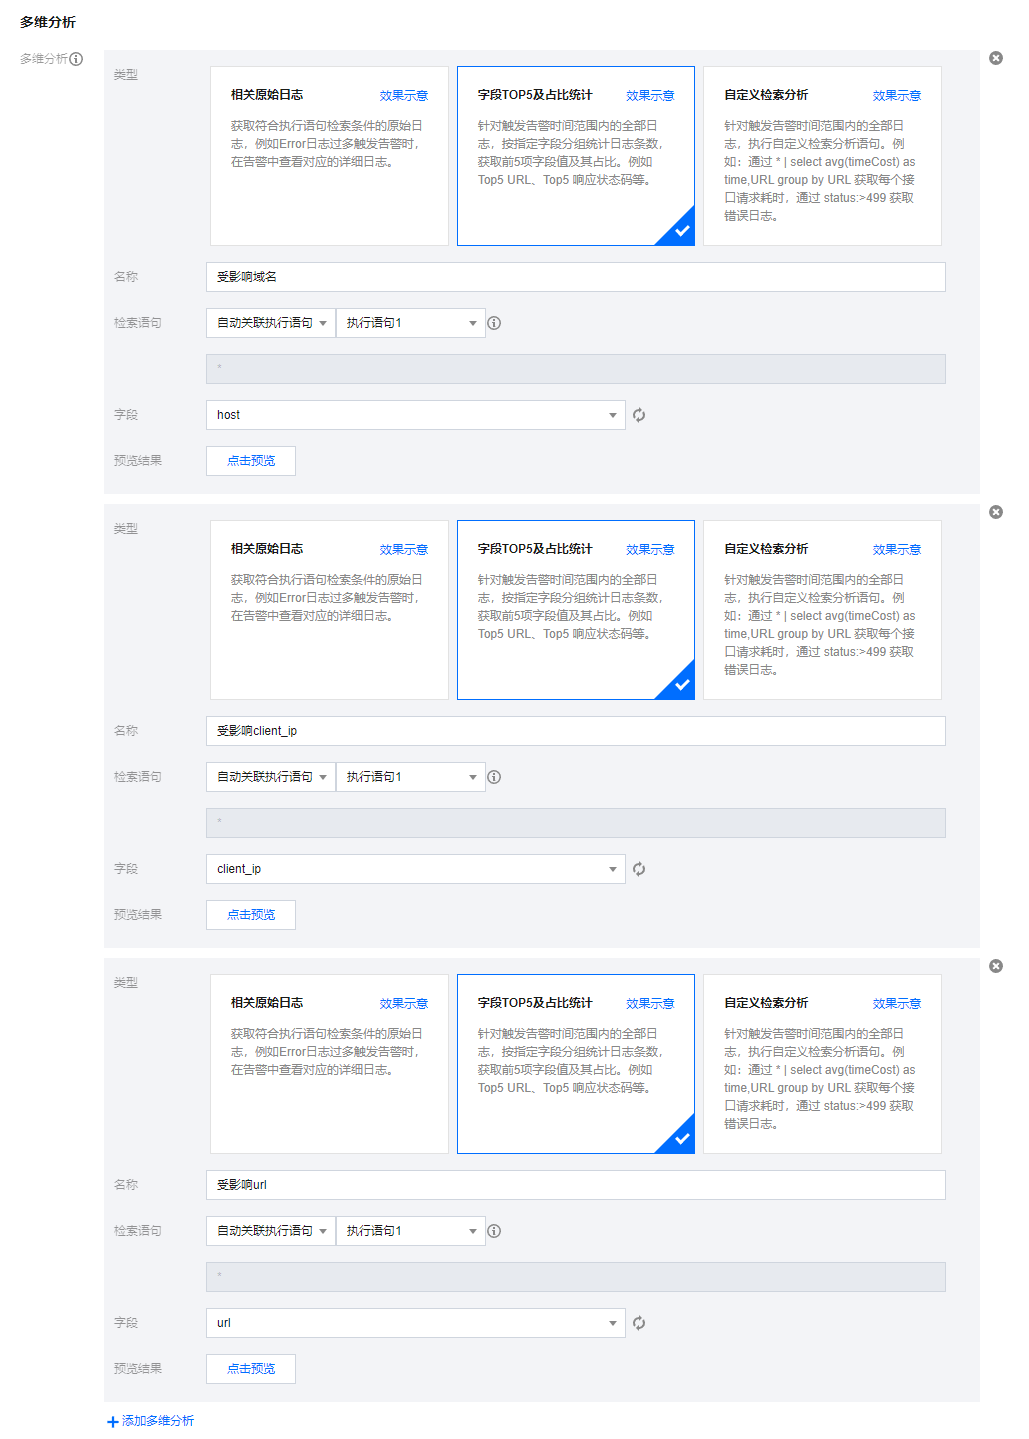
多维分析:在告警信息中展示受影响的域名、客户端 IP、url,帮助开发人员快速定位问题。
通知渠道组: 通过关联通知渠道组,设置发送通知的方式及对象,支持短信、邮件、电话、微信、企业微信、钉钉、飞书、自定义接口回调(webhook)等通知方式。详情参见 管理通知渠道组。
3. 告警触发后,将通过微信、企业微信、短信第一时间获取关键信息。
案例2:资源访问错误激增告警,当同比增数超过一定阈值时,触发告警通知。
2. 在执行语句中输入以下语句,时间范围选择1分钟,统计最近1分钟相比上1分钟的错误数增量。
http_code:>=400 | select compare[1]-compare[2] as errorCNTRise from (select compare(errorCNT,60) as compare from(select count(*) as errorCNT))
3. 触发条件如下,即错误数增量大于100时,满足告警条件。
$1.errorCNTRise > 100
Help and Support
Was this page helpful?
You can also Contact sales or Submit a Ticket for help.
Help us improve! Rate your documentation experience in 5 mins.
Feedback