Online debugging is now supported in the SCF Console, so you can debug and locate problems in the console easily.
Note:
Currently, online debugging can only be performed in Chrome and only supports Node.js 10.15 and Node.js 12.16.
Enabling Debugging Mode
Note
:
Before using the online debugging feature, you need to manually enable the debugging mode for the function. Doing so will change part of the function's original configuration, which will be restored after the debugging mode is disabled. This may affect your business; therefore, please be sure to understand the following:
The function will enter the single-instance mode. All its versions can respond to only one event at a time, and if the concurrency limit is exceeded, events will fail.
The execution timeout period is adjusted to 900s and cannot be set during debugging.
Multiple preset instances will be reduced to one single instance.
The execution performance of the function will be reduced after the debugging mode is enabled.
1. Log in to the SCF Console and select "Function Service" on the left sidebar.
2. At the top of the "Function Service" page, select the region of the function for which you want to enable the debugging mode and click the function name to enter the function details page.
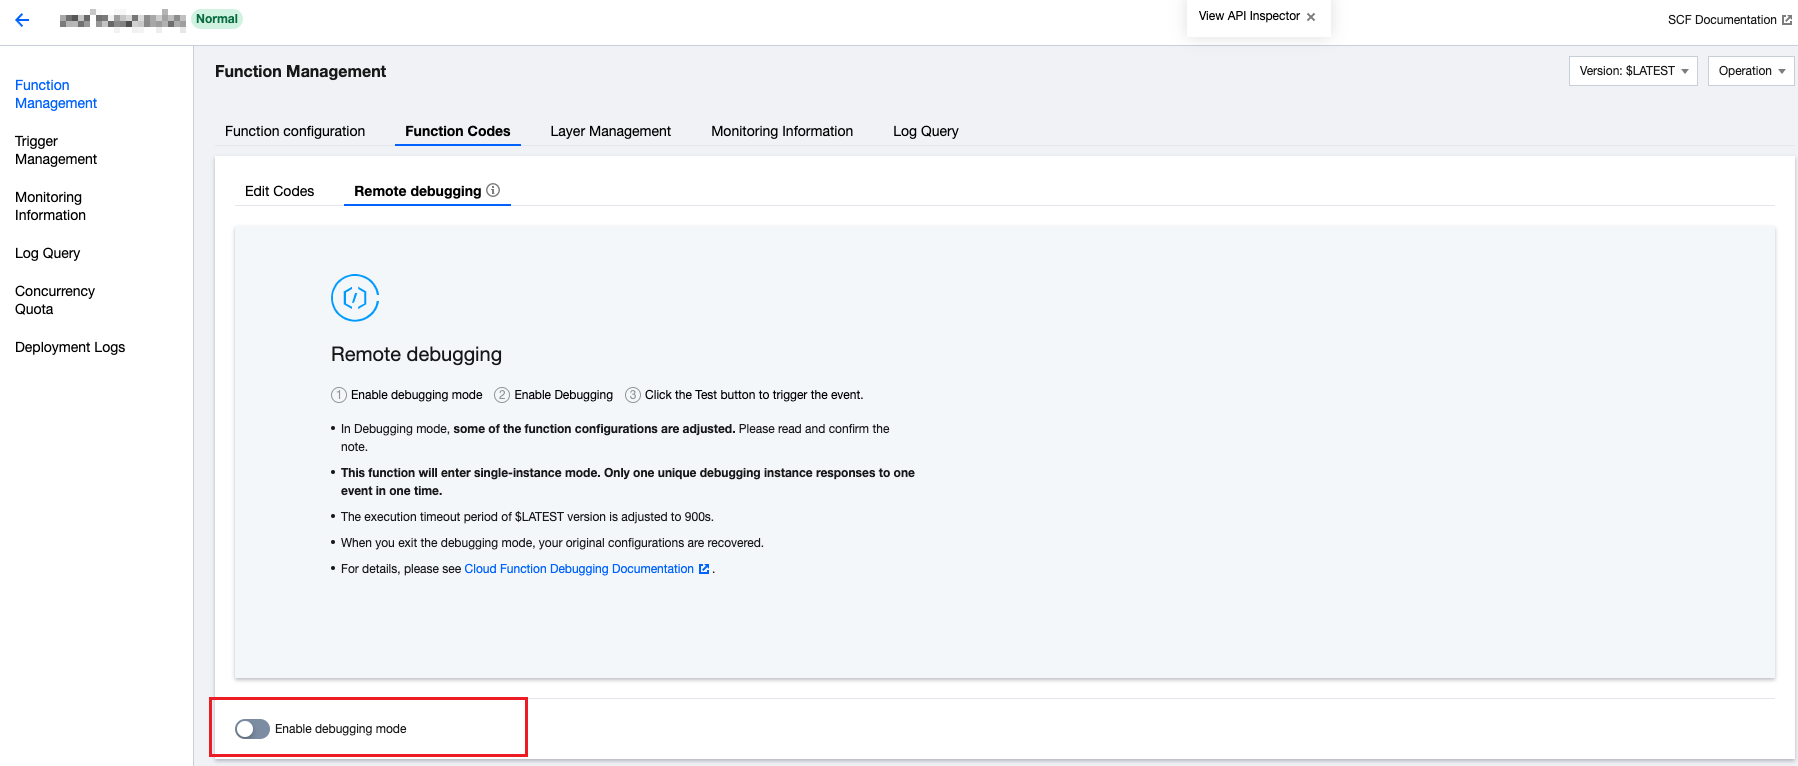
3. Select Function Code > Remote debugging on the "Function Management" page and click Enable debugging mode as shown below:
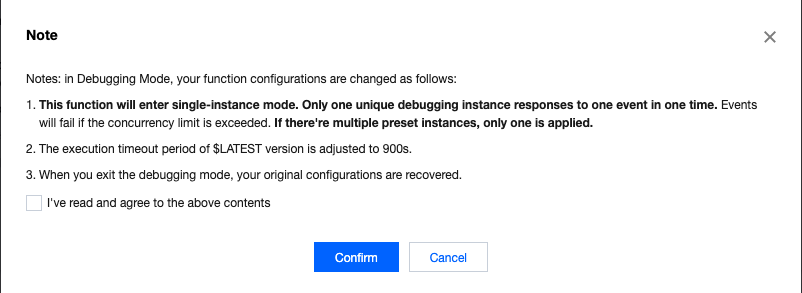
4. Click Confirm in the pop-up window to enable the debugging mode as shown below:
After the debugging mode is enabled, when you enter the debugging page again, you need to manually select Start debugging.
2. After the loading is completed, the page will automatically display the entry file. To open any file you want, use the keyboard shortcut Cmd + P (macOS) or Ctrl + P (Windows).
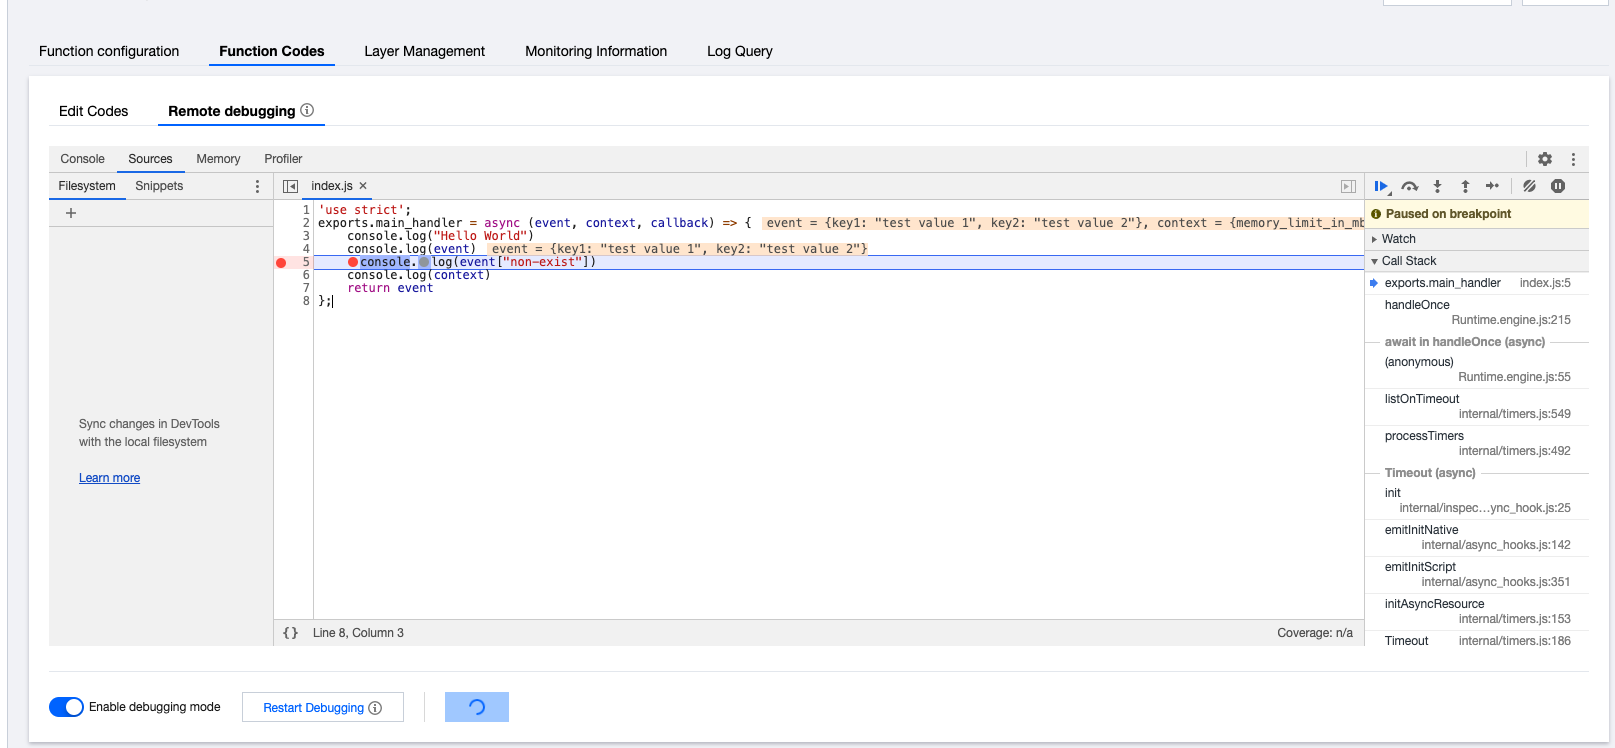
3. You can set breakpoints as needed and click Test to trigger the test based on the test template as shown below:
Note:
For more information on debugging tools, please see Chrome DevTools.
Disabling Debugging Mode
1. Select Function Code > Remote debugging on the "Function Management" page.
2. Toggle off Enable debugging mode to disable the debugging mode, and the original function configuration will be restored.
Note:
Code changes made on the debugging page will not be synced to the cloud. If you want to save the changed code, please save the changes and use the online code editing feature.
FAQs
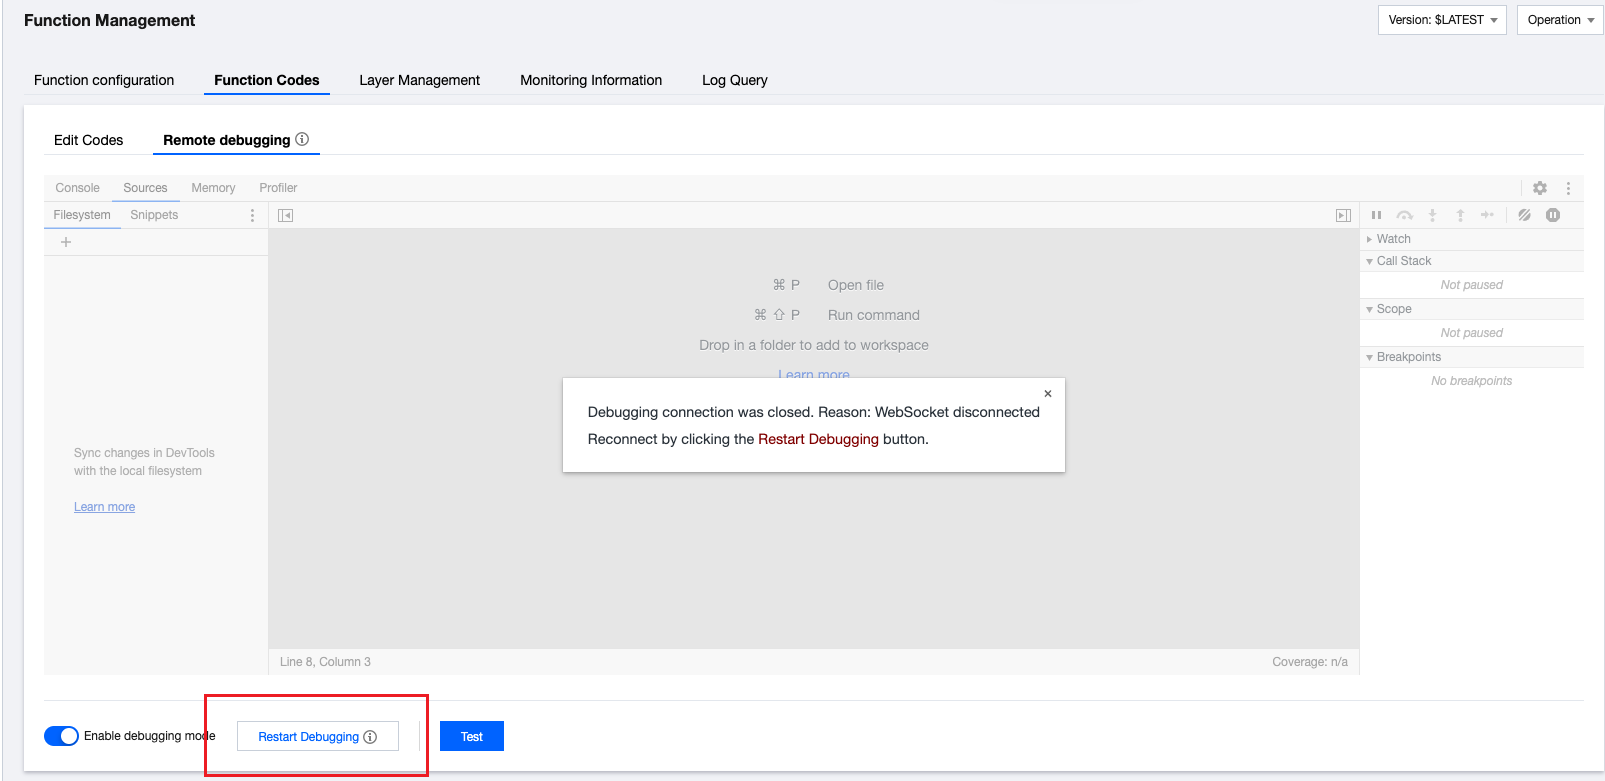
Due to network and code exceptions, the inspector may be disconnected. When an error like the one in the following figure occurs, you need to click Restart debugging to reconnect.
If your function runs normally, but you encounter an OOM error in the debugging mode, you need to increase the memory configured for the function. This way, you can solve the problem of insufficient memory caused by the fact that the function requires more memory in the debugging mode.