- Release Notes
- Product Introduction
- Purchase Guide
- Getting Started
- Operation Guide
- Origin Server Management
- Access Management
- Access Acceleration Connection
- Connection Group Management
- Statistics
- Configuring Permissions
- Access Tencent Cloud Observability Platform
- Certificate Management
- Obtaining Real Client IP
- Country/Region Mapping
- API Documentation
- History
- Introduction
- API Category
- Making API Requests
- Origin Server APIs
- Listener APIs
- ModifyUDPListenerAttribute
- ModifyTCPListenerAttribute
- ModifyHTTPSListenerAttribute
- ModifyHTTPListenerAttribute
- DescribeUDPListeners
- DescribeTCPListeners
- DescribeListenerRealServers
- DescribeHTTPSListeners
- DescribeHTTPListeners
- DeleteListeners
- CreateUDPListeners
- CreateTCPListeners
- CreateHTTPSListener
- CreateHTTPListener
- BindListenerRealServers
- Rule APIs
- SetAuthentication
- ModifyRuleAttribute
- ModifyDomain
- ModifyCertificate
- DescribeRules
- DescribeRuleRealServers
- DeleteRule
- DeleteDomain
- CreateRule
- CreateDomain
- BindRuleRealServers
- DescribeDomainErrorPageInfo
- DeleteDomainErrorPageInfo
- CreateDomainErrorPageInfo
- DescribeRulesByRuleIds
- DescribeDomainErrorPageInfoByIds
- DescribeCustomHeader
- DescribeBlackHeader
- CreateCustomHeader
- Connection Group APIs
- Connection APIs
- OpenSecurityPolicy
- OpenProxies
- ModifySecurityRule
- ModifyProxyConfiguration
- ModifyProxiesProject
- ModifyProxiesAttribute
- InquiryPriceCreateProxy
- DestroyProxies
- DescribeSecurityPolicyDetail
- DescribeProxyDetail
- DescribeProxyAndStatisticsListeners
- DescribeProxiesStatus
- DescribeProxies
- DescribeDestRegions
- DescribeAccessRegionsByDestRegion
- DescribeAccessRegions
- DeleteSecurityRules
- DeleteSecurityPolicy
- CreateSecurityRules
- CreateSecurityPolicy
- CreateProxy
- CloseSecurityPolicy
- CloseProxies
- CheckProxyCreate
- DescribeSecurityRules
- Certificate APIs
- Other APIs
- Data Types
- Error Codes
- Service Agreement
- FAQs
- Contact Us
- Glossary
Log in to the GAAP console. Enter the Statistics page.
This page provides the following dimensions: Connection, connection group, listener, origin server, and domain name.
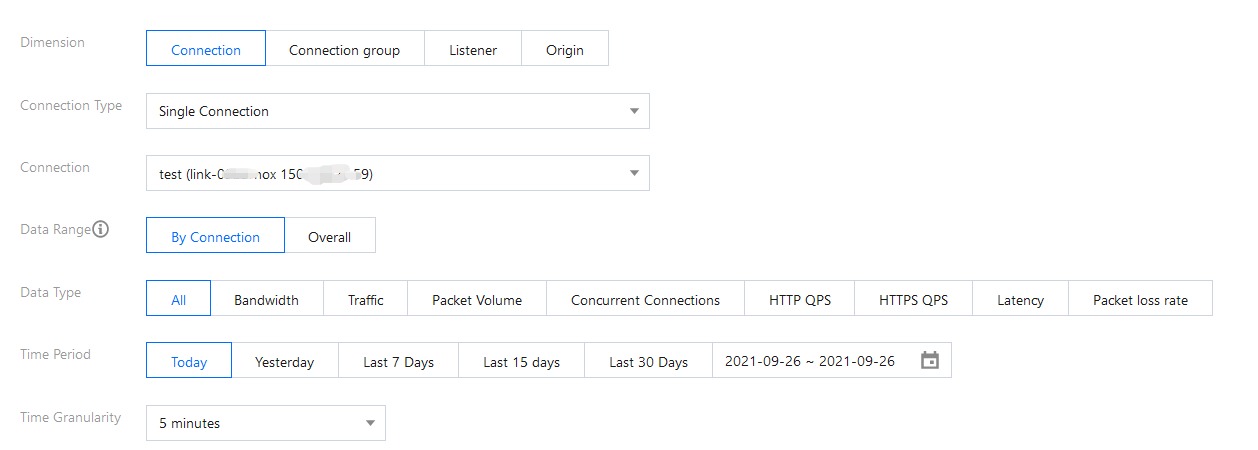
Connection
You can view the connection statistics, as shown below:
- Connection Type: It defaults to single connection. You can also select a connection group that has been created before.
- Connection: Select a connection of the Access Management or of the connection group.
- Data Type: Select one or all data types (bandwidth, traffic, packet volume, concurrent connections, HTTP QPS, HTTPS QPS, latency, and packet loss rate).
- Time Period: Select a time period.
- Time Granularity: Select a time granularity. Supported options: 1 minute, 5 minutes, 1 hour, and 1 day.
[ The maximum query time is 1 day if you select a 1-minute granularity, 3 days for a 5-minute granularity, 15 days for a 1-hour granularity and 186 days for a 1-day granularity. ]
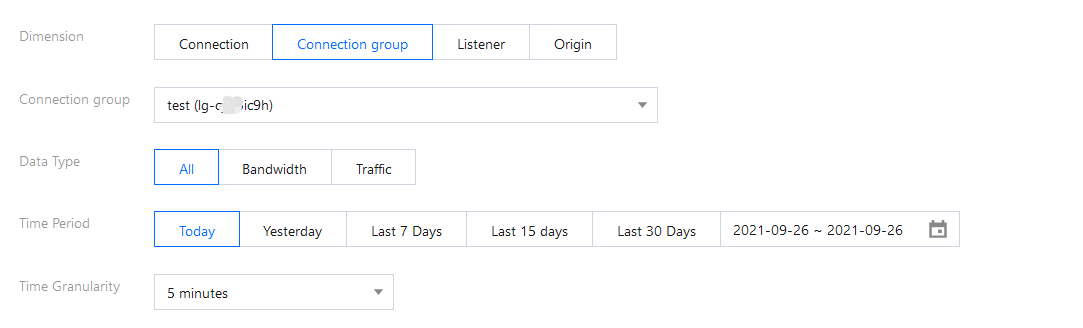
Connection Group
You can view the connection group statistics, as shown below:
- Connection Group: Select one or more connection groups.
- Data Type: Select one or all data types (bandwidth and traffic).
- Time Period: Select a time period.
- Time Granularity: Select a time granularity. Supported options: 1 minute, 5 minutes, 1 hour, and 1 day.
[ The maximum query time is 1 day if you select a 1-minute granularity, 3 days for a 5-minute granularity, 15 days for a 1-hour granularity and 186 days for a 1-day granularity. ]
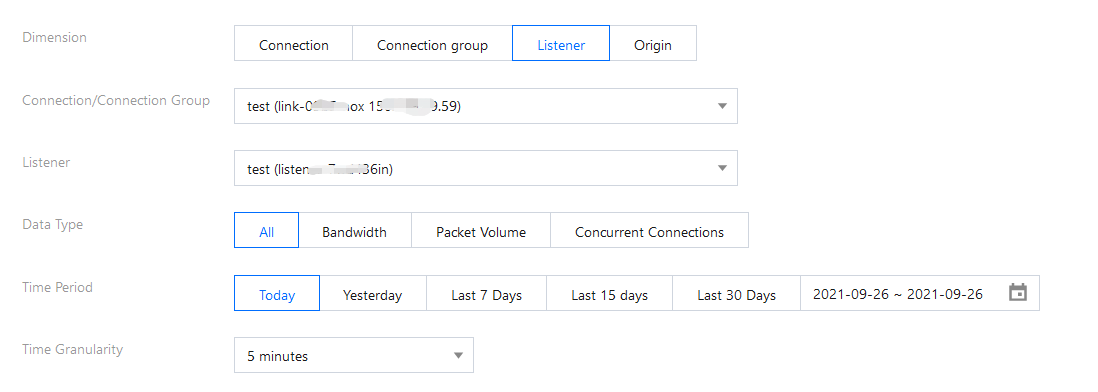
Listener
You can view the listener statistics, as shown below:
- Connection/Connection Group: Select a connection or connection group for the listener.
- Listener: Select a listener.
- Data Type: Select one or all data types (bandwidth, packet volume, concurrent connections).
- Time Period: Select a time period.
- Time Granularity: Select a time granularity. Supported options: 1 minute, 5 minutes, 1 hour, and 1 day.
[ The maximum query time is 1 day if you select a 1-minute granularity, 3 days for a 5-minute granularity, 15 days for a 1-hour granularity and 186 days for a 1-day granularity. ]
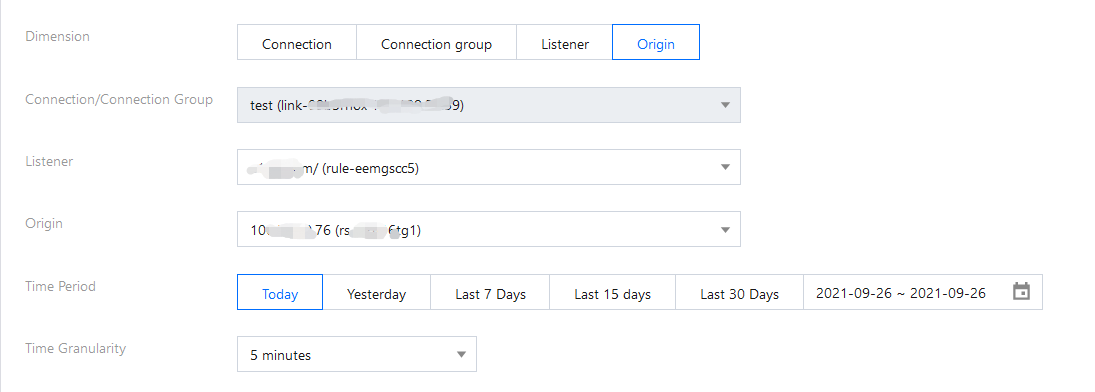
Origin Server
You can view the statistics of the bound origin server when it is healthy.
- Connection/Connection Group: Select a connection or connection group for the origin server.
- Listener: Select a listener for the origin server.
- Origin: Select an origin server.
- Time Period: Select a time period.
- Time Granularity: Select a time granularity. Supported options: 1 minute and 5 minutes.
[ The maximum query time is 1 day if you select a 1-minute granularity, and 31 days for a 5-minute granularity. ]
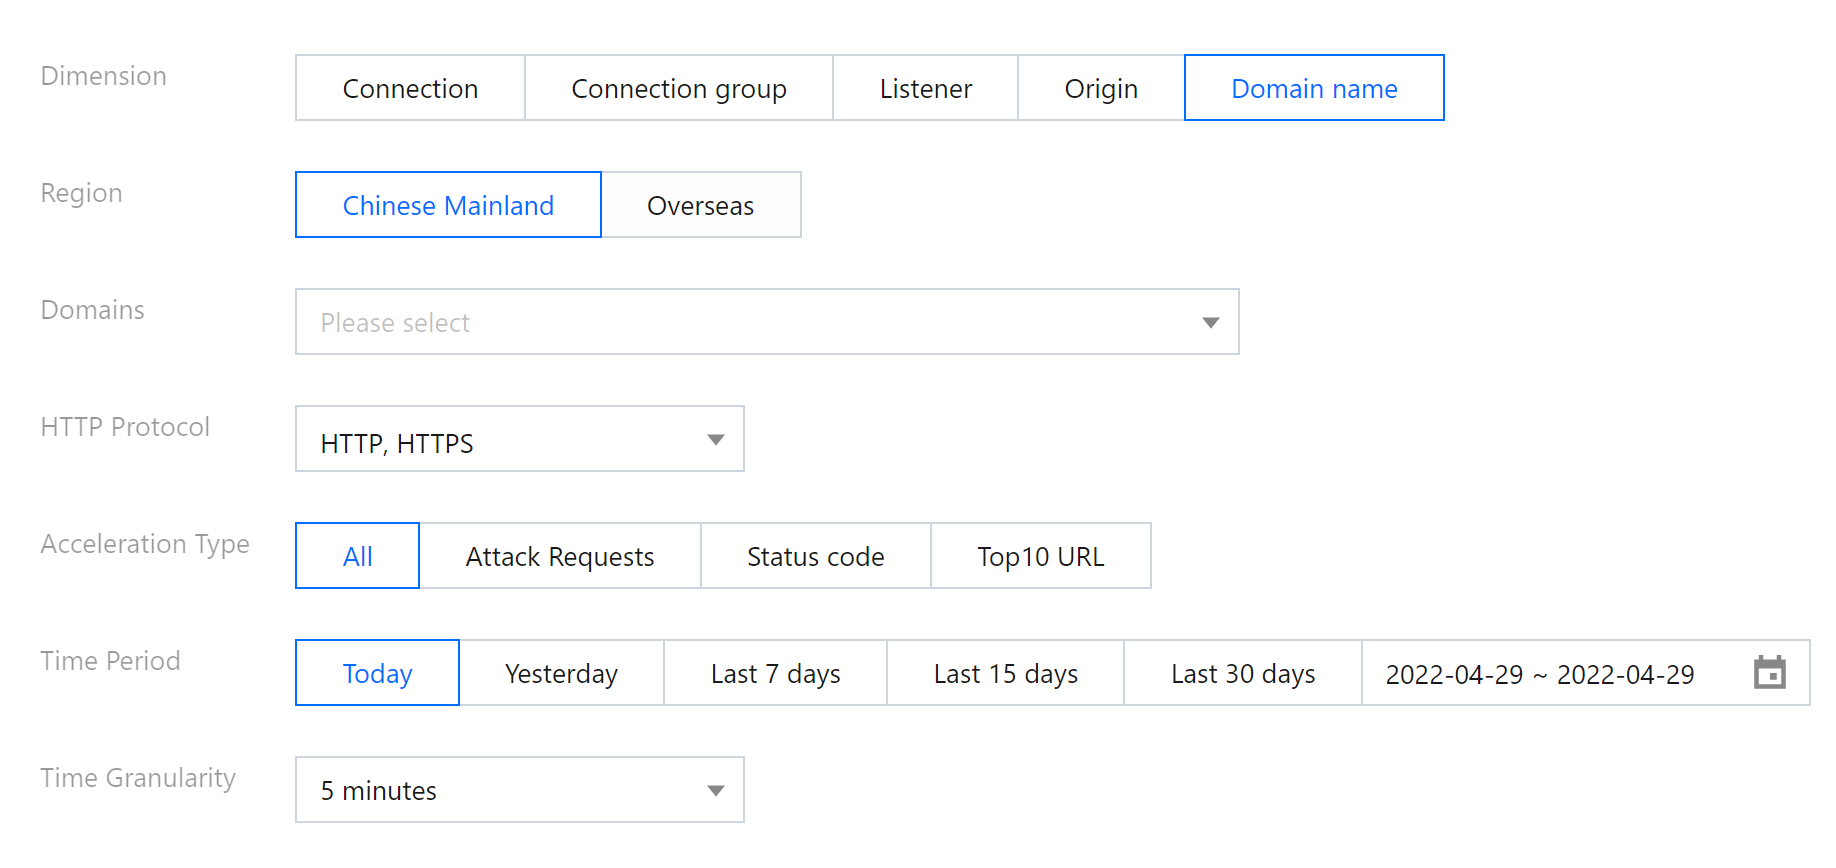
Domain Name
You can view the statistics of the domain names in the HTTP/HTTPS listener configuration, as shown below:
- Region: Select Chinese mainland or Outside the Chinese mainland.
- Domains: Select one or multiple domain names.
- HTTP Protocol: Select one or all HTTP protocols.
- Data Type: Select one or all data types (requests, status code and top 10 URLs).
- Time Period: Select a time period.
- Time Granularity: Select a time granularity. Supported options: 1 minute, 5 minutes, 1 hour, and 1 day.
[ The maximum query time is 1 day if you select a 1-minute granularity, 3 days for a 5-minute granularity, 15 days for a 1-hour granularity and 186 days for a 1-day granularity. ]
Exporting Data
Enter the Statistics page, and click the download icon to export data.
Configuring an Alarm Policy
Enter the Statistics page, and click Configure Alarm in the top right corner to configure an alarm policy. For more details, see Access Cloud Monitoring.

 Yes
Yes
 No
No
Was this page helpful?