Monitor a monitoring instance (Redis/ValKey edition)
Download
Focus Mode
Font Size
Last updated: 2026-03-17 18:10:56
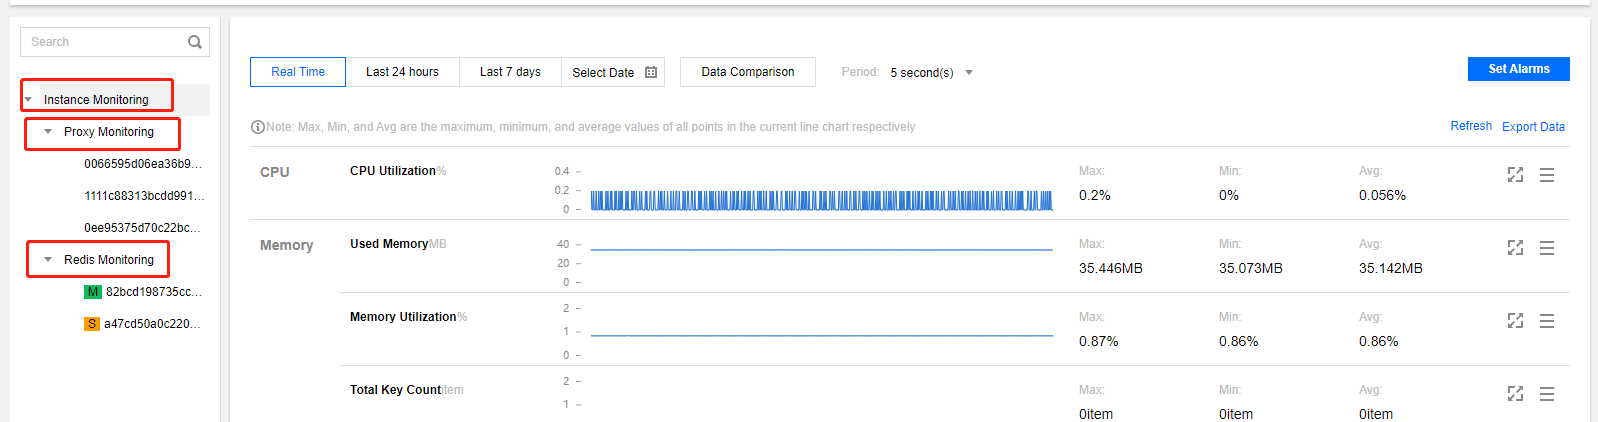
Tencent Cloud Distributed Cache Redis/Valkey edition provides complete and transparent monitoring services. The new version (supporting 5-second monitoring granularity) provides monitoring including Proxy node monitoring, Redis node monitoring, and instance monitoring summary. Details are as follows:
Proxy node monitoring: Tencent Cloud Distributed Cache Both standard architecture and cluster architecture include Proxy, and the monitoring service provides monitoring information for all Proxy nodes of the instance.
Redis node monitoring: Redis nodes include monitoring information for both master nodes and replica nodes.
Instance Monitoring: Instance monitoring aggregates the monitoring data of the entire instance, including Proxy node and Redis node monitoring data, which is aggregated through aggregation algorithms such as SUM, AVG, MAX, and LAST.
View Instance Monitoring Granularity
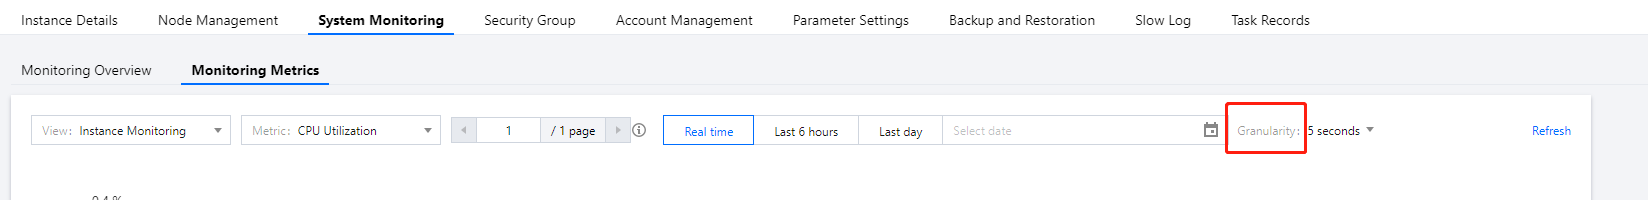
View via the Tencent Cloud Distributed Cache console: Click the instance ID to go to the instance management page, and choose the System Monitoring > Monitoring Metrics page. Redis currently supports monitoring metrics at granularities of 5 seconds, 1 minute, 5 minutes, 1 hour, and 1 day. For the retention period of monitoring data at each granularity, see Usage Constraints.
By checking the field InstanceSet.MonitorVersion returned by the DescribeInstances API: MonitorVersion = 5s indicates 5-second granularity; MonitorVersion = 1m indicates 1-minute granularity.
Viewing Monitoring Data
You can view the monitoring information of Distributed Cache through the instance list, the system monitoring page, and the Tencent Cloud TCOP console respectively.
Quickly View Monitoring Data Through the Instance List
2. At the upper part of the Instance List page on the right, select a region.
3. In the instance list, find the target instance.
4. Click the Instance ID in blue font to go to the Instance Details page, click the System Monitoring tab, then select the Monitoring Metrics tab to view monitoring data.
Each Redis instance contains at least three Proxy nodes. Usually, the number of Proxy nodes is 1.5 times that of Redis nodes. Proxy nodes provide the following monitoring information.
Category
Metric
Metric Name
Unit
Metric Description
CPU
CPU utilization
cpu_util
%
Proxy CPU utilization.
Request
Total number of requests
proxy_commands
Times/second
Number of commands executed by Proxy.
Number of key requests
cmd_key_count
Counts/second
Number of keys accessed by the command.
Number of MGET requests
cmd_mget
Times/second
Number of MGET command executions.
Execution error
cmd_err
Times/second
Number of Proxy command execution errors, such as nonexistent commands and parameter errors.
Large value requests
cmd_big_value
Times/second
Number of executions of request commands with the size greater than 32 KB.
Network monitoring
Number of connections
connections
-
Number of TCP connections to the instance.
Connection utilization
connections_util
%
Ratio of the actual TCP connections to the maximum number of connections.
Maximum Connection Utilization of the Node
connections_max_util
%
The maximum value of the connection utilization ratio (current connections / maximum connections) among all Proxy nodes.
Inbound traffic
in_flow
Mb/s
Traffic flowing into the database per second.
Inbound traffic utilization
in_bandwidth_util
%
The ratio of the actually used private network inbound traffic to the maximum bandwidth
Throttling-triggered inbound traffic
in_flow_limit
Times
Number of times when the inbound traffic exceeds the maximum bandwidth.
Outbound traffic
out_flow
Mb/s
Traffic flowing out of the database per second.
Outbound traffic utilization
out_bandwidth_util
%
The ratio of actual outbound traffic usage to maximum bandwidth
Outbound traffic throttling trigger
out_flow_limit
Times
Number of times when outbound traffic exceeds the maximum bandwidth.
Latency monitoring
Average execution latency
latency_avg
ms
The average execution latency from the Proxy to the Redis Server.
Maximum execution latency
latency_max
ms
The maximum execution latency from the Proxy to the Redis Server.
Average read latency
latency_read
ms
The average execution latency of read commands from the Proxy to the Redis server. For read command classification, see Command Classification.
Average write latency
latency_write
ms
The average execution latency of write commands from the Proxy to the Redis server. For write command classification, see Command Classification.
Average latency of other commands
latency_other
ms
Average execution latency of commands other than read and write commands from Proxy to the Redis server.
DB Node Monitoring
Redis node monitoring provides monitoring information for all primary nodes and secondary nodes of the entire instance/cluster, and provides the following monitoring metrics:
Category
Metric
Metric Name
Unit
Metric Description
CPU monitoring
CPU utilization
cpu_util
%
Average CPU utilization.
Network
Number of connections
connections
-
Number of connections from Proxy to the node.
Connection utilization
connections_util
%
Node connection utilization.
Memory monitoring
Memory usage
mem_used
MB
Memory capacity actually used, including data and cache
Memory utilization
mem_util
%
Ratio of actual memory usage to total memory requested.
Memory tilt rate
mem_slope_util
%
Count the ratio of each shard primary node's memory usage to the average memory usage of all shard primary nodes
Note:
If the monitoring metric is greater than 100%, it means that the node is tilted.
Total number of keys
keys
Count
Total number of keys stored in an instance (first-level keys).
Number of expired keys
expired
Count
Number of keys evicted within the time window, corresponding to the expired_keys generated by the info command.
Number of evicted keys
evicted
Count
Number of keys evicted within the time window, corresponding to the evicted_keys generated by the info command.
The number of keys with expiration time set
expires
unit
The number of keys (primary key) with expiration time set in the instance
Replication Delay
repl_delay
Byte
The relative command delay length of the replica node to the primary node
Number of executions of commands other than read and write commands.
Total request tilt rate
qps_slope_util
%
Count the ratio of the request quantities for each shard primary node to the those for all shard primary nodes.
Note:
If replica read-only is enabled, the statistics will include the quantities of read requests from the replica read-only nodes, that is, the average number of requests from each shard primary node and its replica read requests is calculated, and then the ratio of each shard or replica read node to the average is counted.
If the monitoring metric is greater than 100%, it means that the node is tilted.
Response monitoring
Slow query
cmd_slow
Times
Number of command requests with the execution latency greater than the value of slowlog-log-slower-than.
Read request hit
cmd_hits
Times
Number of read requests where keys exist, corresponding to the keyspace_hits metric generated by the info command.
Read request miss
cmd_miss
Times
Number of read requests where keys do not exist, corresponding to the keyspace_misses metric generated by the info command.
Read request hit rate
cmd_hits_ratio
%
Key hits / (Key hits + Key misses), this metric can reflect the Cache Miss situation.
Redis Instance Monitoring
Instance monitoring summarizes the monitoring data of the entire instance. The monitoring data of Proxy nodes and Redis nodes is aggregated by using aggregation algorithms such as SUM, AVG, MAX, and LAST.
Category
Metric Name
Associated View
Parameter
Unit
Metric Description
CPU monitoring
CPU utilization
Redis node
cpu_util
%
Average CPU utilization.
Maximum CPU utilization of nodes
Redis node
cpu_max_util
%
Maximum CPU utilization of nodes (shards or replicas) in the instance
Memory monitoring
Memory usage
Redis node
mem_used
MB
Memory capacity actually used, including data and cache
Memory utilization
Redis node
mem_util
%
Ratio of actual memory usage to total memory requested.
Maximum memory utilization of nodes
Redis node
mem_max_util
%
Maximum memory utilization of nodes (shards or replicas) in the instance
Total number of keys
Redis node
keys
Count
Total number of keys stored in an instance (first-level keys).
Number of expired keys
Redis node
expired
Count
Number of keys evicted within the time window, corresponding to the expired_keys generated by the info command.
Number of evicted keys
Redis node
evicted
Count
Number of keys evicted within the time window, corresponding to the evicted_keys generated by the info command.
The number of keys with expiration time set
Redis node
expires
unit
The number of keys (primary key) with expiration time set in the instance
Network monitoring
Number of connections
Proxy node
connections
-
Number of TCP connections to the instance.
Connection utilization
Proxy node
connections_util
%
Ratio of the actual number of TCP connections to the maximum number of connections
Inbound traffic
Proxy node
in_flow
Mb/s
Traffic flowing into the database per second.
Inbound traffic utilization
Proxy node
in_bandwidth_util
%
The ratio of the actually used private network inbound traffic to the maximum bandwidth
Inbound traffic throttling triggering
Proxy node
in_flow_limit
Times
Number of times when the inbound traffic exceeds the maximum bandwidth.
Outbound traffic
Proxy node
out_flow
Mb/s
Traffic flowing out of the database per second.
Outbound traffic utilization
Proxy node
out_bandwidth_util
%
The ratio of actual outbound traffic usage to maximum bandwidth
Outbound traffic throttling trigger
Proxy node
out_flow_limit
Times
Number of times when outbound traffic exceeds the maximum bandwidth.
Latency
Average execution latency
Proxy node
latency_avg
ms
The average execution latency from the Proxy to the Redis Server.
Maximum execution latency
Proxy node
latency_max
ms
The maximum execution latency from the Proxy to the Redis Server.
Average read latency
Proxy node
latency_read
ms
The average execution latency of read commands from the Proxy to the Redis server. For read command classification, see Command Classification.
Average write latency
Proxy node
latency_write
ms
The average execution latency of write commands from the Proxy to the Redis server. For write command classification, see Command Classification.
Average latency of other commands
Proxy node
latency_other
ms
Average execution latency of commands other than read and write commands from Proxy to the Redis server.
P99 latency
Proxy node
latency_p99
ms
The 99% water level line of the execution latency from proxies to the Redis server.
When node failover occurs within the instance or in scenarios such as capacity expansion, scale-in, or migration, the node IDs of Proxy and Redis will change; therefore, it is necessary to promptly obtain the latest node information from the API.