Monitoring Through Grafana
Download
Focus Mode
Font Size
Grafana is a cross-platform, open-source visualization and analysis tool, which is currently one of the most popular data display tools for network architecture and application analysis, mainly used for visualized display of large-scale metric data. For more information, see Grafana Service. Using only monitoring data of Prometheus may not be sufficiently intuitive; as a result, combining it with Grafana for data visualization and further processing allows for more efficient monitoring. The Grafana version used in this practice is 10.2.6.
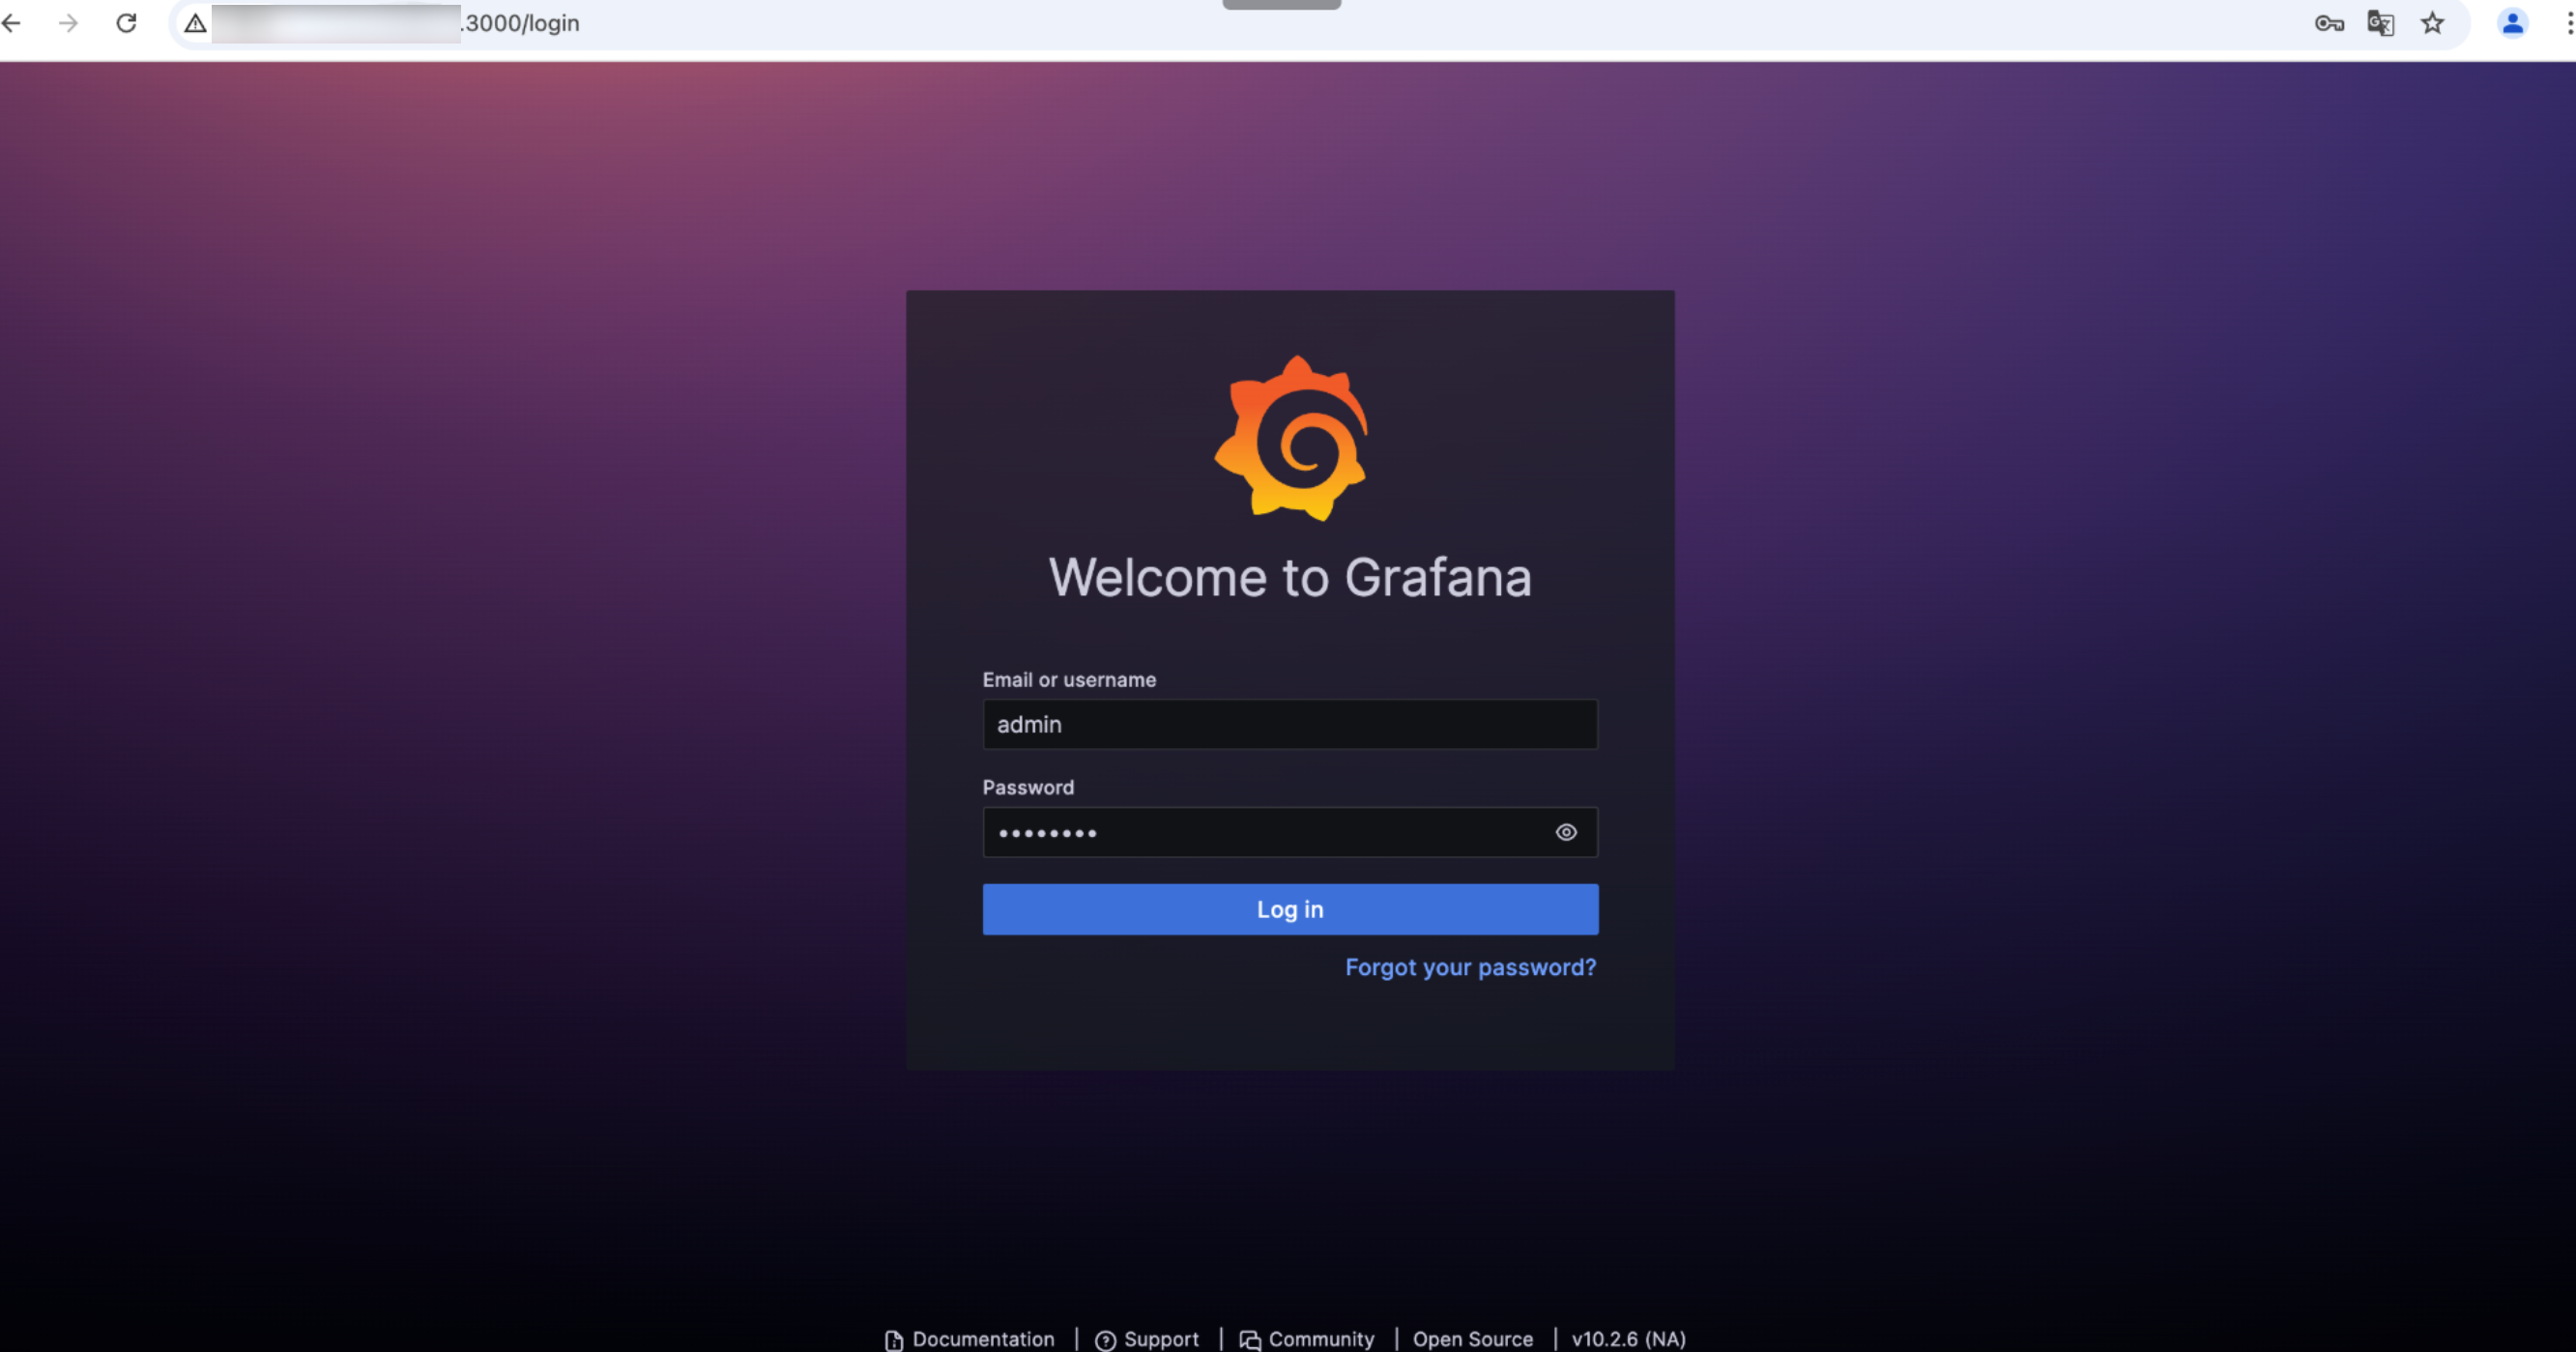
Starting Up Grafana
Access port 3000 through the browser, enter the login account and password, and start Grafana monitoring.
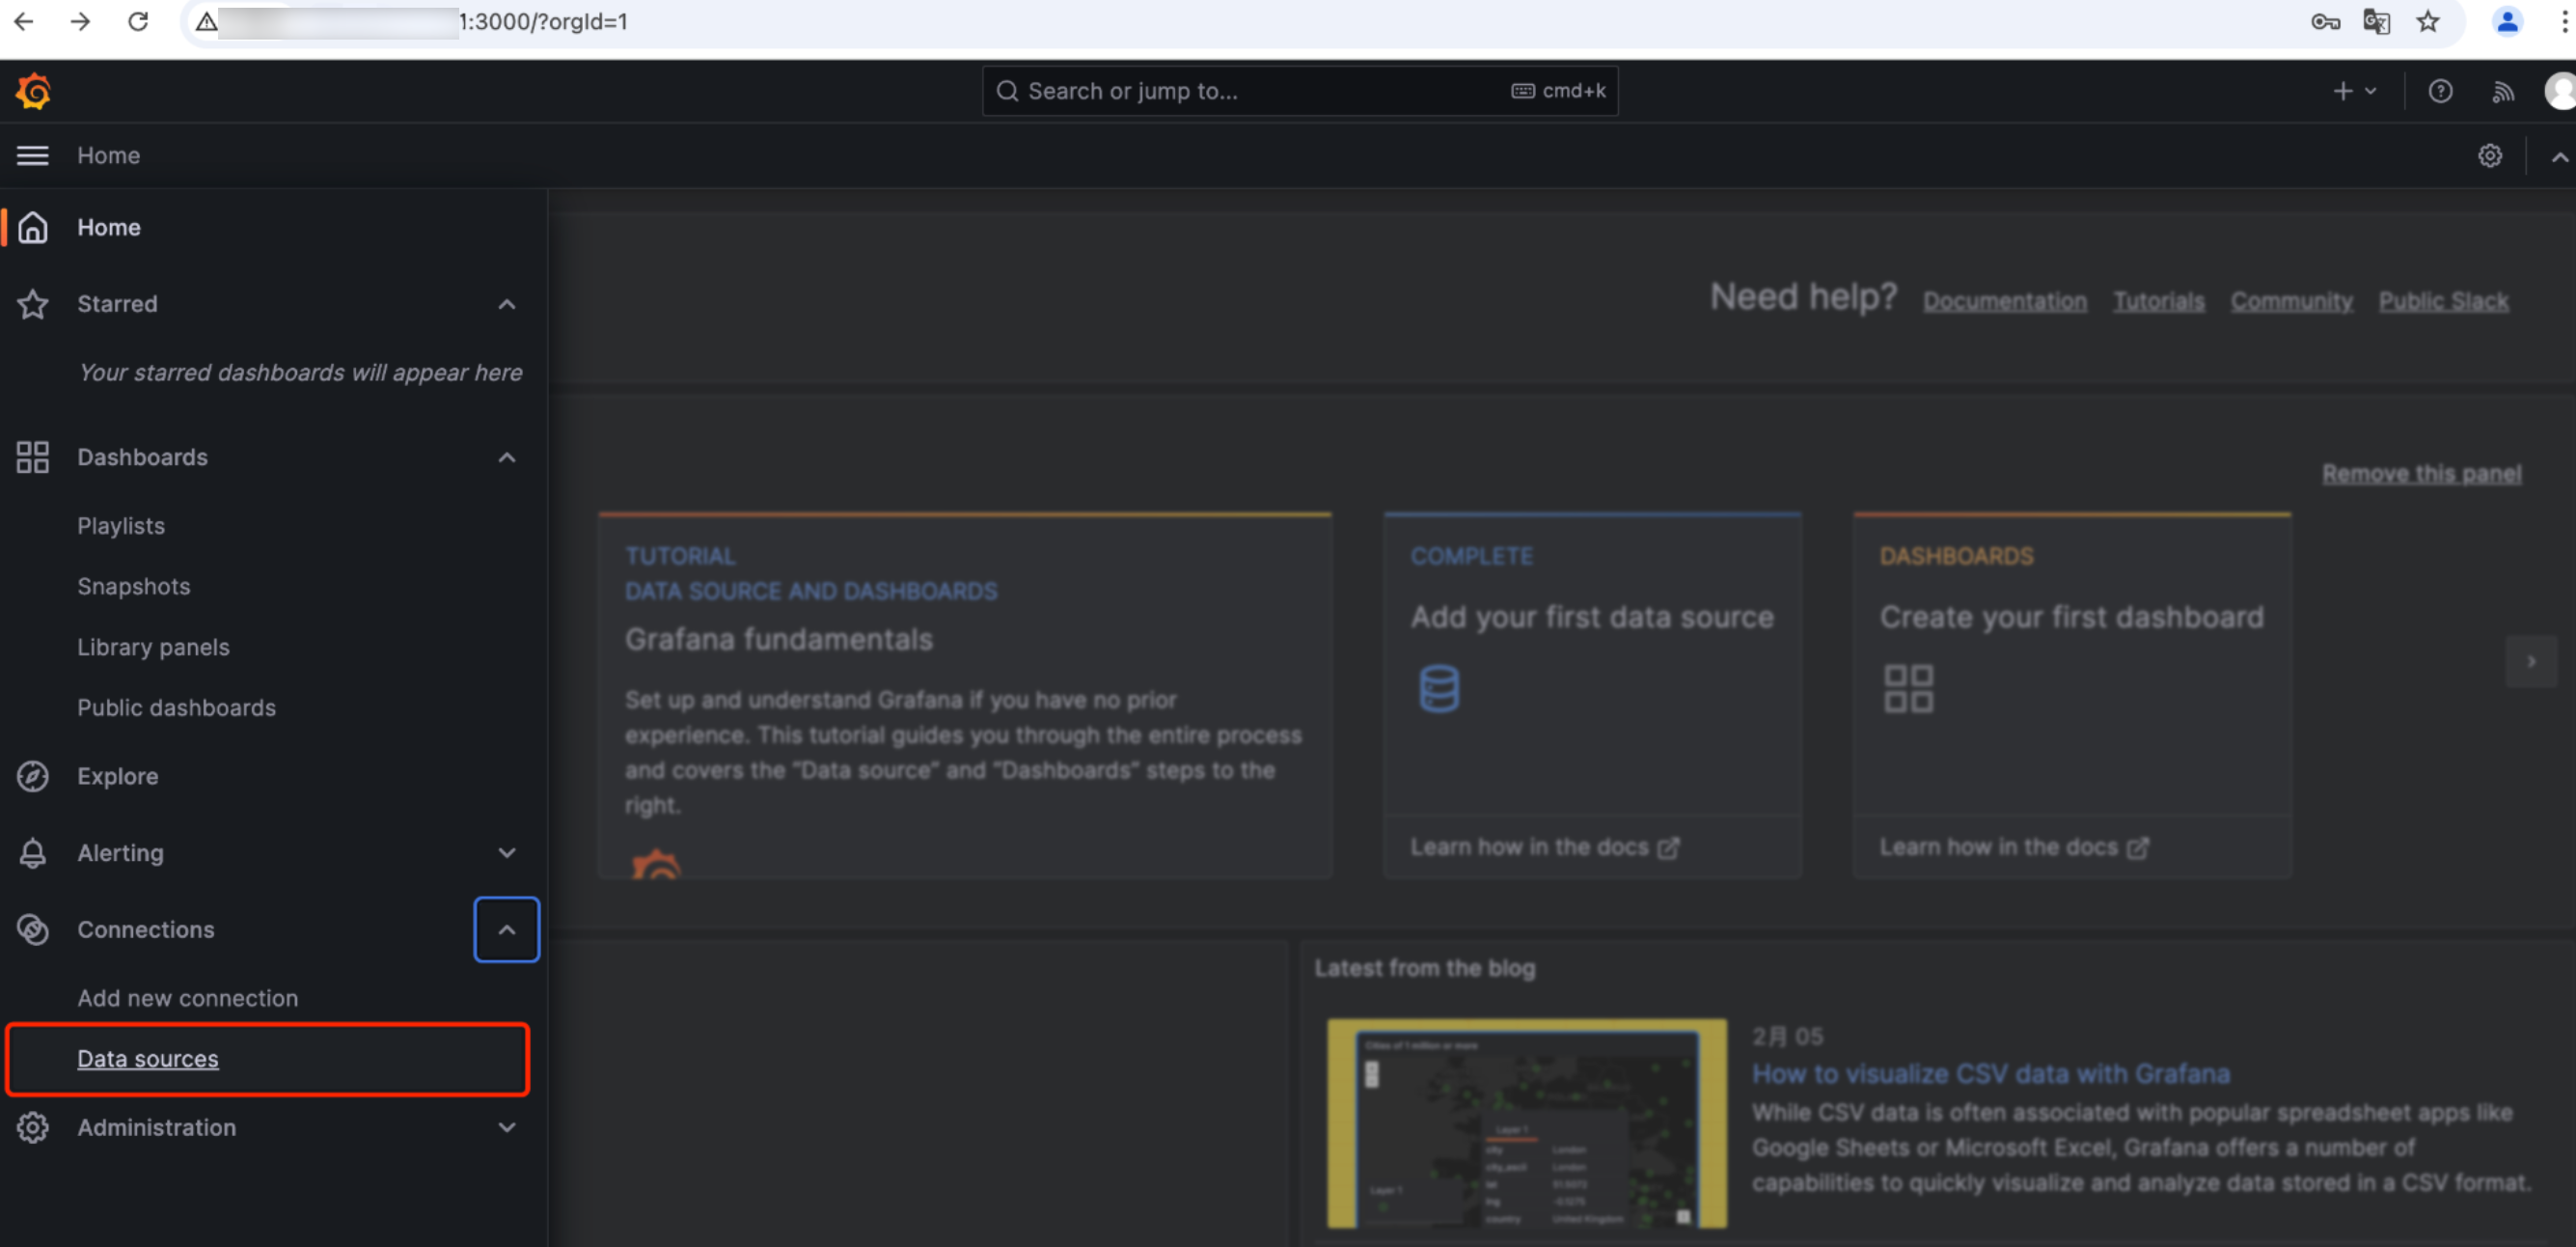
Configuring Data Source
1. In the menu of the Grafana homepage, select Data sources.
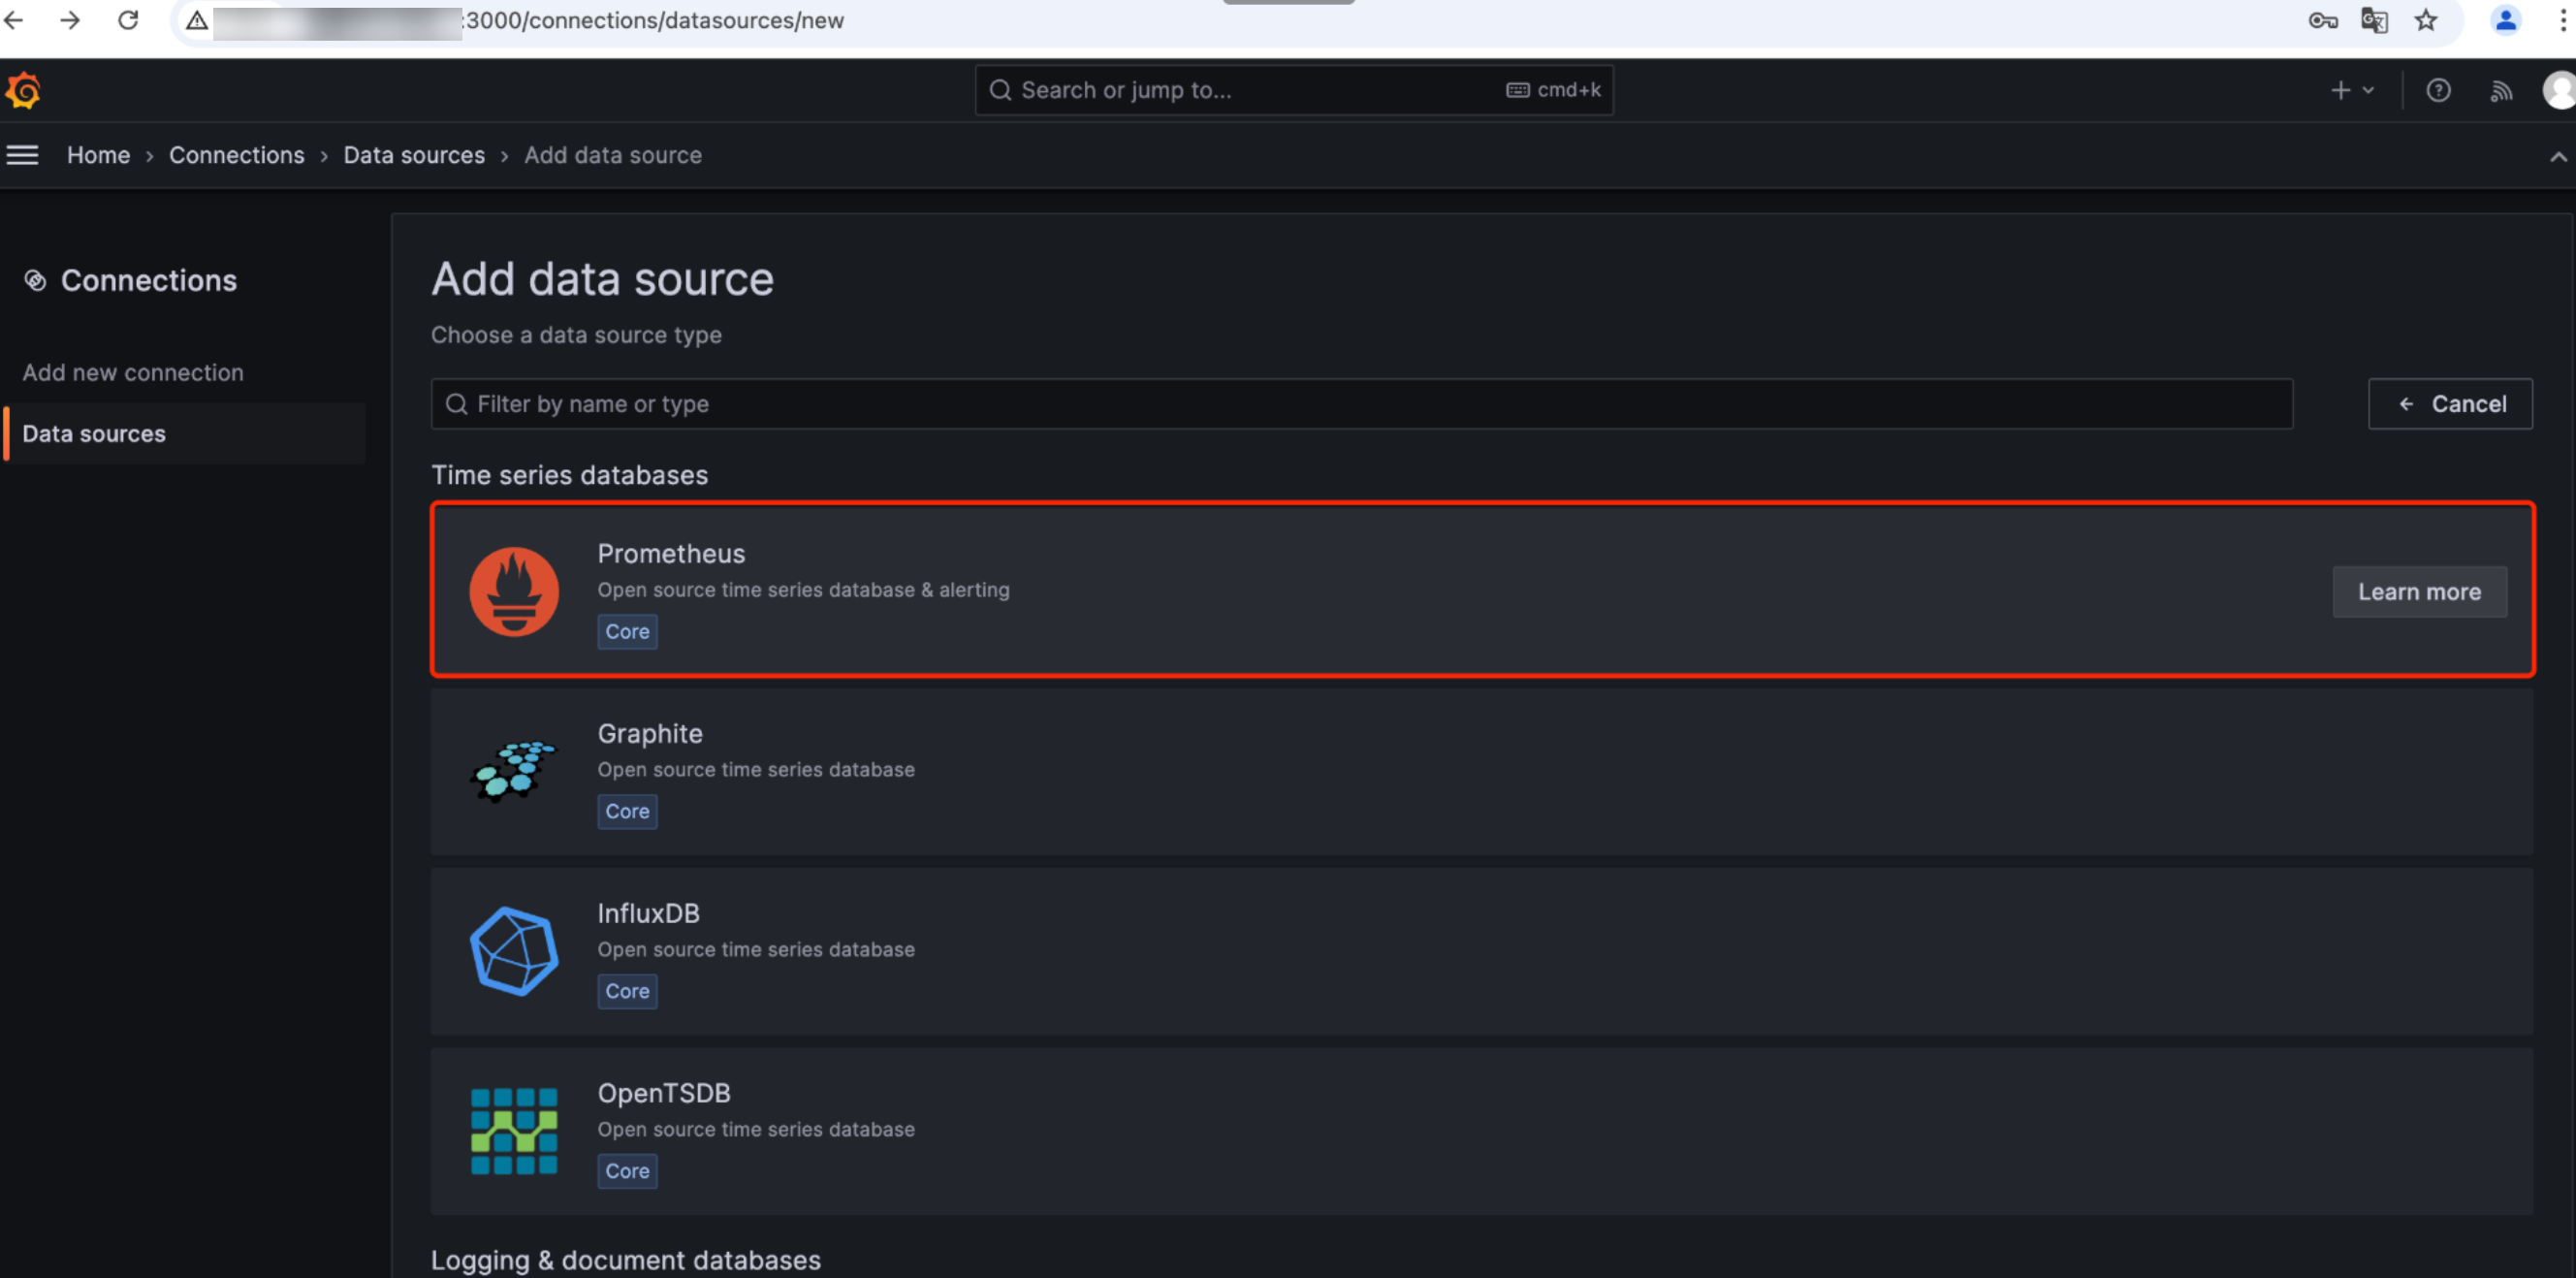
2. Access the Data sources interface and select Prometheus.
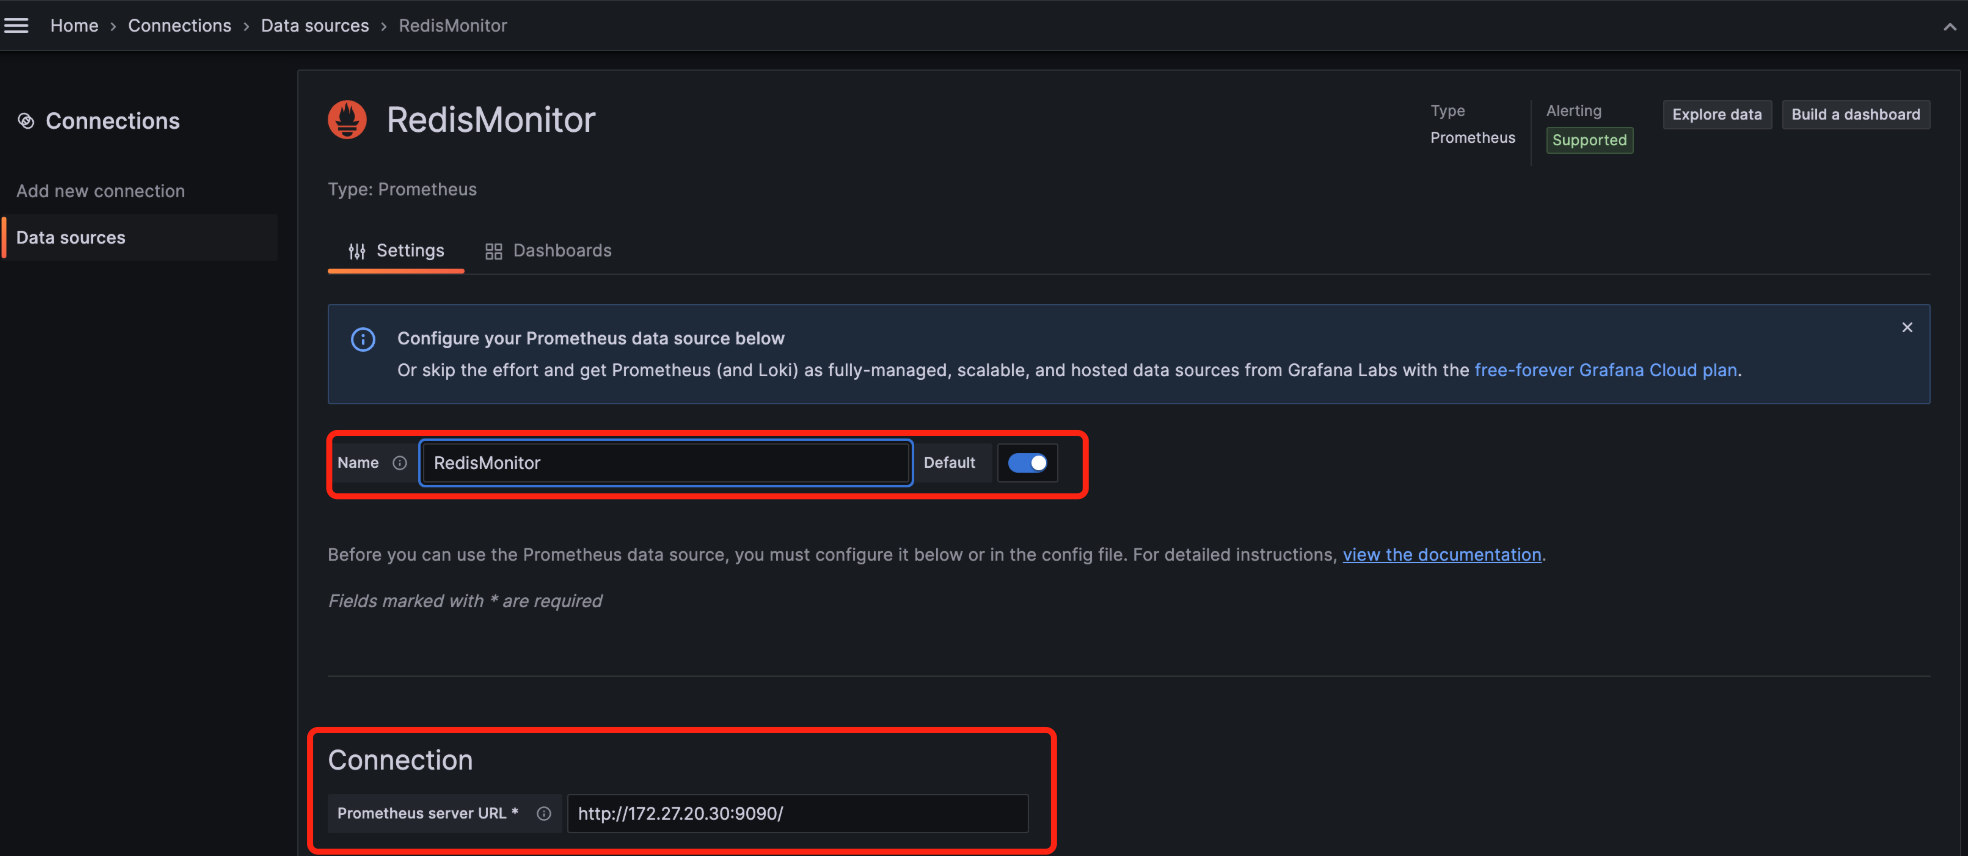
3. After the Prometheus configuration interface is accessed, configure the Spring Boot project name and URL of Prometheus as shown below, and click Save to complete the configuration.
Creating a Dashboard for Visualized Monitoring
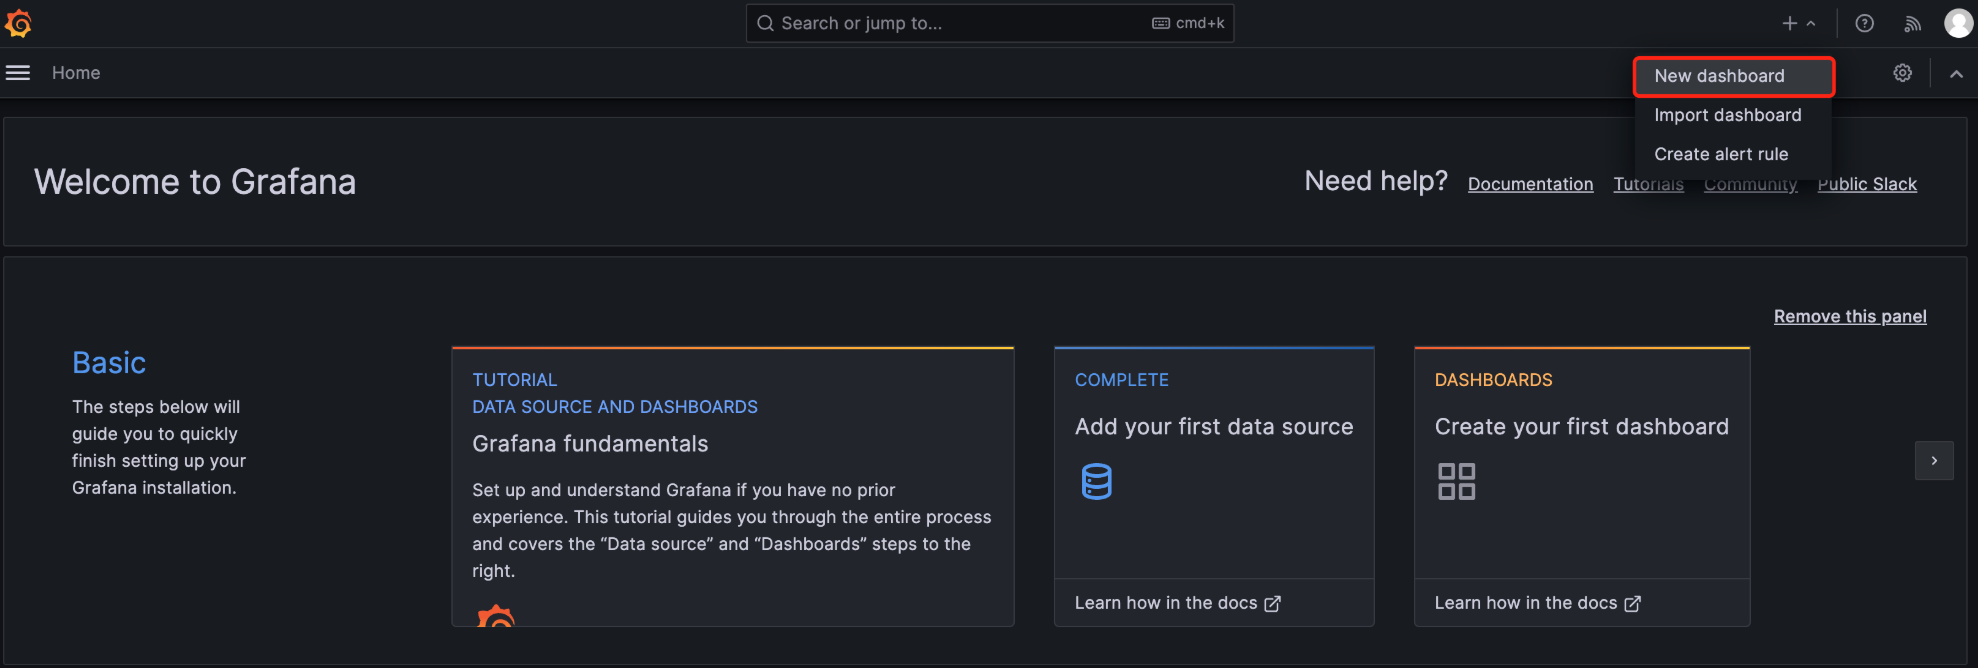
1. On the Grafana homepage, click + in the upper right corner, select New dashboard, and create a dashboard.
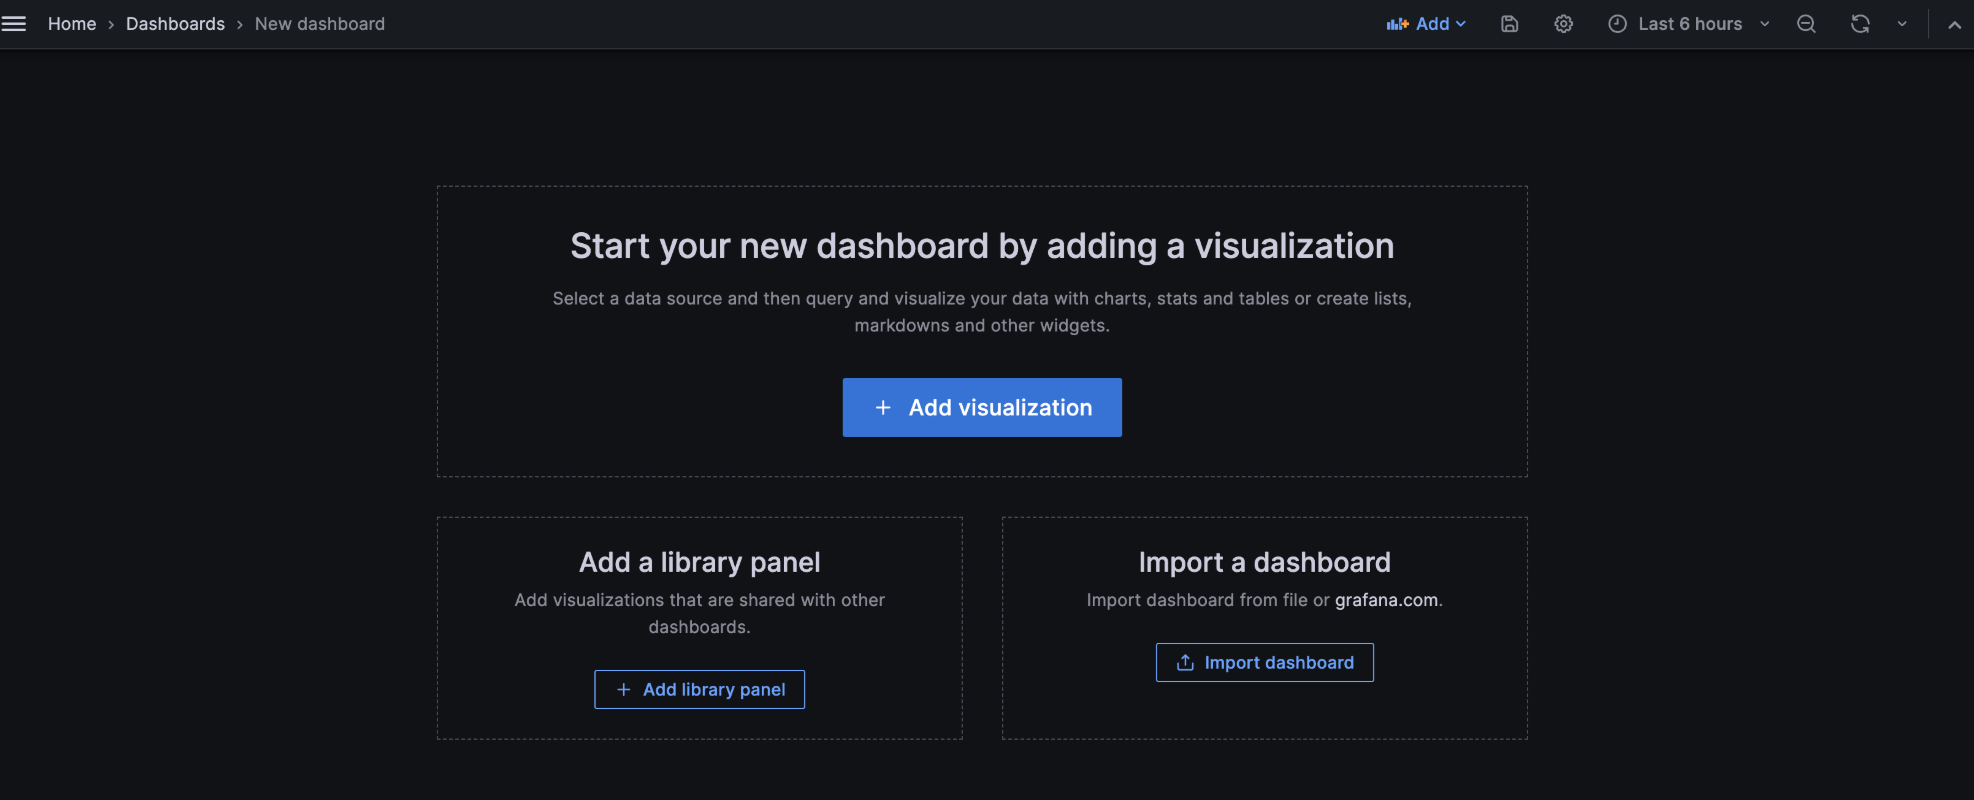
2. Select Add visualization and create a visualized monitoring.
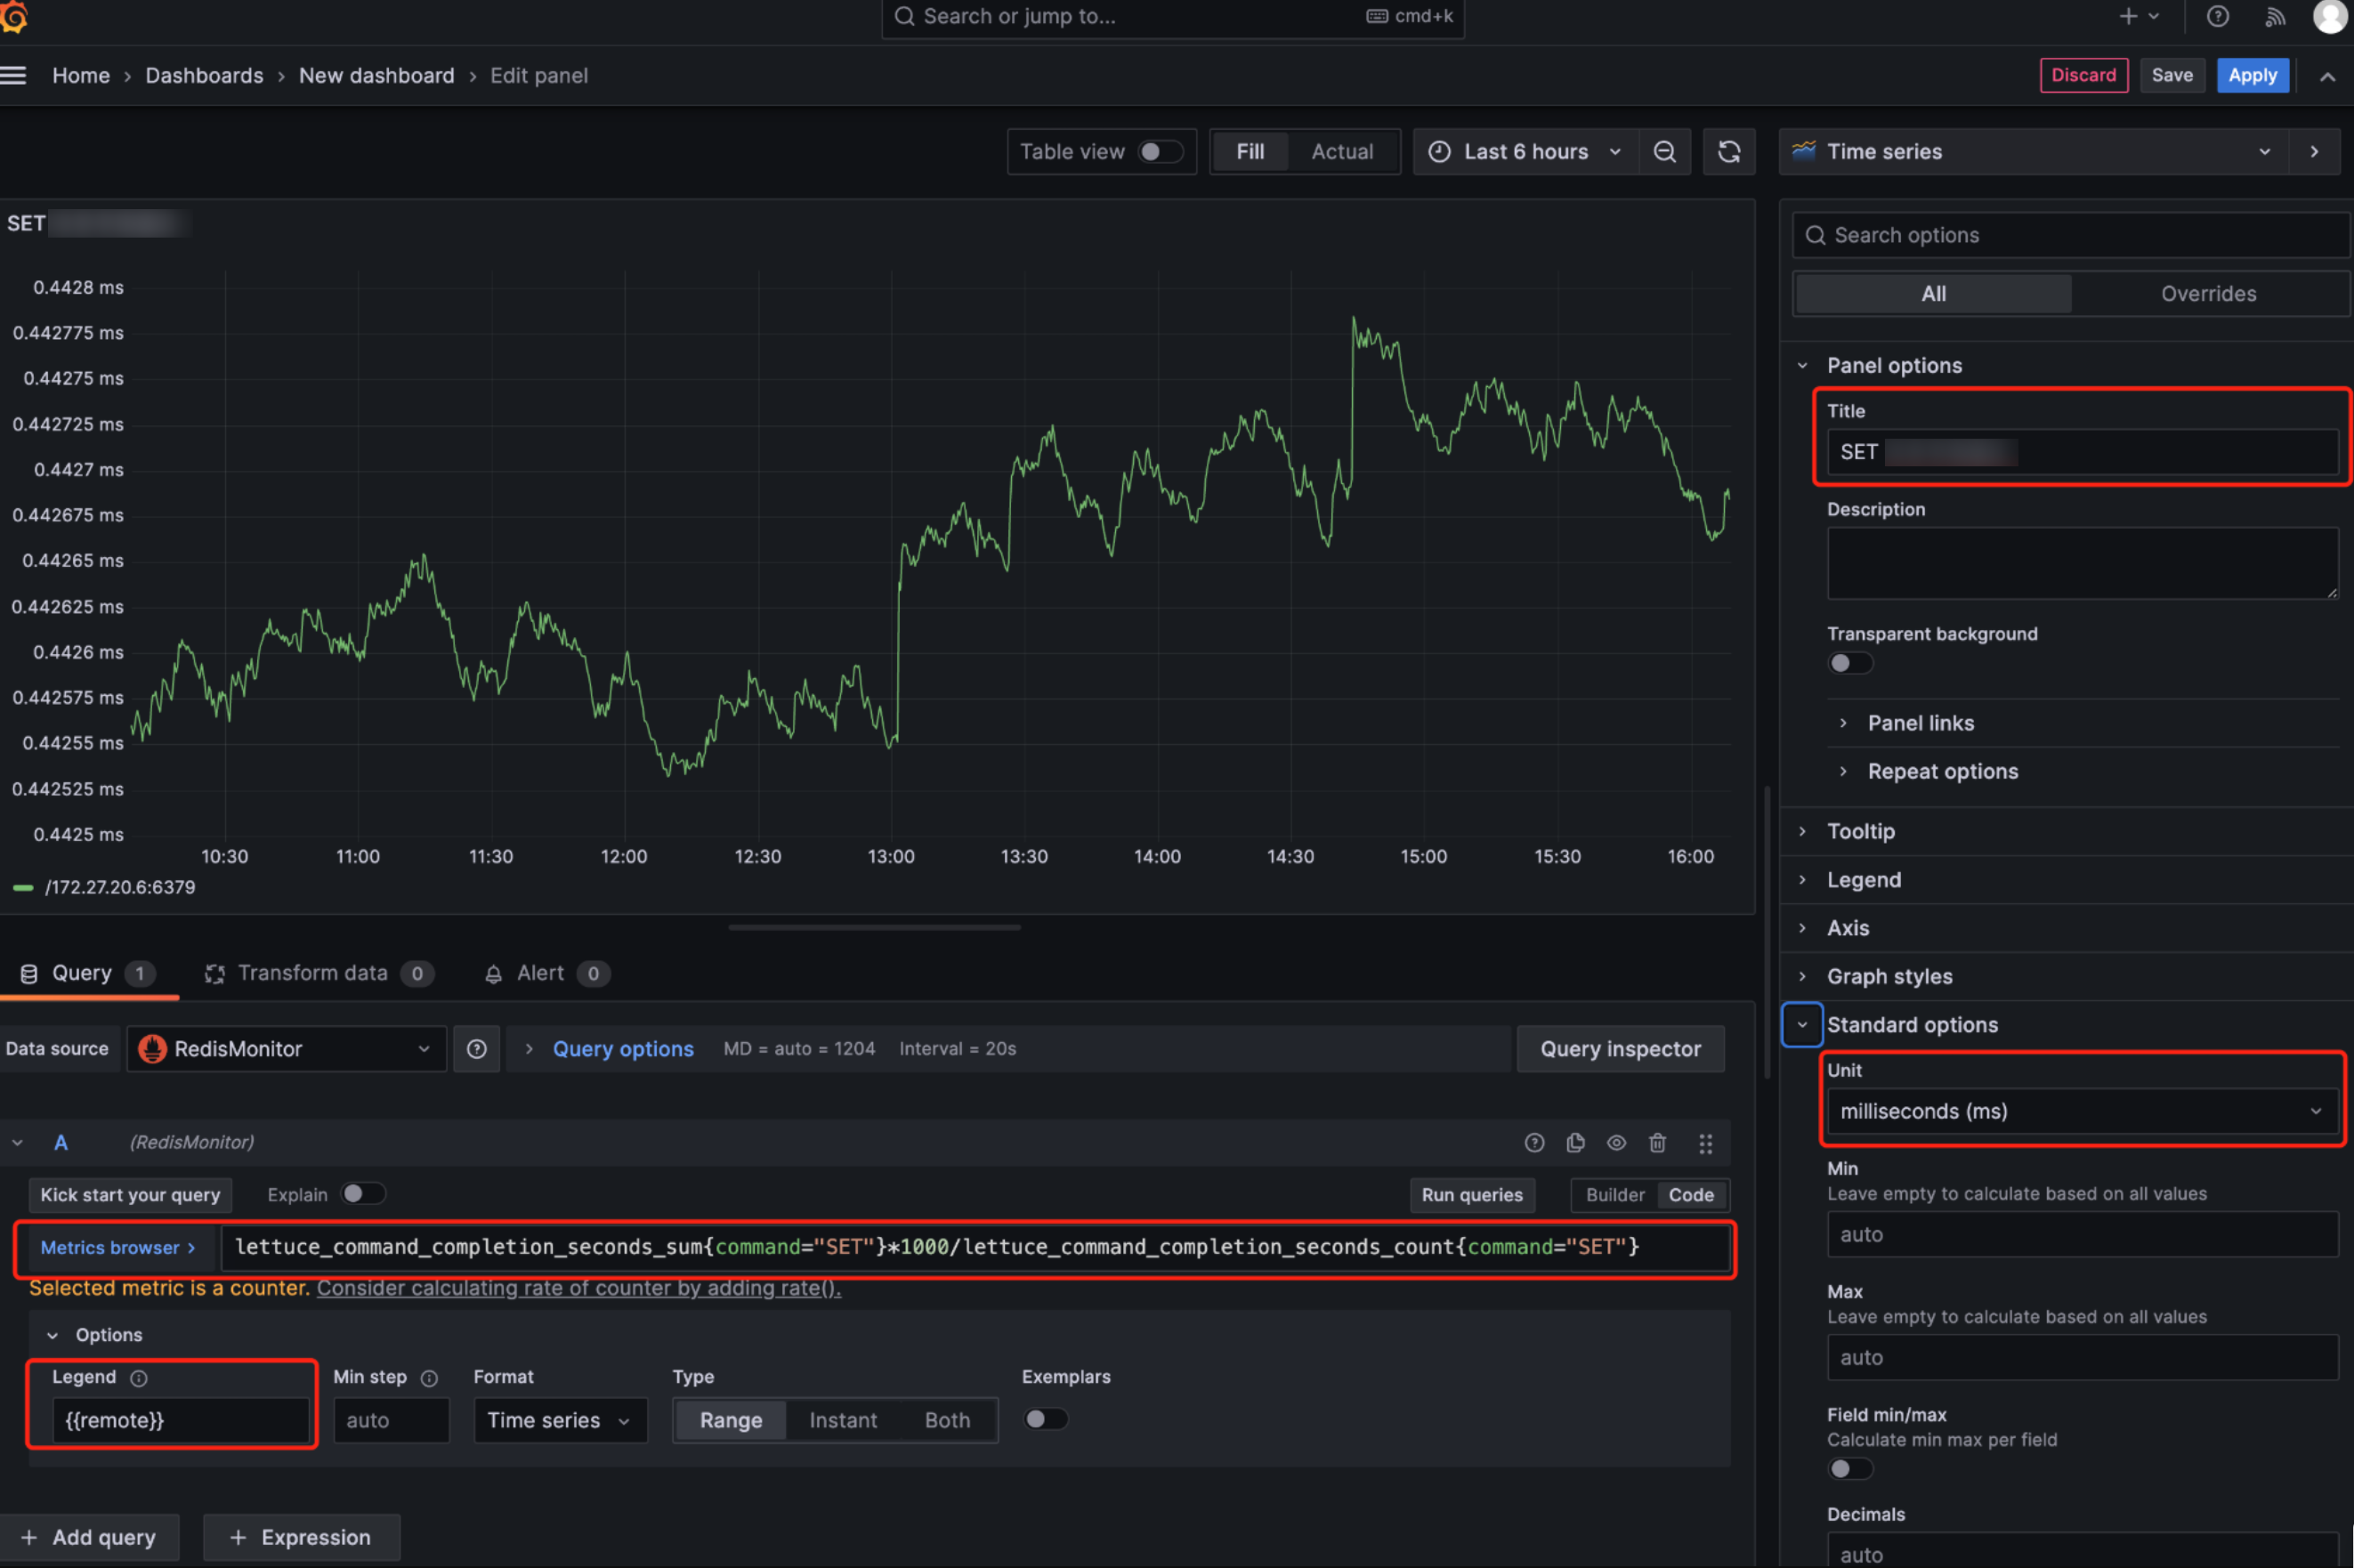
3. In the monitoring settings interface of Grafana, select the configured Prometheus data source RedisMonitor for Data source. In the Query (query statement) input box, enter the Prometheus query statement for monitoring. For example, to display the average latency of the SET command and convert the unit to milliseconds (ms), use the following query statement.
lettuce_command_completion_seconds_sum{command="SET"}*1000/lettuce_command_completion_seconds_count{command="SET"}
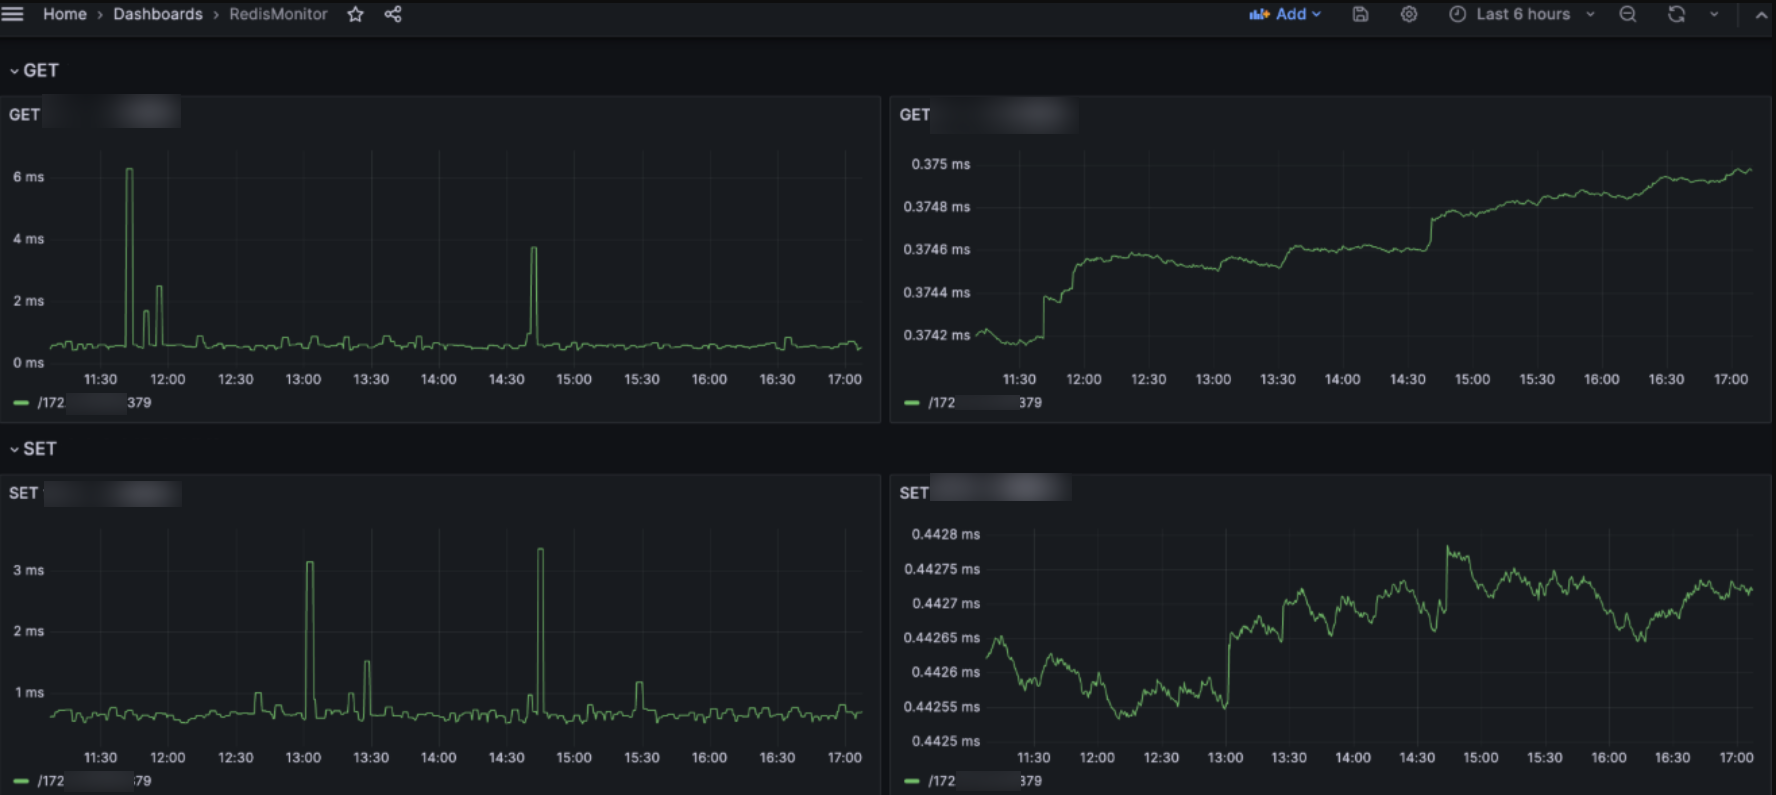
In the monitoring configuration of Grafana, the Legend configuration item is used to define the legend content for the chart. It is set to the `remote` field to display the access address of the TencentDB for Redis® instance. Additionally, the title and vertical coordinate unit for the monitoring item can be configured on the right side, as shown below.
4. Select Save and Apply to create a visualized monitoring view in the current dashboard.
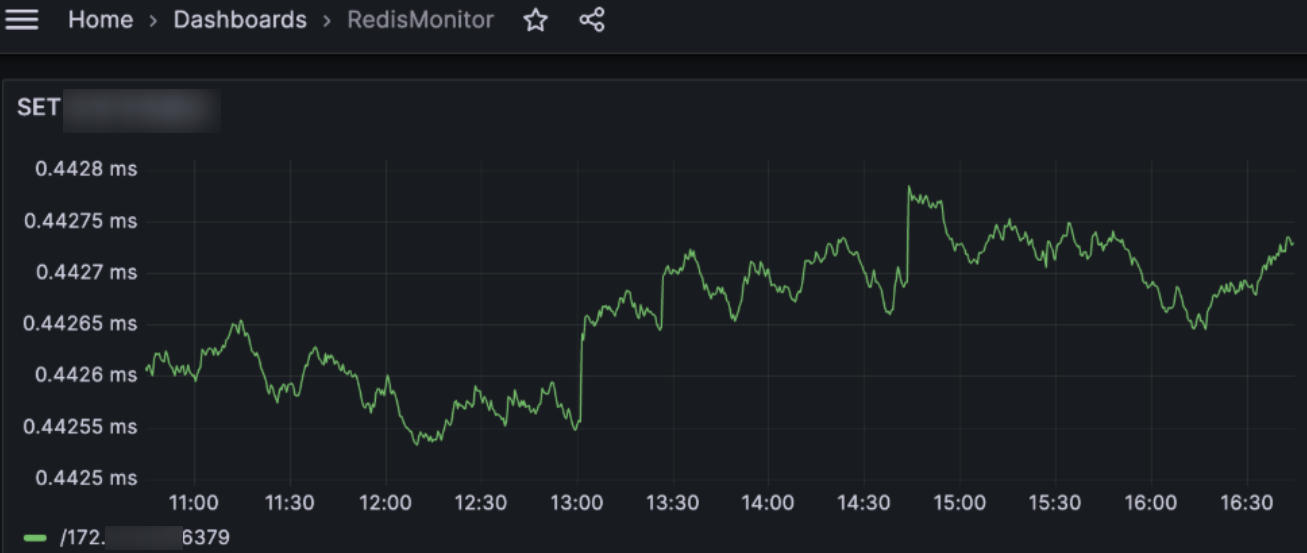
5. By using the same method, the monitoring for the average and maximum latencies of the `SET` and `GET` commands can be further added, achieving the goal of monitoring the TencentDB for Redis® command latency from the client.
Note:
This example only shows the monitoring for the average and maximum latencies of the `SET` and `GET` commands. You can expand the monitoring scope and add more command latency monitoring as needed.
Help and Support
Was this page helpful?
You can also Contact sales or Submit a Ticket for help.
Help us improve! Rate your documentation experience in 5 mins.
Feedback