Tencent Cloud Observability Platform provides multiple ways to help users detect resource exceptions and multiple channels to send the exception information to users as soon as possible.
Locating Exceptions
Detecting exceptions through alarms
Tencent Cloud uses monitoring and alarming to promptly detect exceptions and notify you automatically. This helps keep you informed on exceptions in real time across all scenarios. You can log in to the Tencent Cloud Observability Platform console and configure alarm policies for resources. For more information, please see Creating Alarm Policies.
If you have configured key performance metrics and events as alarm rules, you will be notified promptly in multiple ways through the alarm channel if an exception occurs.
Alarm policies configured with an alarm recipient group will be sent to you through SMS, email, etc. Features such as repeated alarms and alarm aggregation are also supported to keep you informed while avoiding unnecessary notifications.
You can also configure the callback API feature in alarm channel to receive alarms promptly and process the alarm information.
Detecting exceptions through monitoring charts
You need to actively analyze the historical data and average trends of performance metrics to locate exceptions through monitoring charts. If an exception is difficult to locate by using alarm rules or has not been configured with alarms, you can use monitoring charts to locate it during daily health check. Compared to alarms, monitoring charts allow you to query the global impact of resource exceptions. You can subscribe key resources to the dashboard and configure monitoring charts to highlight exceptions in different scenarios.
For some instances, you can subscribe to details views to compare the trends of instance performance data on the dashboard.
For resource clusters, you can subscribe to the aggregated data of a cluster to see the overall monitoring chart of the cluster on the dashboard and compare it with the chart of a single instance in this cluster.
For exceptions detected through monitoring charts, you can use the sorting feature to locate specific resources related to an exception for further troubleshooting.
Troubleshooting
Locating exception objects on monitoring overview page
If you receive an alarm during daily health check, you can go to Monitoring Overview in the Tencent Cloud Observability Platform console.
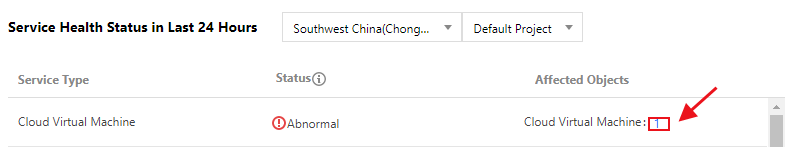
1. Go to the overview page > service health status module to view exceptions in each region and project.
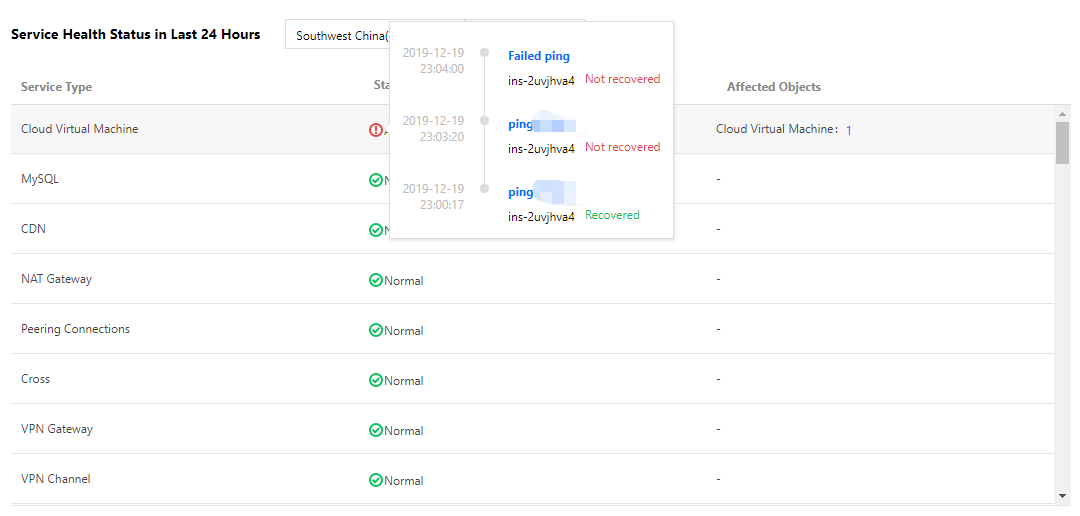
You can browse recent exceptions by clicking on the status of each service.
2. Click the number of exception objects to access the service monitoring page.
Affected resource objects are automatically filtered out on the service monitoring page.
3. Click the ID of a specific object to go to the monitoring details page, where detailed information about its historical exceptions is provided.
The exception timeline allows you to view the current and historical information of the affected object. This helps you troubleshoot current exceptions based on historical alarms and status changes.
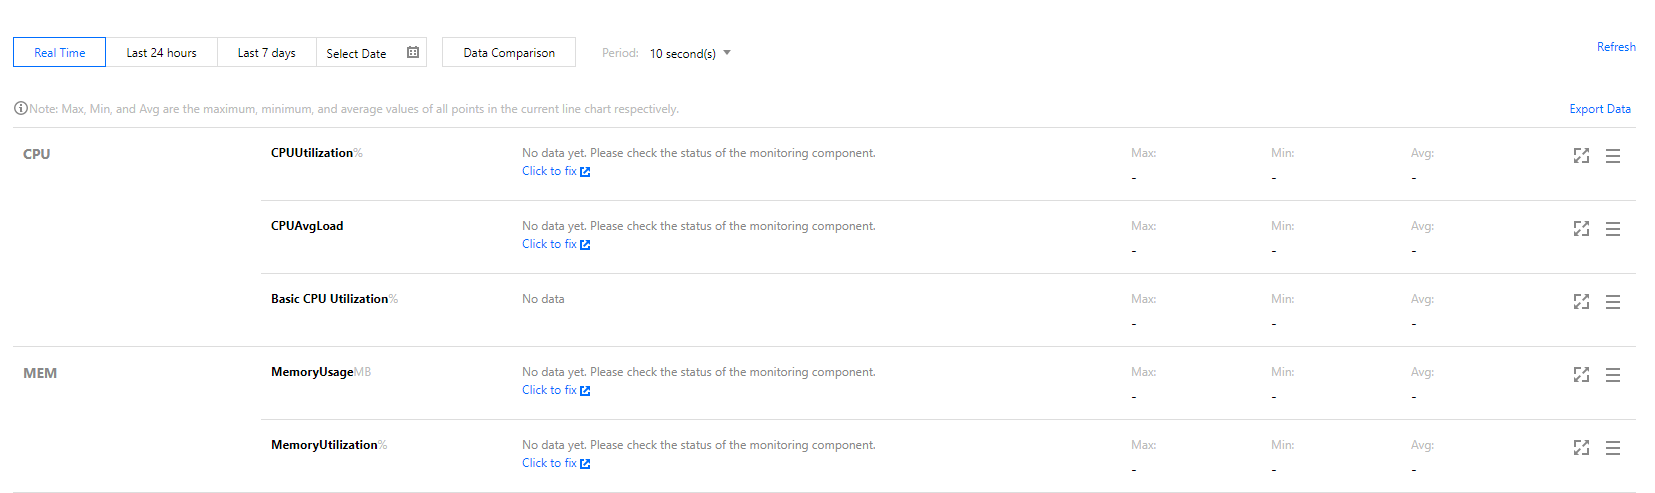
The monitoring data for resource performance allows you to compare the current and historical data of the same metric over a specified period of time or compare data changes of different metrics within the same period for troubleshooting.
1. When you find an exceptional trend in the monitoring chart, click the time period when the exception occurs. A sorting list of corresponding instances is displayed below the chart. You can locate the specific exception objects based on the sorting list.
2. Click the name of an object in the sorting list to access its monitoring details page, where detailed information about its historical exceptions is provided.
The exception timeline allows you to view the current and historical information of the affected object. This helps you troubleshoot current exceptions based on historical alarms and status changes.
The monitoring data for resource performance allows you to compare the current and historical data of the same metric over a specified period of time or compare data changes of different metrics within the