The dashboard tag feature currently is only available for CVM’s basic monitoring and will be supported for more Tencent Cloud services in the future.
Template Variable: the chart will display the instances filtered by the template variable. For more information on how to configure template variables, please see Template Variables.
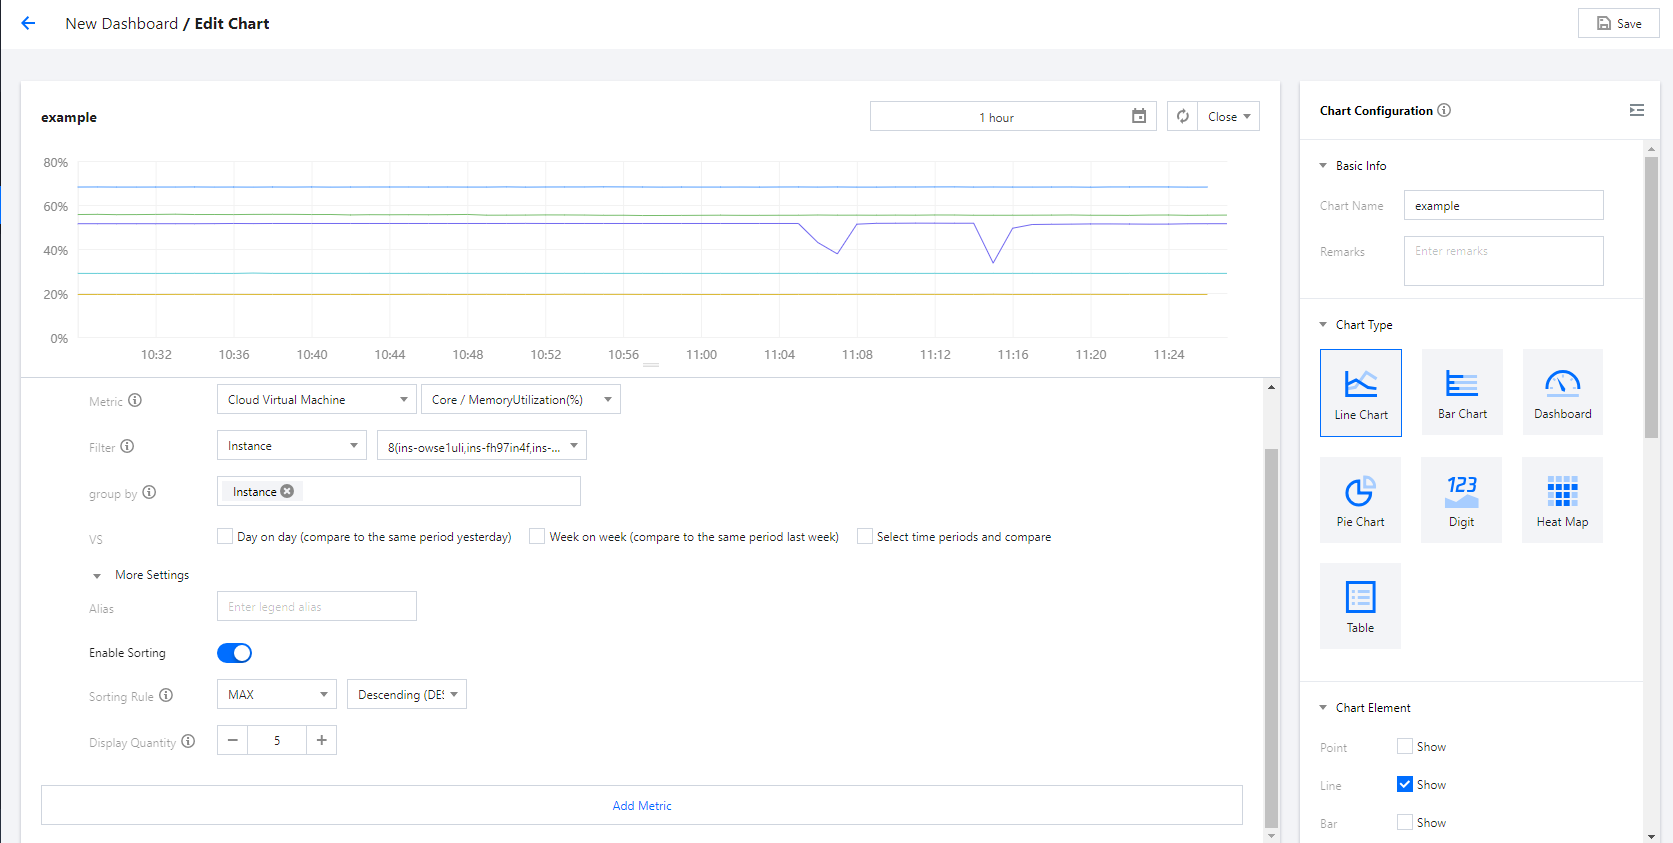
Group by (this feature is not available for the tag filter): similar to the Group By feature of SQL, this feature can group data based on specified tags and then aggregate data according to aggregation algorithms. If you don't select a tag, you can customize the metric statistical mode for the statistical period, which can be avg, max, min, or sum.
Comparison: day-over-day (compare with the same period yesterday), week-over-week (compare with the same period last week), and custom time comparisons are supported. If you select all the comparison options, the chart will display the day-over-day and week-over-week monitoring curves for the selected instance, making it easier for you to compare the data.
Left Y-axis/Right Y-axis: you can choose to place the Y-axis on the left or on the right.
Additional configuration items.
Alias: you can configure an alias for all instances quickly. To configure different aliases for different instances, you can create multiple metrics and enter an alias under each metric.
Enable Sorting: the instances bound to the chart will be sorted according to the configured sorting rule and displayed quantity, making it easier for you to monitor the loads of machines in batches.
Sorting Rule: you can sort metrics in a variety of ways and filter instances according to the sorting result.
Displayed Quantity: it denotes the number of instances to be displayed.
For example, if you set the sorting rule to "MAX; DESC" and the displayed quantity to 10, the chart will display the top 10 instances by the maximum value in descending order.
4. After configuring the settings, click
.
Creating multiple metrics and copying metrics
You can click Create Metric or
to display multiple metrics on the same chart for cross-instance metric data comparison.