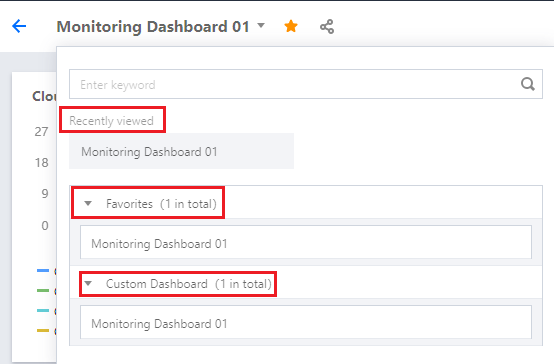
Using the dashboard feature, you can switch between Recent Dashboards, Favorite Dashboards, and Custom Dashboards. This document describes how to view dashboards after creating them.
Preparations
- Log in to the Cloud Monitor console.
- In the left sidebar, click Dashboard > Dashboard List to go to the dashboard list page.
Viewing a Dashboard in the Full Screen Mode
- In the dashboard list, find the dashboard that you want to view, and click the dashboard name to go to the dashboard management page.
- Click
to view the dashboard in the full screen mode.

Exiting the Full Screen Mode
You can press Esc or click the close icon
in the upper-right corner to exit the full screen mode.
Switching Dashboards
- In the dashboard list, click any dashboard name to go to the dashboard management page.
- As shown in the figure below, click
in the dashboard area to switch between Recent Dashboards, Favorite Dashboards, and Custom Dashboards.
- Recent Dashboards: displays the most recent three dashboards you have accessed.
- Favorite Dashboards: displays all the dashboards you have added to Favorites.
- Custom Dashboards: displays all the dashboards you have customized.
Note:
To add a dashboard to Favorites, see Adding a Dashboard to Favorites.
Adjusting the Time Span and Refreshing Frequency of a Dashboard
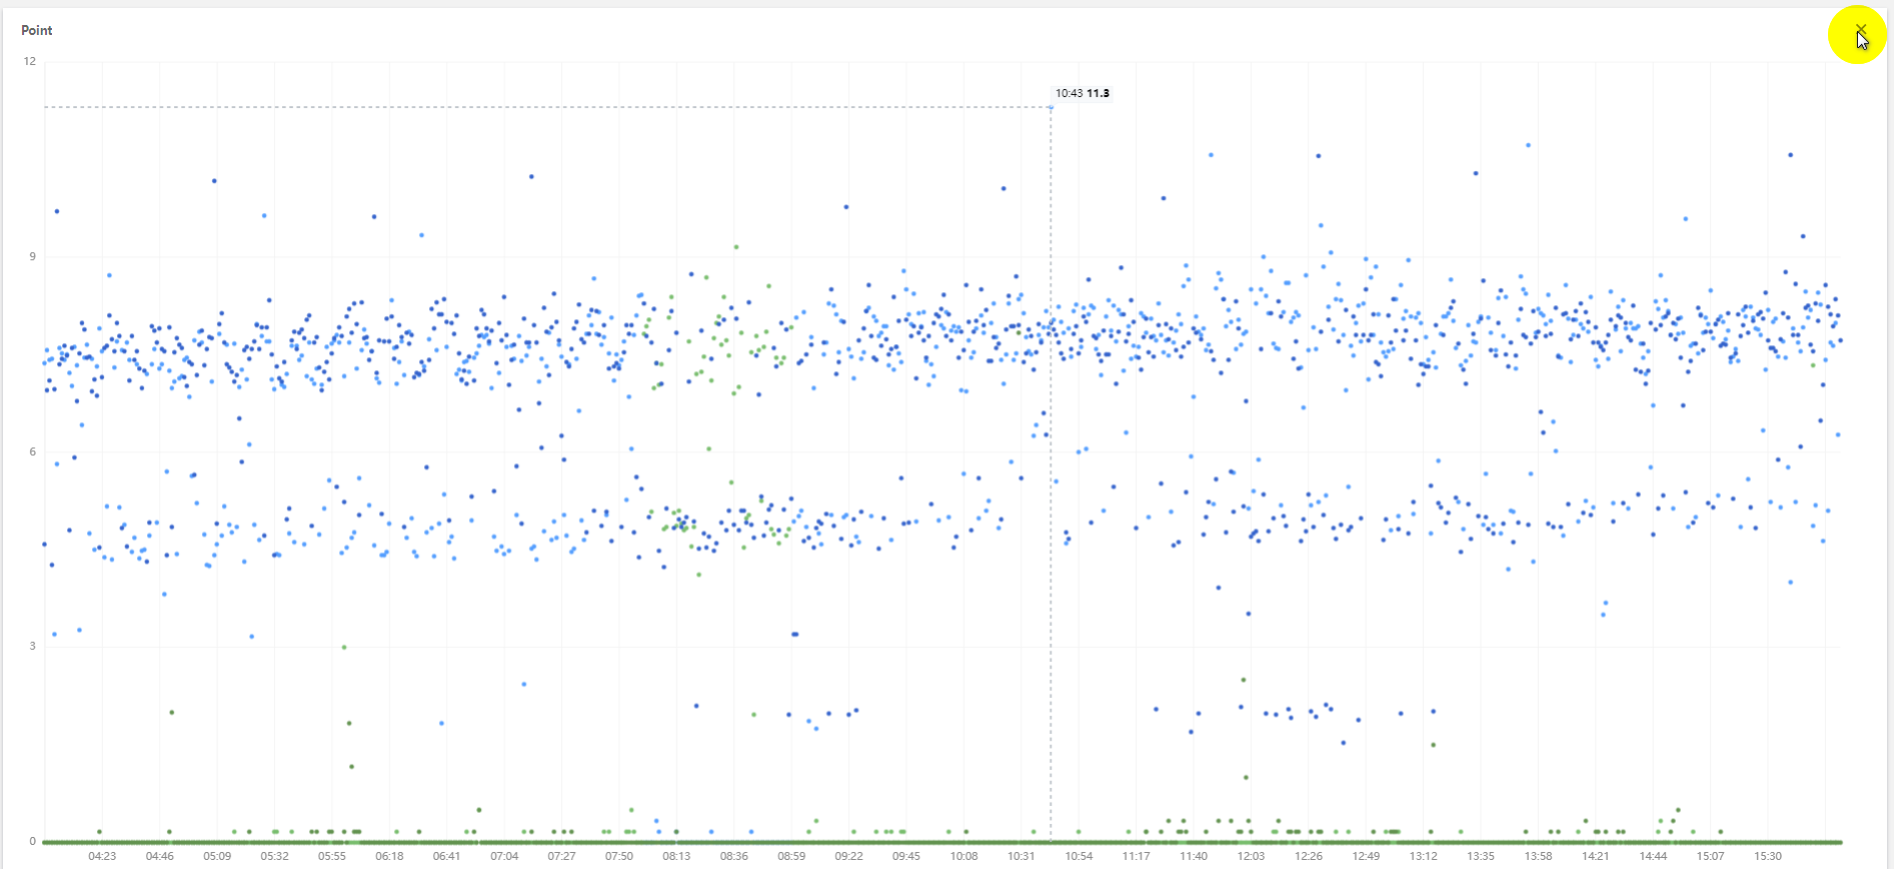
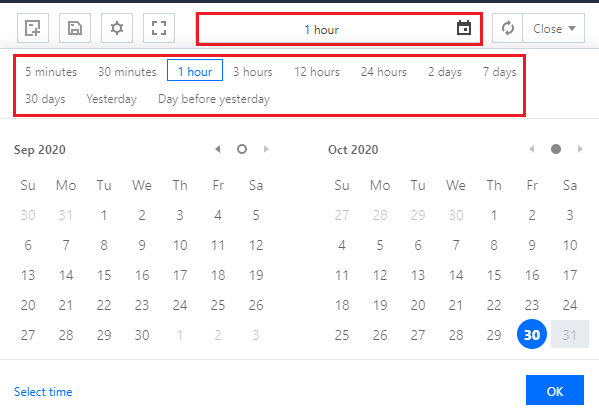
By default, dashboards display the data of the last 12 hours, and monitoring data is refreshed in real time.
- You can adjust the time span and granularity for all charts on the current dashboard by using the time selector in the upper-right corner of the dashboard. In this way, you can review historical monitoring data and perform troubleshooting.

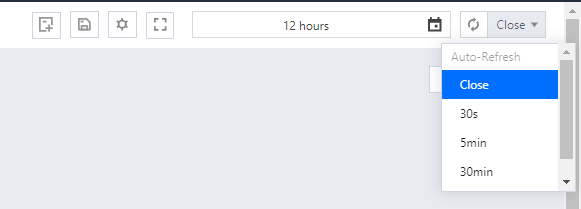
- In the upper-right corner of the dashboard, you can click the refresh button to refresh the dashboard or select a time interval from the drop-down list to adjust the refreshing frequency.

Was this page helpful?