The Site Security Overview focuses on displaying the main security risks faced by the site. By showing the request statistics of the EdgeOne security module over a period of time, including trend charts and TOP N charts, the Site Security Overview can provide you with multiple dimensions of security risk reference: risk severity and urgency level (security event scale and trend), main objects of security risks (main target domain names, paths, etc. of attacks), and risk classification (main attack methods, such as HTTP DDoS attack, vulnerability attack, and crawler access). Through this information, you can quickly understand the current security threats faced by the site and adjust or strengthen the security policy accordingly.
Supported Capabilities
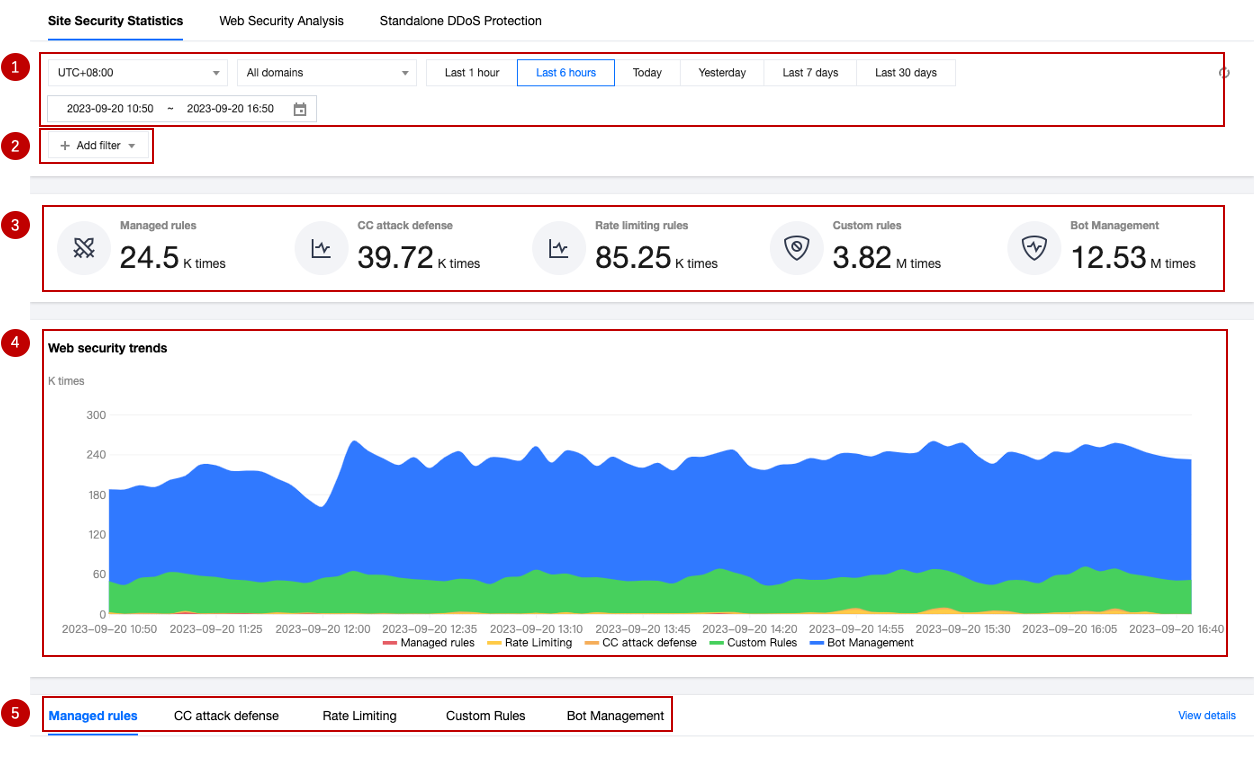
The Site Security Overview provides various statistical analysis functions, displaying the overall situation of requests hitting security rules to help you quickly assess threats.
The screening conditions will take effect on all data on the page, including custom rules, rate limiting, CC attack defense, managed rules, and bot management pagination statistics.
When the amount of data queried is large, it may take a longer time to query.
Managed rules: View requests carrying vulnerability attack features that hit managed rules.
CC Attack Defense: View requests that hit CC attack defense, which may pose a risk to site availability.
Rate Limiting Rule: View requests that trigger rate limiting rules, which may abuse resources or application interfaces.
Custom rule: View requests that trigger custom rules. You can further analyze the request trend and evaluate your customized security policy.
Bot Management: View requests from automated programs (bots), including various crawler requests from search engines and automation tools.
4. Security Event Trend Chart
The trend chart helps you understand the external security risk trend over a period of time and displays the overall risk scale and the scale trend of each risk classification through a stacked chart method, helping you quickly assess the severity and priority of risks and take appropriate measures.
Note:
The trend chart is a stacked area chart, in which:
The vertical axis shows the number of requests hitting various security modules, including custom rules, rate limiting, CC attack defense, managed rules, and bot management module.
The horizontal axis shows the timestamp, corresponding to the start time of the counting window. For example, when the data is displayed at a granularity of 1 minute, the data point at 16:05:00 corresponds to the total number of requests from 16:05:00 to 16:05:59.
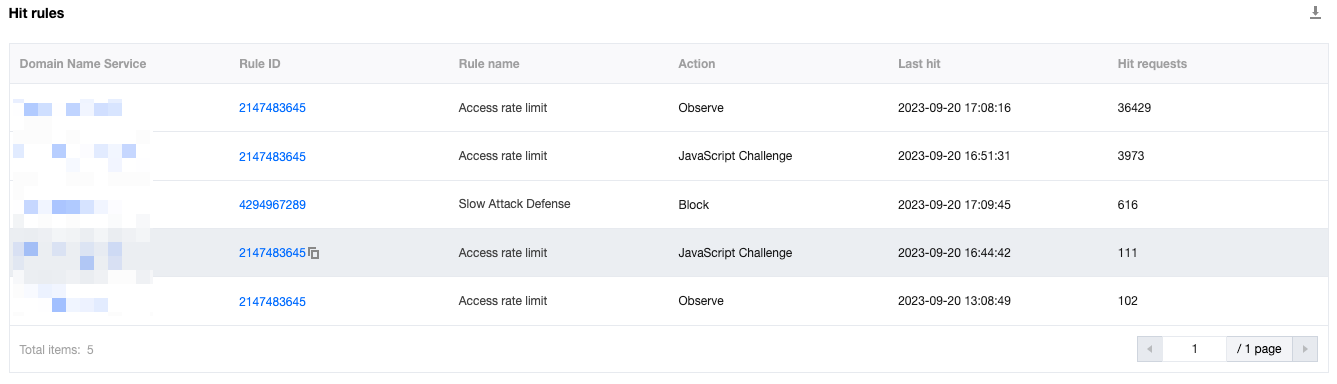
Top 10 security protection rule hit statistics, including the host, rule ID, action, hit time, and hit request count information of the hit rules
Request Path Statistics
Top 10 data of request paths hitting security protection rules
Client IP Statistics
Top 10 statistics of client IPs hitting security protection rules
Client Distribution Statistics
Top 10 statistics of client distribution areas hitting Web Protection rules
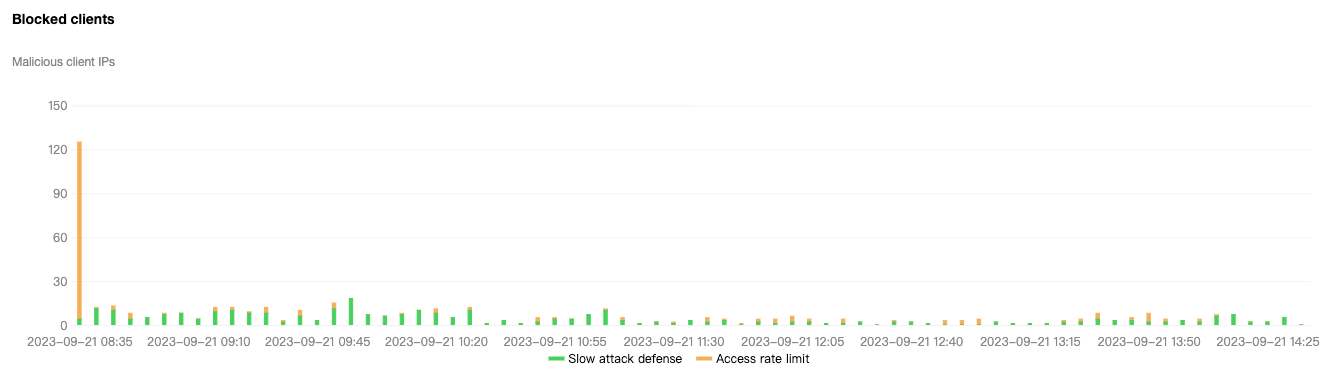
Intercepted Malicious Client Statistics
Statistics of the number of malicious client IPs intercepted in CC attack defense
Bot Label Trend
Statistics of intercepted bot label trends
In security events, you can also click on the corresponding domain name, request path, rule ID, and client IP to quickly add them as filter conditions and view more detailed dimension statistical analysis data;
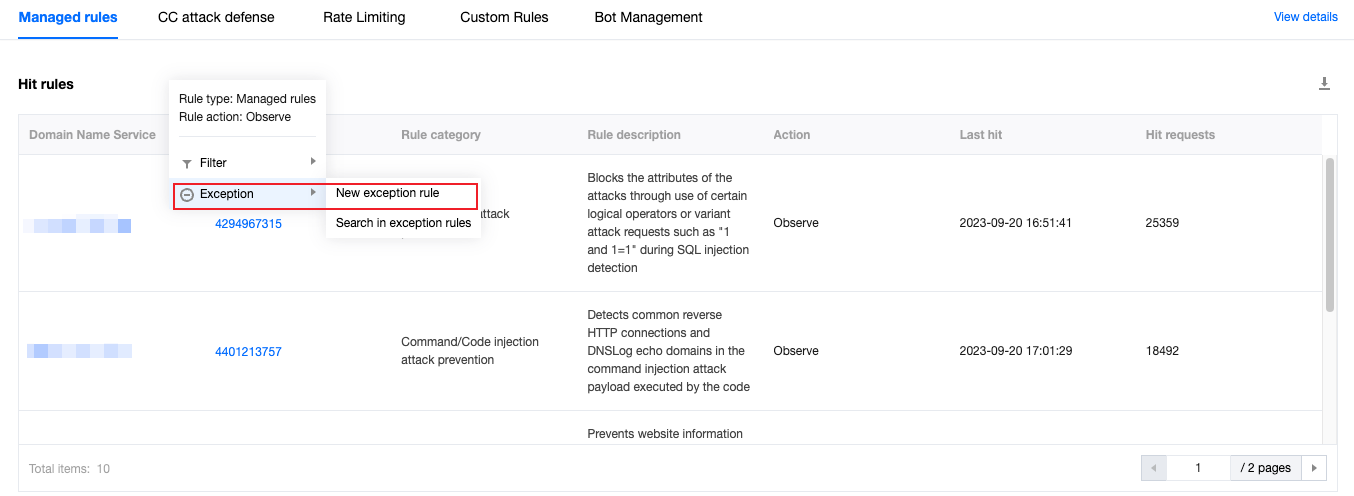
If you find that a rule ID in the security overview has intercepted normal requests, you can click on the rule ID, click on the new protection exception rule, and quickly create a new protection exception rule.
Analysis Example
Scenario 1: Viewing ongoing CC attack activities
Use the trend chart in the Site Security Overview, where the peak of the trend chart corresponds to the total number of various attacks, and the scale of CC attacks usually corresponds to the number of requests hitting rate limiting and CC attack defense.
The number of clients used for CC attacks often corresponds to the intensity of the attack and the cost input of the attackers. You can view the number of malicious clients intercepted in the CC attack defense pagination to judge the resources invested by the attackers as a reference for defense.
Note:
When the number of intercepted malicious clients exceeds 2000, it usually means that the attacker has invested more resources and called one or more botnet networks. Please consider upgrading to the Enterprise version and purchasing independent DDoS protection to ensure that there are sufficient protection resources to fight against the attack and avoid business losses.
Scenario Example
When your site example.com's domain name www.example.com has been subjected to a large-scale CC attack in the past hour, you need to know the information about the threat in real-time to develop targeted defense strategies or evaluate existing strategies. In addition to viewing the status code ratio on the traffic analysis page to check whether it has an impact on the business, you can also view the security module statistics in the Security Analysis > Site Security Overview page.
Directions
1. Log in to the EdgeOne console, click on the site list in the left menu bar, click on the site to be configured in the site list, and enter the site details page.
2. In the site details page, click on Data Analysis > Security Protection, and enter the Site Security Overview analysis page by default.
3. Modify the domain name and time range of the site to be analyzed. In this scenario, for example, select the security protection data of the domain name www.example.com in the past hour.
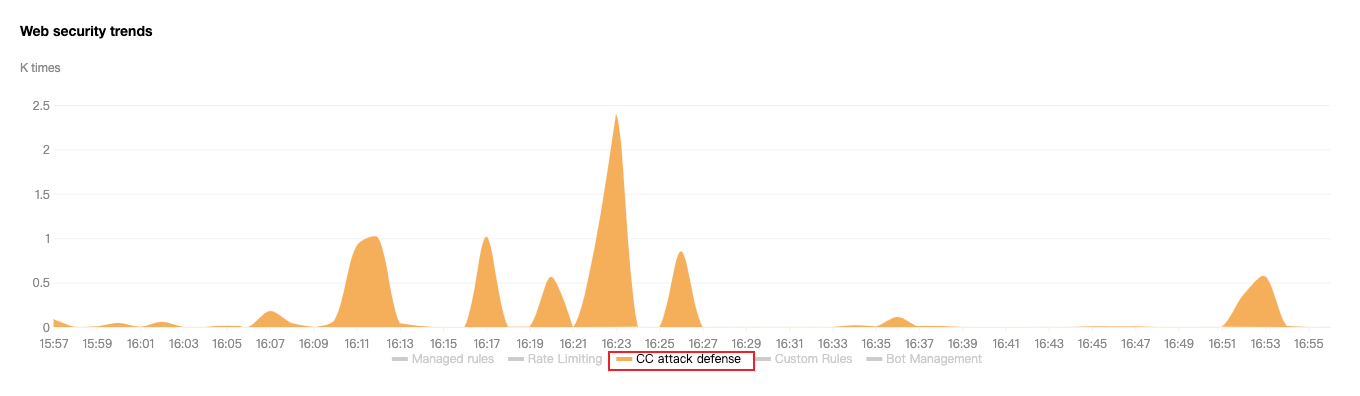
4. After filtering, the security analysis data will be automatically queried according to the filtering results. View the Web Protection trend, and you can click on the indicator value below the legend to close the display of other indicators and only display the attack scale and trend of CC attack defense.
5. In the security classification event statistics below, click on CC Attack Defense to view the intercepted malicious client statistics, which can show the current number and trend distribution of triggered intercepted client IPs, and confirm the number of client IPs initiating the attack.
6. Switch to the CC Attack Defense and Rate Limiting pages separately to view the TOP rule list with the most hits for the domain name, thus clarifying the main target and corresponding method of the attack. Based on the analysis results, you can go to CC Attack Defense and Rate Limiting to configure and adjust the corresponding protection strategies.
When using Managed rules to protect against vulnerability attacks, it is necessary to test and fine-tune to avoid false-positive rate. At this time, the Site Security Overview can help you evaluate the overall recognition of the rules and quickly identify rules that may have false alarms.
In general, vulnerability attacks have sporadic characteristics, and only a few scenarios (such as scanning site vulnerabilities) may have continuous hits on Managed rules. Therefore, when observing continuous hits on fixed rules, it is necessary to rule out false alarm situations.
Example Scenario
When you continuously receive feedback from different users that their current requests are blocked and they cannot access the content of the domain www.example.com within the site example.com, you need to check whether the user's request is blocked due to hitting the security protection rule and needs to be fine-tuned. In this case, the client IP is 1.1.1.1, and the user is a trusted internal test user who is also intercepted.
Directions
1. Log in to the EdgeOne console, click on the Site List in the left menu bar, click on the site to be configured in the Site List, and enter the Site Details Page.
2. In the Site Details Page, click Data Analysis > Security Protection, and enter the Site Security Overview analysis page by default.
3. Filter and view the domain name and time range to be analyzed. In this scenario, select the security protection data of the domain www.example.com within the last 7 days.
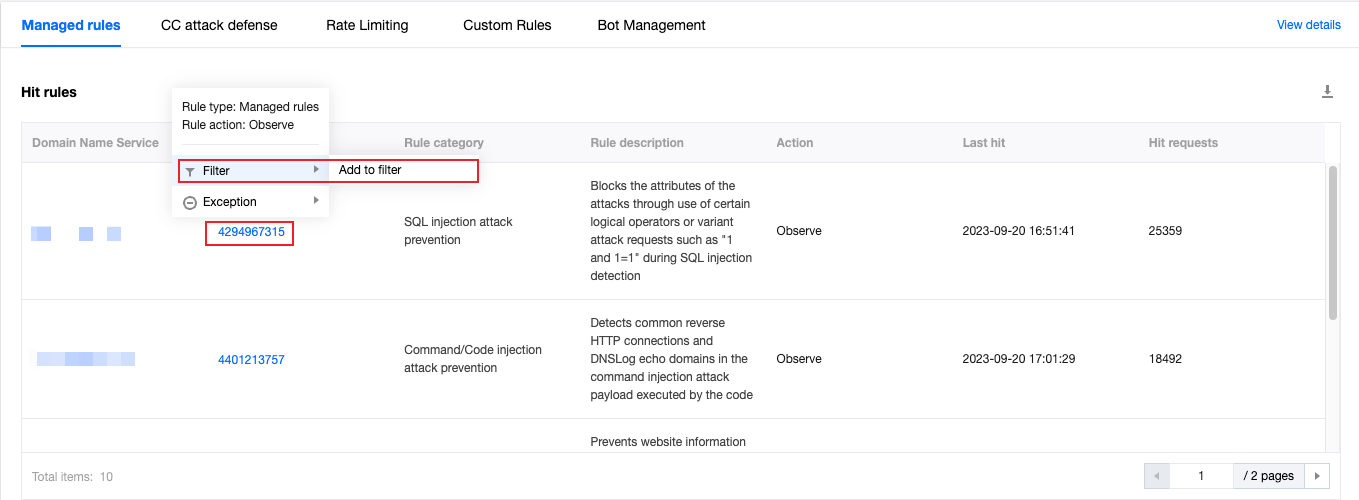
4. In the Managed Rules tab, view all hit rule statistics. When a large amount of requests hit a rule ID, click on the rule ID, select Filter > Add to Filter, and add the rule ID to the filter conditions to view all requests that hit the rule ID, the detailed request path, client IP, and hit trend information.
5. After analysis, if you find that the rule indeed intercepts normal path requests or client IPs, but also intercepts some abnormal business requests, you can click on the rule ID, select Rule Exception > Create Protection Exception Rule, and quickly create a new Web Protection Exception Rule. In this scenario, create a new rule and add the trusted client IP 1.1.1.1 to the protection exception rule to skip the scanning of the rule ID.
6. If you need to view more detailed rule hit logs, you can record the rule ID and use Web Security Analysis to further view the request samples that hit the rule ID to determine whether they are normal requests.
Scenario 3: Viewing the Overall Security Trend of All Sites
Example Scenario
After adding multiple sites and running EdgeOne stably for a period of time, to view the security protection trend of all sites and find out the sites and domain names that frequently encounter CC attacks for further strengthening the protection of the site domain name, you can follow the steps below.
Directions
1. Log in to the EdgeOne console, click on Data Analysis > Security Analysis in the left menu bar, and enter the multi-site aggregation cache analysis page, which is the Site Security Overview page by default.
2. In this page, you can view the security protection statistics of all sites. In the Security Event Classification Statistics Display below, click on CC Attack Defense to view the hit rule statistics, and you can see the domain names with the most CC rule hits, rule names, actions, and the number of requests.
3. You can further click on the corresponding domain name, add the domain name as a filter, and further analyze the trend and client distribution of the CC defense rules triggered by the domain name. Then refer to the CC Attack Defense Configuration Document to further optimize the defense strategy.


 Yes
Yes
 No
No
Was this page helpful?