When a slow query problem occurs, it is usually accompanied by the simultaneous surge of multiple monitoring metrics, such as CPU utilization and the number of slow queries.
Note:
You can view the instance CPU utilization and slow queries in the Instance Management > Instance Monitoring on the instance management page.
Common Causes
Generally, this is because that the execution efficiency of SQL statements is not high enough, which causes a large number of requests to accumulate in TencentDB for MySQL. There are two common causes:
Cause 1: The SQL statements didn't use indexes or used inefficient indexes.
Cause 2: The QPS pressure exceeded the load limit of the current instance.
Solutions
There are different solutions for the two possible causes:
Solution 1: Optimize the SQL statements to improve their execution efficiency. For more information, see measure 1.
Solution 2: Improve the configuration of the TencentDB for MySQL instance. For more information, see measure 2.
Troubleshooting
Measure 1: Optimize SQL statements
You can directly use DBbrain to optimize slow queries, which will analyze the SQL statements and give advice for adding indexes.
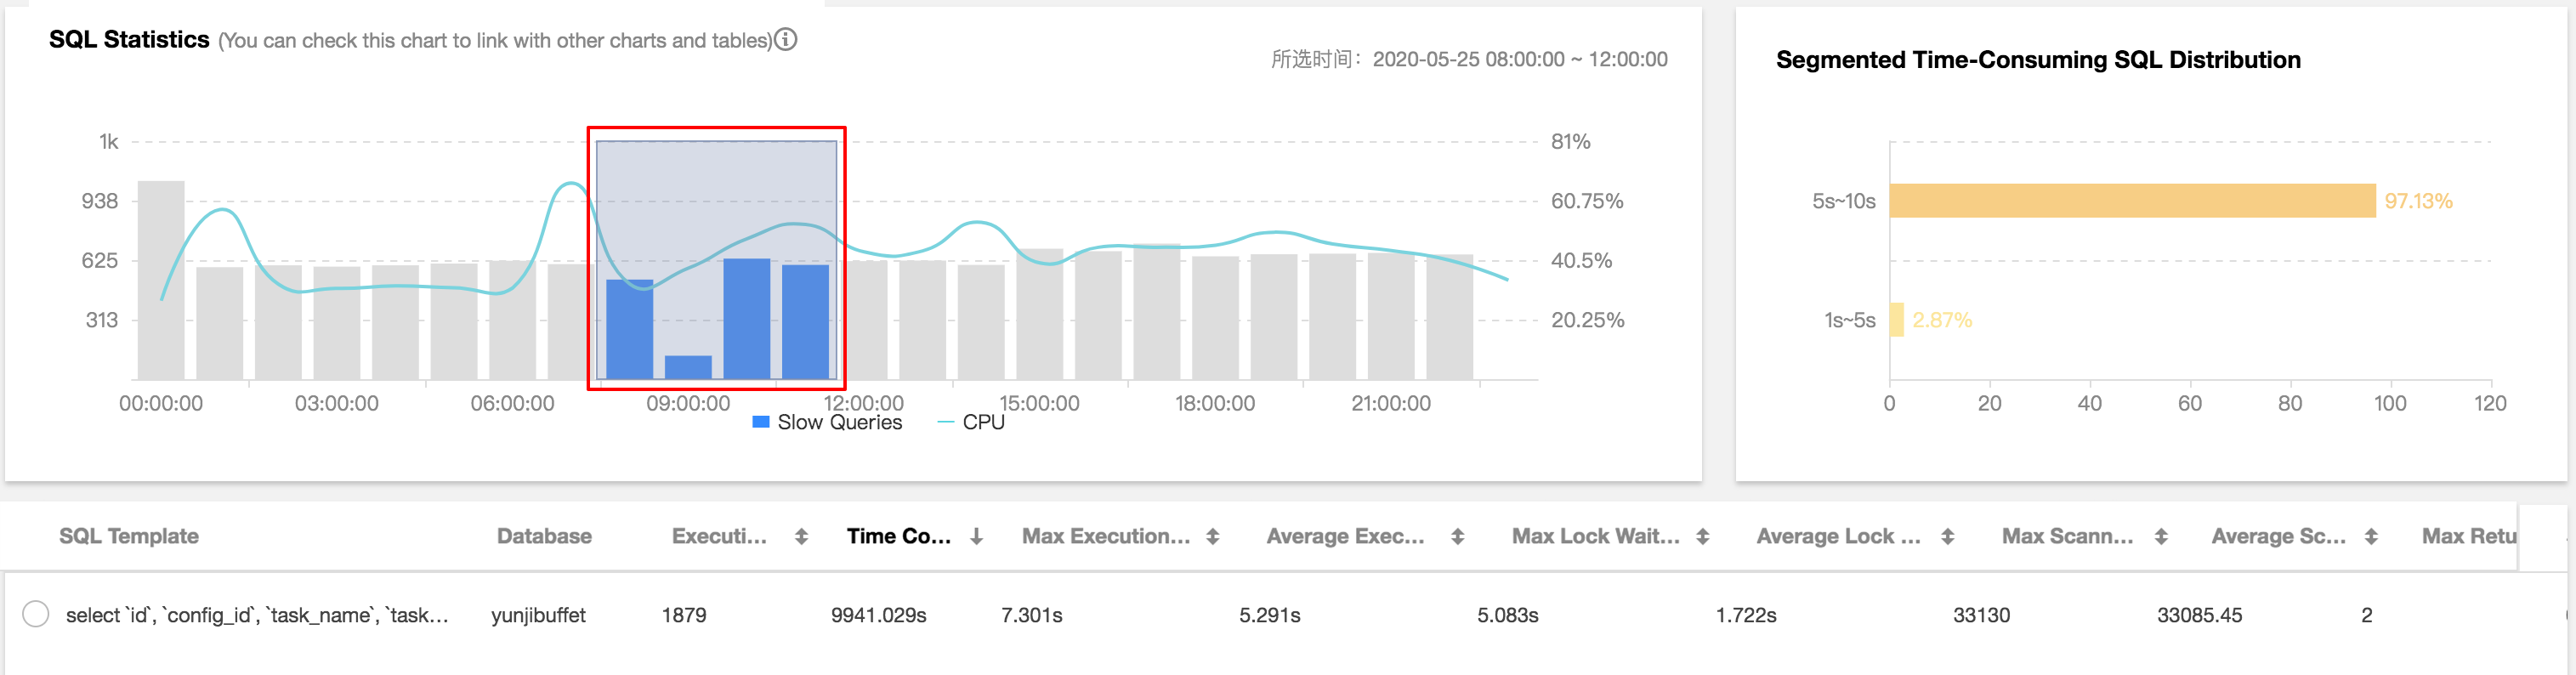
1. Log in to the DBbrain console and select Performance Optimization on the left sidebar. On the displayed page, select a database at the top and select the Slow SQL Analysis tab.
2. You can click a single time period or drag to select multiple time periods for slow queries in the SQL Statistics bar chart, and the aggregated SQL template and execution information will be displayed below, such as the number of executions, total execution duration, scanned rows, and returned rows.
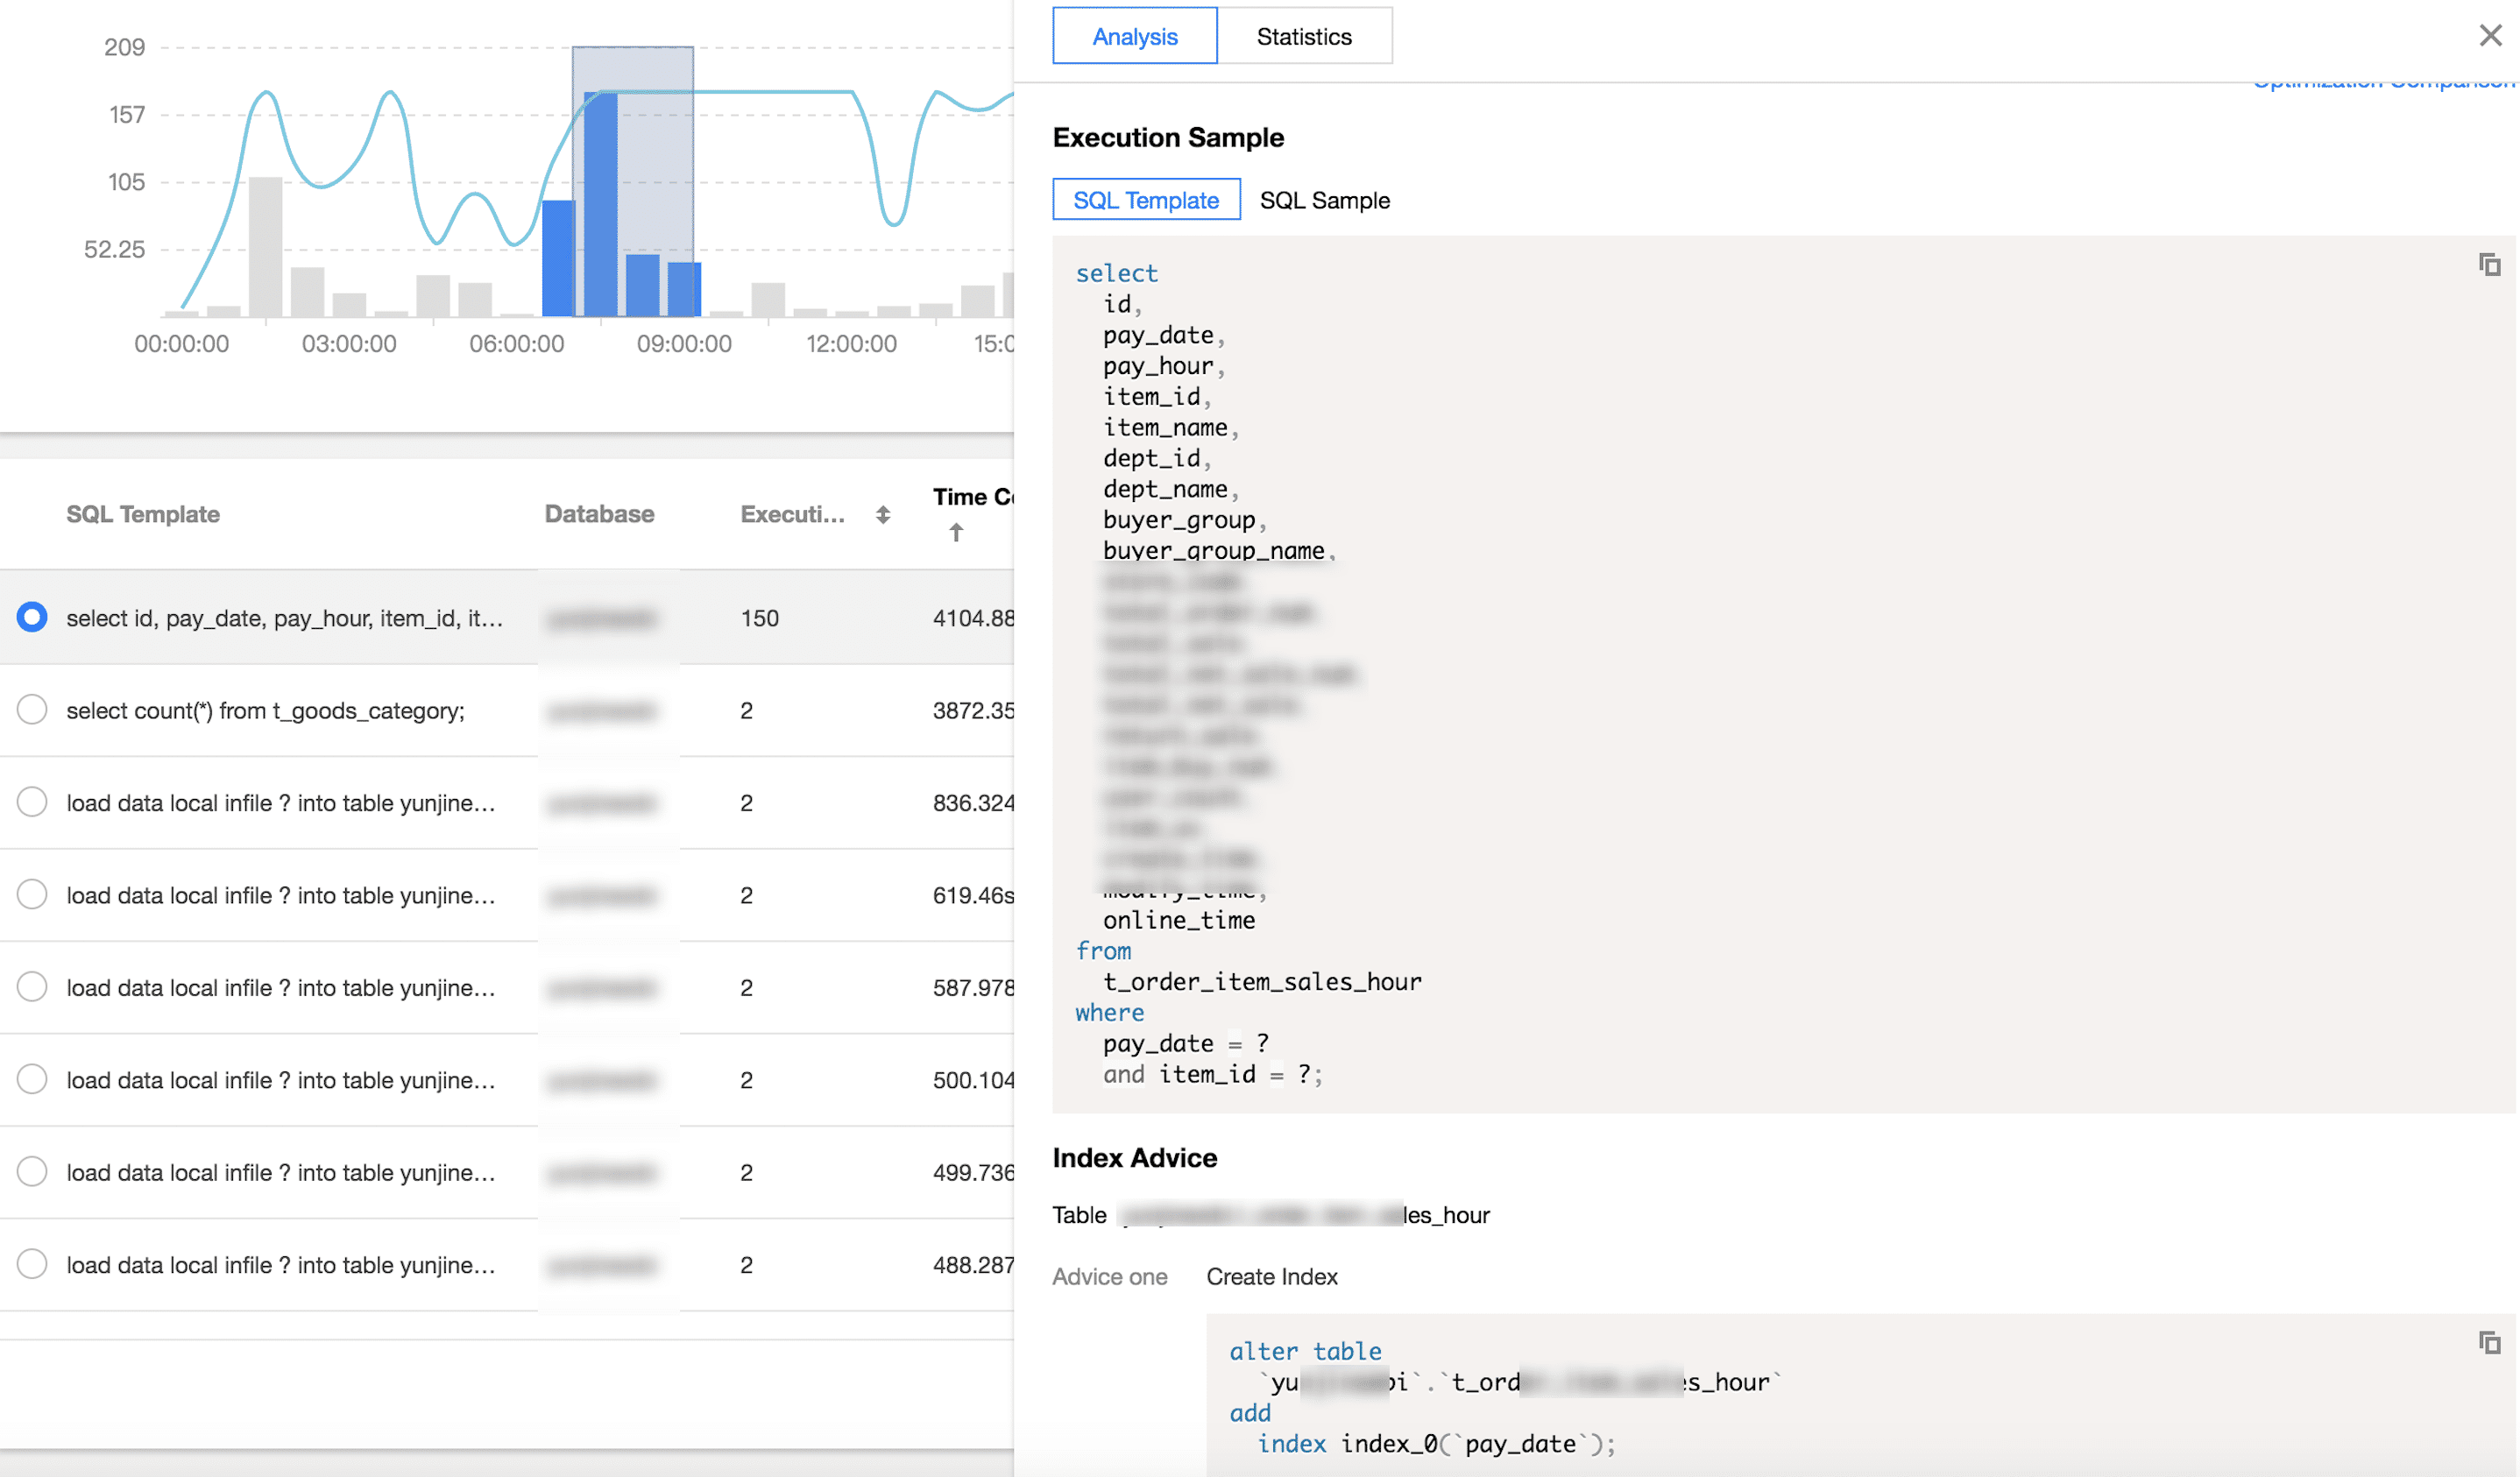
3. Click an aggregated SQL template, and specific SQL analysis and statistics will be displayed on the right. You can view the corresponding index advice.
Measure 2: Improve the TencentDB for MySQL instance configuration