- Release Notes and Announcements
- User Guide
- Product Introduction
- Purchase Guide
- Getting Started
- Operation Guide
- Access Management
- Instance Management
- Node Management
- Version Upgrade
- Monitoring
- Backup and Rollback
- Data Security
- SSL Authentication
- Database Management
- Multi-AZ Deployment
- Public Network Access
- Disaster Recovery/Read-Only Instances
- Parameter Configuration
- Recycle Bin
- Task Management
- Performance Optimization
- Data Migration Guide
- Best Practice
- Optimizing Indexes to Break Through Read/Write Performance Bottlenecks
- Troubleshooting Mongos Load Imbalance in Sharded Cluster
- Troubleshooting Excessive Slow Queries
- Fixing High CPU Utilization in MongoDB Instance Based on DBbrain
- Troubleshooting Excessive Connections
- Troubleshooting High Request Latency Based on Slow Log
- Troubleshooting High CPU Utilization
- Considerations for Using Shard Clusters
- Sample of Reading and Writing Data in MongoDB Instance
- Export and Import
- Troubleshooting MongoDB Connection Failures
- Performance Fine-Tuning
- Ops and Development Guide
- Troubleshooting
- API Documentation
- History
- Introduction
- API Category
- Making API Requests
- Instance APIs
- RenameInstance
- OfflineIsolatedDBInstance
- ModifyDBInstanceSpec
- IsolateDBInstance
- DescribeSpecInfo
- DescribeDBInstances
- DescribeClientConnections
- CreateDBInstanceHour
- AssignProject
- RenewDBInstances
- DescribeSlowLogs
- DescribeSlowLogPatterns
- InquirePriceRenewDBInstances
- InquirePriceModifyDBInstanceSpec
- InquirePriceCreateDBInstances
- DescribeDBInstanceDeal
- DescribeSecurityGroup
- DescribeInstanceParams
- ModifyDBInstanceSecurityGroup
- ModifyDBInstanceNetworkAddress
- Backup APIs
- Account APIs
- Task APIs
- Other APIs
- Data Types
- Error Codes
- Instance Connection
- FAQs
- Service Agreement
- Glossary
- Contact Us
You can view and analyze the slow logs generated during database operations in the TencentDB for MongoDB console for targeted database performance optimization.
Overview
Slow logs are often used as the basis for optimizing business operations in MongoDB. For more information, see Database Profiler.
The system provides two query methods as described below:
Query statistics: Slow logs for the specified time period are queried, and the query results are aggregated and analyzed by command (operation) type.
Query details: A specific operation command is specified to query slow logs, and the query results are displayed in a list displaying the execution durations and log details.
Version Description
Currently, all TencentDB for MongoDB versions support slow log management.
Note
The system logs operations with an execution time of more than 100 ms.
The slow logs are retained for 7 days. The time span for a single query cannot exceed 1 day.
Only the first 10,000 slow logs can be queried. If the query is slow, you can narrow down the query time period.
Prerequisites
You have created a TencentDB for MongoDB instance. For more information, see Creating TencentDB for MongoDB Instance.
The TencentDB for MongoDB replica set or sharded instance is in Running status.
Directions
Querying slow logs
1. Log in to the TencentDB for MongoDB console.
2. In the MongoDB drop-down list on the left sidebar, select Replica Set Instance or Sharded Cluster Instance. The directions for replica set instances and sharded instances are similar.
3. Above the Instance List on the right, select the region.
4. In the instance list, find the target instance.
5. Click the target instance ID to enter the Instance Details page.
6. Select the Database Management > Slow Log Query tab.
7. On the Slow Log Query tab, select a query method to query slow logs.
Query statistics: Select a query time period, set the time consumed threshold, and click Query.
Query details: Select the specific executed command to be queried in Executed Command, select a query time period, set the time consumed threshold, and click Query.
8. View and analyze the slow logs.
A statistics query result contains four fields:
Query Method: Statistics query.
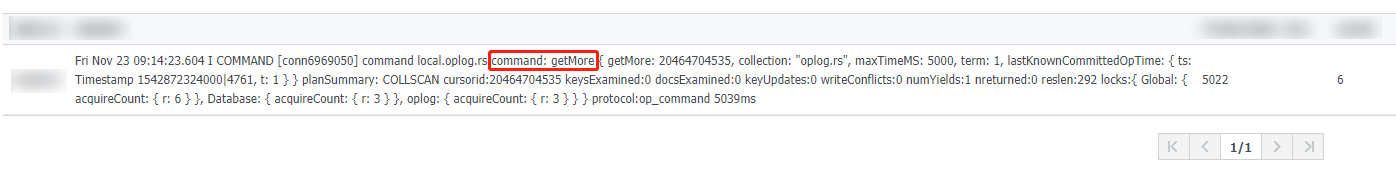
Sample Command: Output statements aggregated in the command type dimension, which records the operation of the slow log. You mainly need to refer to the command when troubleshooting problems.
Note:
Pay attention to keywords such as
command, COLLSCAN, IXSCAN, keysExamined, and docsExamined. For more log descriptions, see Log Messages.-
command indicates an operation request recorded in a slow log.COLLSCAN indicates that a full-collection scan is performed. IXSCAN indicates that an index scan is performed.keysExamined and docsExamined indicate the numbers of index entries and documents scanned respectively. Larger keysExamined and docsExamined values indicate that no index is created or the created index is less distinctive. For more information on how to optimize indexes, see Optimizing Indexes to Break Through Read/Write Performance Bottlenecks.**Average Execution Time (ms)**: Average execution time (in ms) of operations aggregated in the command type dimension.
Total: Total occurrences of operations aggregated in the command type dimension.
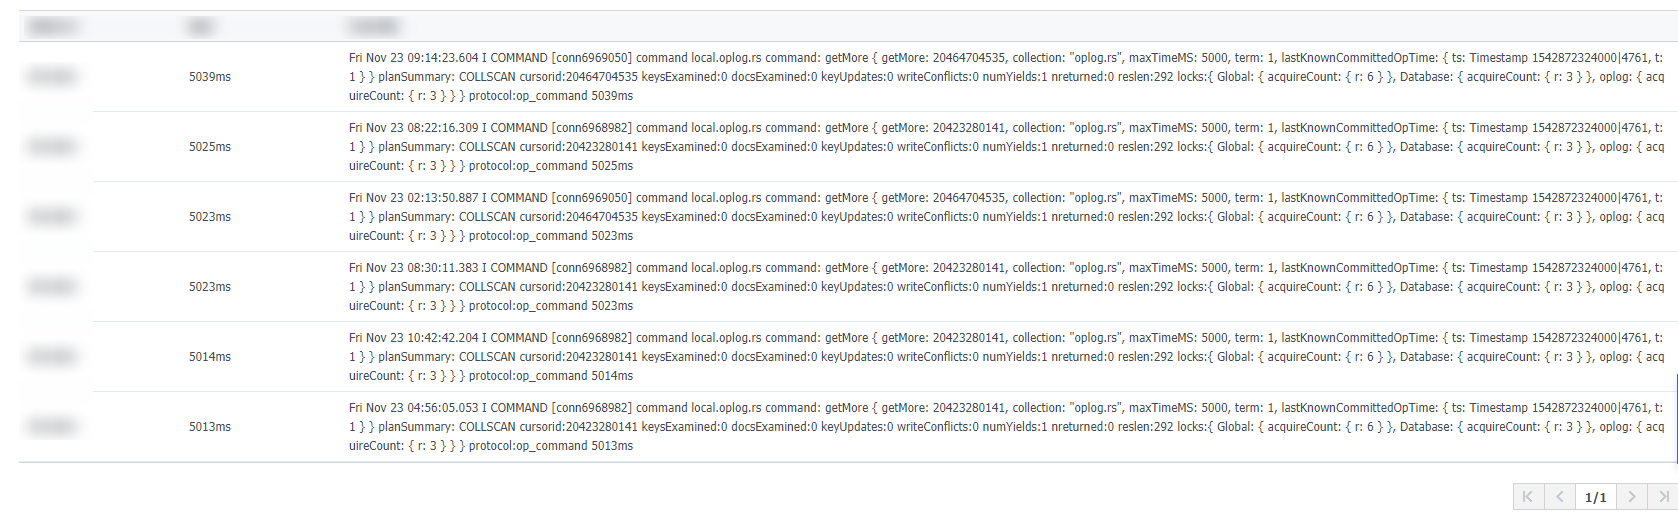
A details query result contains three fields:
Query Method: Details query.
Time Consumed: Execution time of the business command (in ms).
Log Details: Details of the business command.
Managing slow logs
Viewing a slow log request statement
1. On the Slow Query Management page, you can view the slow log request statements.
2. In the search box in the top-right corner, enter the information to be queried for search.
Parameter | Description |
Query Command | Query statement |
Op Type | Operation type |
Node Location | Node of the executed operation |
Namespace | Namespace of the database collection |
Executed Time | Time consumed |
Details | Details of the executed statement |
Batch killing
1. On the Slow Query Management page, select the slow log request statements to be cleared.
2. Click Batch Kill above the list.
3. In the Note pop-up window, read the prompt carefully.
4. Click OK.
Downloading the slow log file
1. On the Slow Log Download List page, you can view current slow log files.
2. Find the file to be downloaded and click Download in the Operation column.
Related APIs
API Name | Description |
DescribeSlowLogs | |
DescribeSlowLogPatterns |

 Yes
Yes
 No
No
Was this page helpful?