tencent cloud

Content Delivery Network

Updates and Announcements
Release Notes
Announcements
User Tutorial
Product Introduction
Product Overview
Strengths
Use Cases
Term
Use Limits
CDN Performance Descriptions (Spot-check)
Purchase Guide
CDN Purchase Guide
ECDN Purchase Guide
Getting Started
Configuring CDN from Scratch
Adding Domain Names
CNAME Configuration
Domain Name Ownership Verification
FAQs about Domain Name Connection
Configuration Guide
Domain Management
Domain Name Configurations
Statistical Analysis
Purge and Prefetch
Log Management
EdgeOne
Service Query
Offline Cache
Permission Management
Permission Configuration
Console Permissions
Activate Real-time Logging as Sub-account/Collaborator
Use Cases
Accelerating Resources on COS with CDN
Practical Tutorial
Guide to Using the EdgeOne Tool for Migrating Content Delivery Network (CDN) Related Services
CDN - CVM
CDN - COS
Configuring CNAME via DNSPod
Regularly Storing CDN Logs
API Documentation
History
Introduction
API Category
Content Management APIs
Real-time Log APIs
Service Query APIs
Data Query APIs
Making API Requests
Log Query APIs
StopCdnDomain
Configuration Management APIs
Obsoleted APIs
Other APIs
Data Types
Error Codes
FAQ
Features
Billing
FAQs about Domain Name Connection
Cache Configuration FAQs
Purge and Prefetch
Statistical Analysis
FAQs about HTTPS
Connection
Errors
Troubleshooting Methods
Status Codes and Solutions
Node Cache Inconsistency
Slow Access Speed After CDN Activation
Low Traffic Hit Rate
404 Status Code
Page Display - CORS error
Resource Cache Failure
Service Level Agreement
Glossary

Panel Configuration

PDF
Focus Mode
Font Size
Last updated: 2024-12-30 21:46:43
The new Instance Monitoring page allows you to adjust the metrics panel as needed to view the data curves of desired metrics.
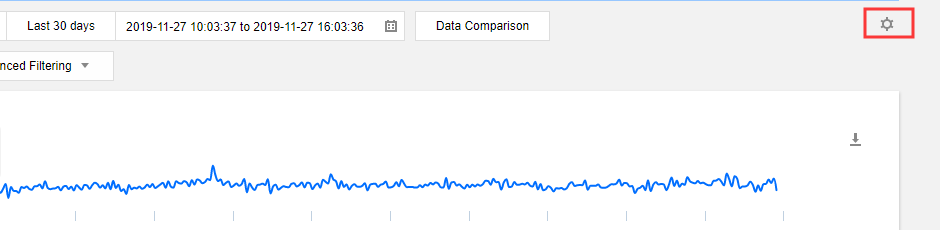
1. Log in to the CDN Console and select Statistics > Realtime Monitoring on the left sidebar to enter the management page.
2. Click the configuration icon on the right to enter the configuration page.

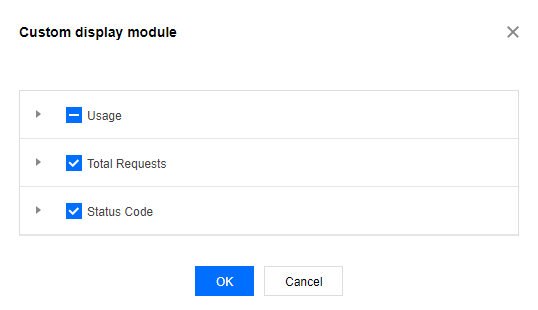
3. Select data metrics to be displayed on the overview page as needed: Selected metrics will be displayed directly. If you un-select a metric, it will no longer be displayed by default. You can customize the panel via real-time monitoring of Access Monitoring and Origin-Pull Monitoring overview pages.


Help and Support

Was this page helpful?

Help us improve! Rate your documentation experience in 5 mins.

Feedback