Cluster events include event lists and event policies.
Event list: It records key change events and abnormal events occurring in the cluster.
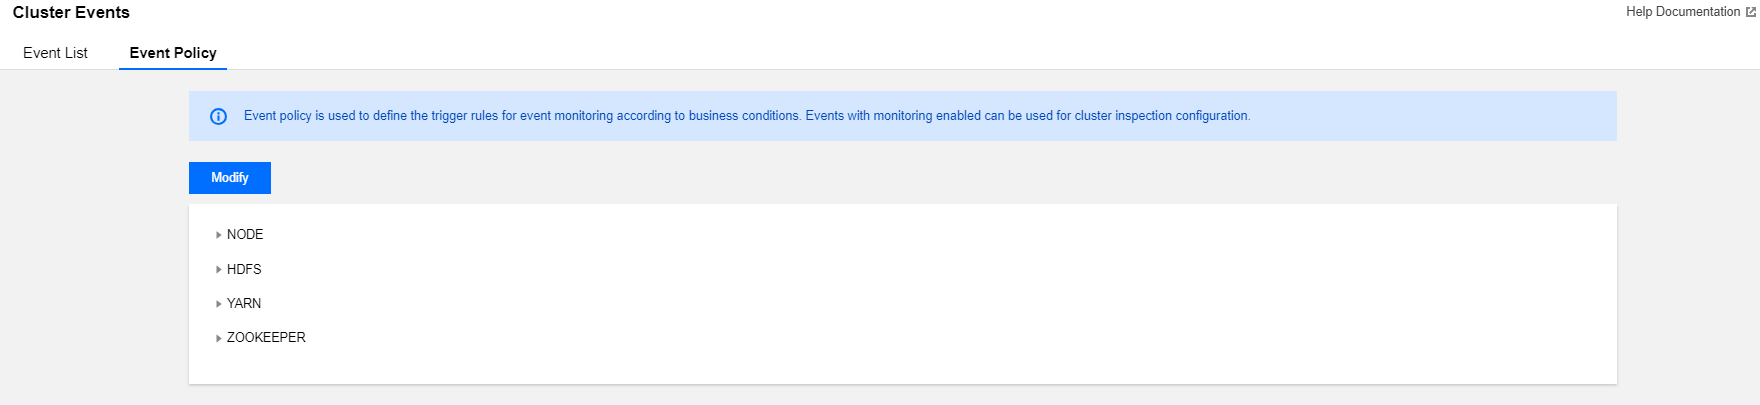
Event policy: Event monitoring trigger policies can be customized based on the actual business conditions. Events with monitoring enabled can be set as cluster inspection items.
Viewing Event List
1. Log in to the EMR console and click the ID/Name of the target cluster in the cluster list to enter the cluster details page.
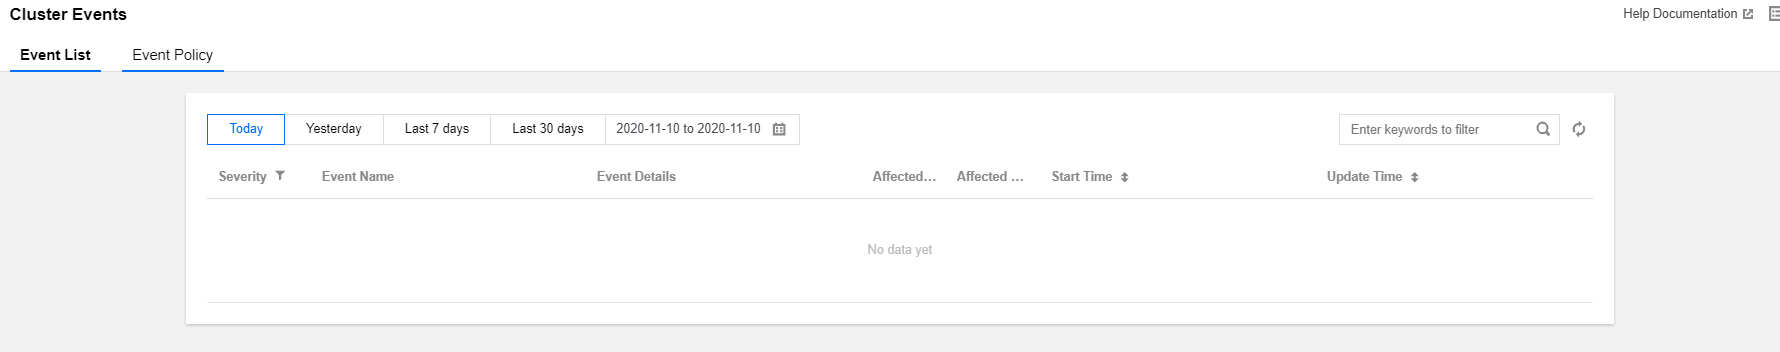
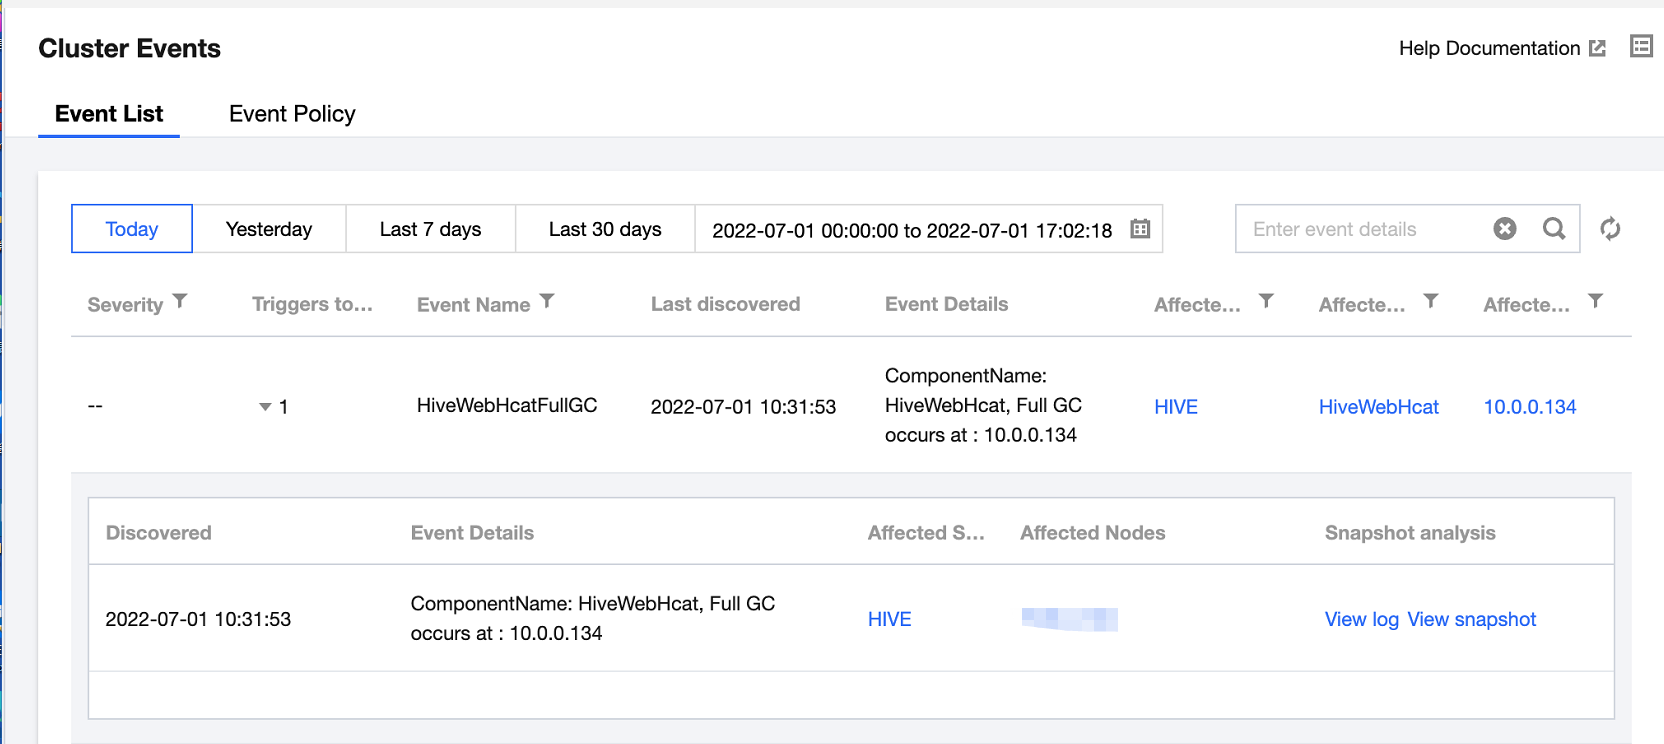
2. On the cluster details page, select Cluster monitoring > Cluster events > Event list to view all operation events in the current cluster.
The severity divides into the following:
Fatal: Exception events of a node or service that require manual intervention and will cause service interruption if left unattended. Such events may last for a period of time.
Severe: Alert events that currently have not caused service or node interruption but will cause fatal events if left unattended.
Moderate: Regular events occurring in the cluster that generally do not require special processing.
3. Click the value in the Triggers today column to view the event's trigger records, metrics, logs, and snapshots.
Setting Event Policies
1. Log in to the EMR console and click the ID/Name of the target cluster in the cluster list.
2. On the cluster details page, select Cluster monitoring > Cluster events > Event policy and you can customize the event monitoring trigger policies.
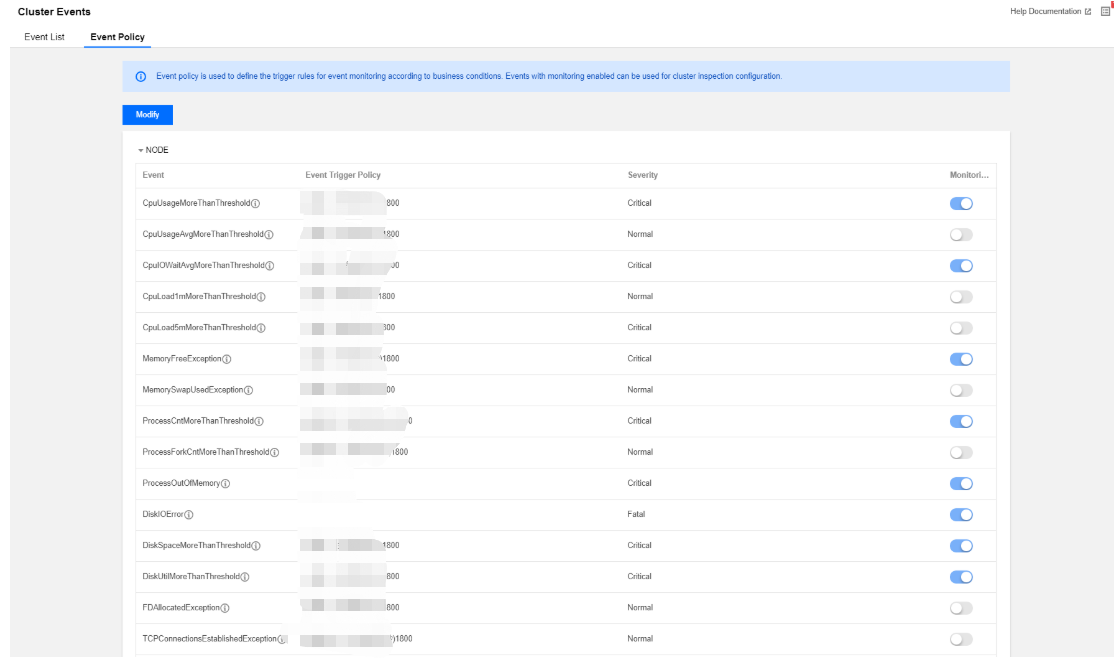
3. The event configuration list contains the event name, event trigger policy, severity (fatal, severe, and moderate), and option to enable/disable monitoring, which can be modified and saved.
4. Event trigger policies cover two types of events: fixed system policy events (which cannot be modified) and custom events (which can be configured based on the business standards).
5. You can select whether to enable event monitoring in an event policy. Only events with monitoring enabled can be selected as cluster inspection items. Monitoring is enabled by default for some events and is enabled by default and cannot be disabled for some other events. The following are the specific rules:
Category
Event Name
Description
Recommendations and Measure
Default Value
Severity
Disabling Allowed
Enabled by Default
Node
The CPU utilization exceeds the threshold continuously
The server CPU utilization has been greater than or equal to m for t (300 ≤ t ≤ 2,592,000) seconds continuously
Expand the node capacity or upgrade the node
m=85, t=1,800
Severe
Yes
Yes
The average CPU utilization exceeds the threshold
The average server CPU utilization has been greater than or equal to m for t (300 ≤ t ≤ 2,592,000) seconds continuously
Expand the node capacity or upgrade the node
m=85, t=1,800
Moderate
Yes
No
The average CPU iowait utilization exceeds the threshold
The average CPU iowait utilization of the server in the last t (300 ≤ t ≤ 2,592,000) seconds has been greater than or equal to m
Manually troubleshoot the issue
m=60, t=1,800
Severe
Yes
Yes
The 1-second CPU load exceeds the threshold continuously
The 1-minute CPU load has been greater than or equal to m for t (300 ≤ t ≤ 2,592,000) seconds continuously
Expand the node capacity or upgrade the node
m=8, t=1,800
Moderate
Yes
No
The 5-second CPU load exceeds the threshold continuously
The 5-minute CPU load has been greater than or equal to m for t (300 ≤ t ≤ 2,592,000) seconds continuously
Expand the node capacity or upgrade the node
m=8, t=1,800
Severe
Yes
No
The memory utilization exceeds the threshold continuously
The memory utilization has been greater than or equal to m for t (300 ≤ t ≤ 2,592,000) seconds continuously
Expand the node capacity or upgrade the node
m=85, t=1,800
Severe
Yes
Yes
The swap space exceeds the threshold continuously
The server swap memory has been greater than or equal to m for t (300 ≤ t ≤ 2,592,000) seconds continuously
Expand the node capacity or upgrade the node
m=0.1, t=300
Medium
Yes
No
The total number of system processes exceeds the threshold continuously
The total number of system processes has been greater than or equal to m for t (300 ≤ t ≤ 2,592,000) seconds continuously
Manually troubleshoot the issue
m=10,000, t=1,800
Severe
Yes
Yes
The average total number of fork subprocesses exceeds the threshold
The average total number of fork subprocesses in the last t (300 ≤ t ≤ 2,592,000) seconds has been greater than or equal to m
Manually troubleshoot the issue
m=5,000, t=1,800
Moderate
Yes
No
No process OOM
An OOM error occurred in the process
Adjust the process heap memory size
-
Severe
No
Yes
A disk I/O error occurred (this event is not supported currently)
A disk I/O error occurred
Replace the disk
-
Fatal
Yes
Yes
The average disk utilization exceeds the threshold continuously
The average disk space utilization has been greater than or equal to m for t (300 ≤ t ≤ 2,592,000) seconds continuously
Expand the node capacity or upgrade the node
m=85, t=1,800
Severe
Yes
Yes
The average disk I/O utilization exceeds the threshold continuously
The average disk I/O utilization has been greater than or equal to m for t (300 ≤ t ≤ 2,592,000) seconds continuously
Expand the node capacity or upgrade the node
m=85, t=1,800
Severe
Yes
Yes
The node file handle utilization exceeds the threshold continuously
The node file handle utilization has been greater than or equal to m for t (300 ≤ t ≤ 2,592,000) seconds continuously
Manually troubleshoot the issue
m=85, t=1,800
Moderate
Yes
No
The number of TCP connections to the node exceeds the threshold continuously
The number of TCP connections to the node has been greater than or equal to m for t (300 ≤ t ≤ 2,592,000) seconds continuously
Check whether there are connection leaks
m=10,000, t=1,800
Moderate
Yes
No
The configured node memory utilization exceeds the threshold
The memory utilization configured for all roles on the node exceeds the node's physical memory threshold
Adjust the allocated node process heap memory
90%
Severe
Yes
No
The node process is unavailable
The node service process is unavailable
View the service logs to find out why the service failed to be pulled
-
Moderate
Yes
Yes
The node heartbeat is missing
The node heartbeat failed to be reported regularly
Manually troubleshoot the issue
-
Fatal
No
Yes
The hostname is incorrect
The node's hostname is incorrect
Manually troubleshoot the issue
-
Fatal
No
Yes
Failed to ping the metadatabase
The TencentDB instance heartbeat failed to be reported regularly
-
-
-
-
-
The utilization of a single disk exceeds the threshold continuously
The single disk space utilization has been greater than or equal to m for t (300 ≤ t ≤ 2,592,000) seconds continuously
Expand the node capacity or upgrade the node
m=0.85, t=1,800
Severe
Yes
Yes
The I/O utilization of a single disk exceeds the threshold continuously
The single disk I/O device utilization has been greater than or equal to m for t (300 ≤ t ≤ 2,592,000) seconds continuously
Expand the node capacity or upgrade the node
m=0.85, t=1,800
Severe
Yes
Yes
The single disk inodes utilization exceeds the threshold continuously
The single disk inodes utilization has been greater than or equal to m for t (300 ≤ t ≤ 2,592,000) seconds continuously
Expand the node capacity or upgrade the node
m=0.85, t=1,800
Severe
Yes
Yes
The difference between the UTC time and NTP time of the server exceeds the threshold
The difference between the UTC time and NTP time of the server exceeds the threshold (in ms)
1. Make sure that the NTP daemon is running
2. Make sure that the network communication with the NTP server is normal
Difference=30000
Severe
Yes
Yes
Automatic node replenishment
If automatic node replenishment is enabled, when any exceptions in task and router nodes are detected, the system automatically purchases nodes of the same model to replace the affected nodes.
1. If the replenishment is successful, no more attention is required.
2. If the replenishment fails, manually terminate the affected nodes in the console and purchase new nodes to replace them.
The total number of HDFS files exceeds the threshold continuously
The total number of files in the cluster has been greater than or equal to m for t (300 ≤ t ≤ 2,592,000) seconds continuously
Increase the NameNode memory
m=50,000,000, t=1,800
Severe
Yes
No
The average total number of HDFS files exceeds the threshold
The average total number of files in the cluster in the last t (300 ≤ t ≤ 2,592,000) seconds has been greater than or equal to m
Increase the NameNode memory
m=50,000,000, t=1,800
Severe
Yes
No
The total number of HDFS blocks exceeds the threshold continuously
The total number of blocks in the cluster has been greater than or equal to m for t (300 ≤ t ≤ 2,592,000) seconds continuously
Increase the NameNode memory or the block size
m=50,000,000, t=1,800
Severe
Yes
No
The average total number of HDFS blocks exceeds the threshold
The average total number of HDFS blocks in the last t (300 ≤ t ≤ 2,592,000) seconds has been greater than or equal to m
Increase the NameNode memory or the block size
m=50,000,000, t=1,800
Severe
Yes
No
The number of HDFS data nodes marked as dead exceeds the threshold continuously
The number of data nodes marked as dead has been greater than or equal to m for t (300 ≤ t ≤ 2,592,000) seconds continuously
Manually troubleshoot the issue
m=1, t=1,800
Moderate
Yes
No
The HDFS storage space utilization exceeds the threshold continuously
The HDFS storage space utilization has been greater than or equal to m for t (300 ≤ t ≤ 2,592,000) seconds continuously
Clear files in HDFS or expand the cluster capacity
m=85, t=1,800
Severe
Yes
Yes
The average HDFS storage space utilization exceeds the threshold
The average HDFS storage space utilization has been greater than or equal to m for t (300 ≤ t ≤ 2,592,000) seconds continuously
Clear files in HDFS or expand the cluster capacity
m=85, t=1,800
Severe
Yes
No
Active/Standby NameNodes were switched
Active/Standby NameNodes were switched
Locate the cause of NameNode switch
-
Severe
Yes
Yes
The NameNode RPC request processing latency exceeds the threshold continuously
The RPC request processing latency has been greater than or equal to m milliseconds for t (300 ≤ t ≤ 2,592,000) seconds continuously
Manually troubleshoot the issue
m=300, t=300
Severe
Yes
No
The number of current NameNode connections exceeds the threshold continuously
The number of current NameNode connections has been greater than or equal to m for t (300 ≤ t ≤ 2,592,000) seconds continuously
Manually troubleshoot the issue
m=2,000, t=1,800
Moderate
Yes
No
A full GC event occurred on a NameNode
A full GC event occurred on a NameNode
Fine-tune the parameter settings
-
Severe
Yes
Yes
The NameNode JVM memory utilization exceeds the threshold continuously
The NameNode JVM memory utilization has been greater than or equal to m for t (300 ≤ t ≤ 2,592,000) seconds continuously
Adjust the NameNode heap memory size
m=85, t=1,800
Severe
Yes
Yes
The DataNode RPC request processing latency exceeds the threshold continuously
The RPC request processing latency has been greater than or equal to m milliseconds for t (300 ≤ t ≤ 2,592,000) seconds continuously
Manually troubleshoot the issue
m=300, t=300
Moderate
Yes
No
The number of current DataNode connections exceeds the threshold continuously
The number of current DataNode connections has been greater than or equal to m for t (300 ≤ t ≤ 2,592,000) seconds continuously
Manually troubleshoot the issue
m=2,000, t=1,800
Moderate
Yes
No
A full GC event occurred on a DataNode
A full GC event occurred on a NameNode
Fine-tune the parameter settings
-
Moderate
Yes
No
The DataNode JVM memory utilization exceeds the threshold continuously
The NameNode JVM memory utilization has been greater than or equal to m for t (300 ≤ t ≤ 2,592,000) seconds continuously
Adjust the DataNode heap memory size
m=85, t=1,800
Moderate
Yes
Yes
Both NameNodes of HDFS are in Standby service status
Both NameNode roles are in Standby status at the same time
Manually troubleshoot the issue
-
Severe
Yes
Yes
The number of HDFS missing blocks exceeds the threshold
The number of missing blocks in the cluster has been greater than or equal to m for t (300 ≤ t ≤ 604,800) seconds continuously
We recommend you troubleshoot HDFS data block corruption and run the
hadoop fsck /
command to check the HDFS file distribution
m=1, t=1,800
Severe
Yes
Yes
The HDFS NameNode entered the safe mode
The NameNode entered the safe mode (for 300 seconds continuously)
We recommend you troubleshoot HDFS data block corruption and run the
hadoop fsck /
command to check the HDFS file distribution
-
Severe
Yes
Yes
YARN
The number of currently missing NodeManagers in the cluster exceeds the threshold continuously
The number of currently missing NodeManagers in the cluster has been greater than or equal to m for t (300 ≤ t ≤ 2,592,000) seconds continuously
Check the NodeManager process status and check whether the network connection is smooth
m=1, t=1,800
Moderate
Yes
No
The number of pending containers exceeds the threshold continuously
The number of pending containers has been greater than or equal to m for t (300 ≤ t ≤ 2,592,000) seconds continuously
Reasonably specify resources that can be used by YARN jobs
m=90, t=1,800
Moderate
Yes
No
The cluster memory utilization exceeds the threshold continuously
The memory utilization has been greater than or equal to m for t (300 ≤ t ≤ 2,592,000) seconds continuously
Scale out the cluster
m=85, t=1,800
Severe
Yes
Yes
The average cluster memory utilization exceeds the threshold
The average memory utilization in the last t (300 ≤ t ≤ 2,592,000) seconds has been greater than or equal to m
Scale out the cluster
m=85, t=1,800
Severe
Yes
No
The cluster CPU utilization exceeds the threshold continuously
The CPU utilization has been greater than or equal to m for t (300 ≤ t ≤ 2,592,000) seconds continuously
Scale out the cluster
m=85, t=1,800
Severe
Yes
Yes
The average cluster CPU utilization exceeds the threshold
The average CPU utilization in the last t (300 ≤ t ≤ 2,592,000) seconds has been greater than or equal to m
Scale out the cluster
m=85, t=1,800
Severe
Yes
No
The number of available CPU cores in each queue is below the threshold continuously.
The number of available CPU cores in each queue has been less than or equal to m for t (300 ≤ t ≤ 2,592,000) seconds continuously
Assign more resources to the queue
m=1, t=1,800
Moderate
Yes
No
The available memory in each queue is below the threshold continuously
The available memory in each queue has been less than or equal to m for t (300 ≤ t ≤ 2,592,000) seconds continuously
Assign more resources to the queue
m=1,024, t=1,800
Moderate
Yes
No
Active/Standby ResourceManagers were switched
Active/Standby ResourceManagers were switched
Check the ResourceManager process status and view the standby ResourceManager logs to locate the cause of active/standby switch
-
Severe
Yes
Yes
A full GC event occurred in a ResourceManager
A full GC event occurred in a ResourceManager
Fine-tune the parameter settings
-
Severe
Yes
Yes
The ResourceManager JVM memory utilization exceeds the threshold continuously
The ResourceManager JVM memory utilization has been greater than or equal to m for t (300 ≤ t ≤ 2,592,000) seconds continuously
Adjust the ResourceManager heap memory size
m=85, t=1,800
Severe
Yes
Yes
A full GC event occurred in a NodeManager
A full GC event occurred in a NodeManager
Fine-tune the parameter settings
-
Moderate
Yes
No
The available memory in NodeManager is below the threshold continuously
The available memory in a single NodeManager has been less than or equal to m for t (300 ≤ t ≤ 2,592,000) seconds continuously
Adjust the NodeManager heap memory size
m=1, t=1,800
Moderate
Yes
No
The NodeManager JVM memory utilization exceeds the threshold continuously
The NodeManager JVM memory utilization has been greater than or equal to m for t (300 ≤ t ≤ 2,592,000) seconds continuously
Adjust the NodeManager heap memory size
m=85, t=1,800
Moderate
Yes
No
HBase
The number of regions in RIT status in the cluster exceeds the threshold continuously
The number of regions in RIT status in the cluster has been greater than or equal to m for t (300 ≤ t ≤ 2,592,000) seconds continuously
If the HBase version is below 2.0, run
hbase hbck -fixAssigment
m=1, t=60
Severe
Yes
Yes
The number of dead RegionServers exceeds the threshold continuously
The number of dead RegionServers has been greater than or equal to m for t (300 ≤ t ≤ 2,592,000) seconds continuously
Manually troubleshoot the issue
m=1, t=300
Moderate
Yes
Yes
The average number of regions in each RegionServer in the cluster exceeds the threshold continuously
The average number of regions in each RegionServer in the cluster has been greater than or equal to m for t (300 ≤ t ≤ 2,592,000) seconds continuously
Expand the node capacity or upgrade the node
m=300, t=1,800
Moderate
Yes
Yes
A full GC event occurred on HMaster
A full GC event occurred on HMaster
Fine-tune the parameter settings
m=5, t=300
Moderate
Yes
Yes
The HMaster JVM memory utilization exceeds the threshold continuously
The HMaster JVM memory utilization has been greater than or equal to m for t (300 ≤ t ≤ 2,592,000) seconds continuously
Adjust the HMaster heap memory size
m=85, t=1800
Severe
Yes
Yes
The number of current HMaster connections exceeds the threshold continuously
The number of current HMaster connections has been greater than or equal to m for t (300 ≤ t ≤ 2,592,000) seconds continuously
Manually troubleshoot the issue
m=1000, t=1800
Moderate
Yes
No
A full GC event occurred in RegionServer
A full GC event occurred in RegionServer
Fine-tune the parameter settings
m=5, t=300
Severe
Yes
No
The RegionServer JVM memory utilization exceeds the threshold continuously
The RegionServer JVM memory utilization has been greater than or equal to m for t (300 ≤ t ≤ 2,592,000) seconds continuously
Adjust the RegionServer heap memory size
m=85, t=1800
Moderate
Yes
No
The number of current RPC connections to RegionServer exceeds the threshold continuously
The number of current RPC connections to RegionServer has been greater than or equal to m for t (300 ≤ t ≤ 2,592,000) seconds continuously
Manually troubleshoot the issue
m=1000, t=1800
Moderate
Yes
No
The number of RegionServer StoreFiles exceeds the threshold continuously
The number of RegionServer StoreFiles has been greater than or equal to m for t (300 ≤ t ≤ 2,592,000) seconds continuously
Run the major compaction
m=50,000, t=1,800
Moderate
Yes
No
A full GC event occurred in HBase Thrift
A full GC event occurred in HBase Thrift
Fine-tune the parameter settings
m=5, t=300
Severe
Yes
No
The HBase Thrift JVM memory utilization exceeds the threshold continuously
The HBase Thrift JVM memory utilization has been greater than or equal to m for t (300 ≤ t ≤ 2,592,000) seconds continuously
Adjust the HBase Thrift heap memory size
m=85, t=1,800
Moderate
Yes
No
Both HMasters of HBase is in Standby service status
Both HMaster roles are in Standby status at the same time
Manually troubleshoot the issue
-
Severe
Yes
Yes
Hive
A full GC event occurred in HiveServer2
A full GC event occurred in HiveServer2
Fine-tune the parameter settings
m=5, t=300
Severe
Yes
Yes
The HiveServer2 JVM memory utilization exceeds the threshold continuously
The HiveServer2 JVM memory utilization has been greater than or equal to m for t (300 ≤ t ≤ 2,592,000) seconds continuously
Adjust the HiveServer2 heap memory size
m=85, t=1,800
Severe
Yes
Yes
A full GC event occurred in HiveMetaStore
A full GC event occurred in HiveMetaStore
Fine-tune the parameter settings
m=5, t=300
Moderate
Yes
Yes
A full GC event occurred in HiveWebHcat
A full GC event occurred in HiveWebHcat
Fine-tune the parameter settings
m=5, t=300
Moderate
Yes
Yes
ZooKeeper
The number of ZooKeeper connections exceeds the threshold continuously
The number of ZooKeeper connections has been greater than or equal to m for t (300 ≤ t ≤ 2,592,000) seconds continuously
Manually troubleshoot the issue
m=65,535, t=1,800
Moderate
Yes
No
The number of ZNodes exceeds the threshold continuously
The number of ZNodes has been greater than or equal to m for t (300 ≤ t ≤ 2,592,000) seconds continuously
Manually troubleshoot the issue
m=2,000, t=1,800
Moderate
Yes
No
Impala
The ImpalaCatalog JVM memory utilization exceeds the threshold continuously
The ImpalaCatalog JVM memory utilization has been greater than or equal to m for t (300 ≤ t ≤ 604,800) seconds continuously
Adjust the ImpalaCatalog heap memory size
m=0.85, t=1,800
Moderate
Yes
No
The Impala daemon JVM memory utilization exceeds the threshold continuously
The Impala daemon JVM memory utilization has been greater than or equal to m for t (300 ≤ t ≤ 604,800) seconds continuously
Adjust the Impala daemon heap memory size
m=0.85, t=1,800
Moderate
Yes
No
The number of Impala Beeswax API client connections exceeds the threshold
The number of Impala Beeswax API client connections has been greater than or equal to m
Adjust the value of
fs_sevice_threads
in the
impalad.flgs
configuration in the console
m=64, t=120
Severe
Yes
Yes
The number of Impala HiveServer2 client connections exceeds the threshold
The number of Impala HiveServer2 client connections has been greater than or equal to m
Adjust the value of
fs_sevice_threads
in the
impalad.flgs
configuration in the console
m=64, t=120
Severe
Yes
Yes
The query execution duration exceeds the threshold
The query execution duration exceeds m seconds
Manually troubleshoot the issue
-
Severe
Yes
No
The total number of failed queries exceeds the threshold
The total number of failed queries has been greater than or equal to m for t seconds (300 ≤ t ≤ 604,800)
Manually troubleshoot the issue
m=1, t=300
Severe
Yes
No
The total number of committed queries exceeds the threshold
The total number of committed queries has been greater than or equal to m for t seconds (300 ≤ t ≤ 604,800)
Manually troubleshoot the issue
m=1, t=300
Severe
Yes
No
The query execution failure rate exceeds the threshold
The query execution failure rate has been greater than or equal to m for t seconds (300 ≤ t ≤ 604,800)
Manually troubleshoot the issue
m=1, t=300
Severe
Yes
No
PrestoSQL
The current number of failed PrestoSQL nodes exceeds the threshold continuously
The current number of failed PrestoSQL nodes has been greater than or equal to m for t (300 ≤ t ≤ 604,800) seconds continuously
Manually troubleshoot the issue
m=1, t=1,800
Severe
Yes
Yes
The number of queuing resources in the current PrestoSQL resource group exceeds the threshold continuously
The number of queuing tasks in the PrestoSQL resource group has been greater than or equal to m for t (300 ≤ t ≤ 604,800) seconds continuously
Fine-tune the parameter settings
m=5,000, t=1,800
Severe
Yes
Yes
The number of failed PrestoSQL queries exceeds the threshold
The number of failed PrestoSQL queries is greater than or equal to m
Manually troubleshoot the issue
m=1, t=1,800
Severe
Yes
No
A full GC event occurred in a PrestoSQLCoordinator
A full GC event occurred in a PrestoSQLCoordinator
Fine-tune the parameter settings
-
Moderate
Yes
No
The PrestoSQLCoordinator JVM memory utilization exceeds the threshold continuously
The PrestoSQLCoordinator JVM memory utilization has been greater than or equal to m for t (300 ≤ t ≤ 604,800) seconds continuously
Adjust the PrestoSQLCoordinator heap memory size
m=0.85, t=1,800
Severe
Yes
Yes
A full GC event occurred on a PrestoSQL worker
A full GC event occurred on a PrestoSQL worker
Fine-tune the parameter settings
-
Moderate
Yes
No
The PrestoSQLWorker JVM memory utilization exceeds the threshold continuously
The PrestoSQLWorker JVM memory utilization has been greater than or equal to m for t (300 ≤ t ≤ 604,800) seconds continuously
Adjust the PrestoSQLWorker heap memory size
m=0.85, t=1,800
Severe
Yes
No
Presto
The current number of failed Presto nodes exceeds the threshold continuously
The current number of failed Presto nodes has been greater than or equal to m for t (300 ≤ t ≤ 604,800) seconds continuously
Manually troubleshoot the issue
m=1, t=1,800
Severe
Yes
Yes
The number of queuing resources in the current Presto resource group exceeds the threshold continuously
The number of queuing tasks in the Presto resource group has been greater than or equal to m for t (300 ≤ t ≤ 604,800) seconds continuously
Fine-tune the parameter settings
m=5,000, t=1,800
Severe
Yes
Yes
The number of failed Presto queries exceeds the threshold
The number of failed Presto queries is greater than or equal to m
Manually troubleshoot the issue
m=1, t=1,800
Severe
Yes
No
A full GC event occurred on a PrestoSQL coordinator
A full GC event occurred on a PrestoSQL coordinator
Fine-tune the parameter settings
-
Moderate
Yes
No
The Presto coordinator JVM memory utilization exceeds the threshold continuously
The Presto coordinator JVM memory utilization has been greater than or equal to m for t (300 ≤ t ≤ 604,800) seconds continuously
Adjust the Presto coordinator heap memory size
m=0.85, t=1,800
Moderate
Yes
Yes
A full GC event occurred on a Presto worker
A full GC event occurred on a Presto worker
Fine-tune the parameter settings
-
Moderate
Yes
No
The Presto worker JVM memory utilization exceeds the threshold continuously
The Presto worker JVM memory utilization has been greater than or equal to m for t (300 ≤ t ≤ 604,800) seconds continuously
Adjust the Presto worker heap memory size
m=0.85, t=1,800
Severe
Yes
No
Alluxio
The current total number of Alluxio workers is below the threshold continuously
The current total number of Alluxio workers has been smaller than or equal to m for t (300 ≤ t ≤ 604,800) seconds continuously
Manually troubleshoot the issue
m=1, t=1,800
Severe
Yes
No
The utilization of the capacity on all tiers of the current Alluxio worker exceeds the threshold
The utilization of the capacity on all tiers of the current Alluxio worker has been greater than or equal to the threshold for t (300 ≤ t ≤ 604,800) seconds continuously
Fine-tune the parameter settings
m=0.85, t=1,800
Severe
Yes
No
A full GC event occurred on an Alluxio master
A full GC event occurred on an Alluxio master
Manually troubleshoot the issue
-
Moderate
Yes
No
The Alluxio master JVM memory utilization exceeds the threshold continuously
The Alluxio master JVM memory utilization has been greater than or equal to m for t (300 ≤ t ≤ 604,800) seconds continuously
Adjust the Alluxio worker heap memory size
m=0.85, t=1,800
Severe
Yes
Yes
A full GC event occurred on an Alluxio worker
A full GC event occurred on an Alluxio worker
Manually troubleshoot the issue
-
Moderate
Yes
No
The Alluxio worker JVM memory utilization exceeds the threshold continuously
The Alluxio worker JVM memory utilization has been greater than or equal to m for t (300 ≤ t ≤ 604,800) seconds continuously
Adjust the Alluxio master heap memory size
m=0.85, t=1,800
Severe
Yes
Yes
kudu
The cluster replica skew exceeds the threshold
The cluster replica skew has been greater than or equal to the threshold for t (300 ≤ t ≤ 3,600) seconds continuously
Run the
rebalance
command to balance the replicas
m=100, t=300
Moderate
Yes
Yes
The hybrid clock error exceeds the threshold
The hybrid clock error has been greater than or equal to the threshold for t (300 ≤ t ≤ 3,600) seconds continuously
Make sure that the NTP daemon is running and the network communication with the NTP server is normal
m=5,000,000, t=300
Moderate
Yes
Yes
The number of running tablets exceeds the threshold
The number of running tablets has been greater than or equal to m for t (300 ≤ t ≤ 3,600) seconds continuously
Too many tablets on a node can affect the performance. We recommend you clear unnecessary tables and partitions or expand the capacity as needed.
m=1,000, t=300
Moderate
Yes
Yes
The number of failed tablets exceeds the threshold
The number of failed tablets has been greater than or equal to m for t (300 ≤ t ≤ 3,600) seconds continuously
Check whether any disk is unavailable or data file is corrupted
m=1, t=300
Moderate
Yes
Yes
The number of failed data directories exceeds the threshold
The number of failed data directories has been greater than or equal to m for t (300 ≤ t ≤ 3,600) seconds continuously
Check whether the path configured in the
fs_data_dirs
parameter is available
m=1, t=300
Severe
Yes
Yes
The number of full data directories exceeds the threshold
The number of full data directories has been greater than or equal to m for t (120 ≤ t ≤ 3,600) seconds continuously
Clear unnecessary data files or expand the capacity as needed
m=1, t=120
Severe
Yes
Yes
The number of write requests rejected due to queue overloading exceeds the threshold
The number of write requests rejected due to queue overloading has been greater than or equal to m for t (300 ≤ t ≤ 3,600) seconds continuously
Check whether the number of write hotspots or worker threads is small
m=10, t=300
Moderate
Yes
No
The number of expired scanners exceeds the threshold
The number of expired scanners has been greater than or equal to m for t (300 ≤ t ≤ 3,600) seconds continuously
Be sure to call the method for closing a scanner after reading data
m=100, t=300
Moderate
Yes
Yes
The number of error logs exceeds the threshold
The number of error logs has been greater than or equal to m for t (300 ≤ t ≤ 3,600) seconds continuously
Manually troubleshoot the issue
m=10, t=300
Moderate
Yes
Yes
The number of RPC requests that timed out while waiting in the queue exceeds the threshold
The number of RPC requests that timed out while waiting in the queue has been greater than or equal to m for t (300 ≤ t ≤ 3,600) seconds continuously
Check whether the system load is too high
m=100, t=300
Moderate
Yes
Yes
Kerberos
The Kerberos response time exceeds the threshold
The Kerberos response time has been greater than or equal to m (ms) for t (300 ≤ t ≤ 604,800) seconds continuously
Manually troubleshoot the issue
m=100, t=1,800
Severe
Yes
Yes
Cluster
The auto scaling policy has failed
1. The scale-out rule failed due to insufficient subnet EIPs associated with the cluster.
2. The scale-out rule failed due to insufficient expansion resource inventory of the preset specifications.
3. The scale-out rule failed due to insufficient account balance.
4. An internal error occurred.
1. Switch to another subnet in the same VPC.
2. Switch to specifications of resources that are sufficient or submit a ticket to contact developers.
3. Top up the account to ensure that the account balance is sufficient.
The execution of the auto scaling policy has timed out
1. Scaling cannot be performed temporarily as the cluster is in the cooldown period.
2. Scaling is not triggered because the retry period upon expiration is too short.
3. The cluster in the current status cannot be scaled out.
1. Adjust the cooldown period for the scaling rule.
2. Extend the retry period upon expiration.
3. Try again later or submit a ticket to contact developers.
-
Severe
No
Yes
The auto scaling policy is not triggered
1. The scale-out rule cannot be triggered because no expansion resource specification is set.
2. The scale-out rule cannot be triggered because the maximum number of nodes for elastic resources is reached.
3. The scale-in rule cannot be triggered because the minimum number of nodes for elastic resources is reached.
4. The time range for scaling has expired.
5. The scale-in rule cannot be triggered because there are no elastic resources in the cluster.
1. Set at least one elastic resource specification for the rule.
2. Modify the maximum number of nodes to continue scaling out if the upper limit is reached.
3. Modify the minimum number of nodes to continue scaling in if the lower limit is reached.
4. Modify the effective time range of the rule if you want to continue using the rule for auto scaling.
5. Execute the scale-in rule after adding elastic resources.
-
Moderate
Yes
Yes
Auto scaling partially succeeded
1. Only partial resources were supplemented because the resource inventory was less than the required quantity for scale-out.
2. Only partial resources were supplemented because the required quantity for scale-out exceeded the actual quantity of resources delivered.
3. The scale-out rule was partially successful because the maximum number of nodes for elastic resources was reached.
4. The scale-in rule was partially successful because the minimum number of nodes for elastic resources was reached.
5. The resource supplement failed due to insufficient subnet EIPs associated with the cluster.
6. The resource supplement failed due to insufficient expansion resource inventory of the preset specifications.
7. The resource supplement failed due to insufficient account balance.
1. Use the available resources for manual scaling to supplement the resources for auto scaling.
2. Use the available resources for manual scaling to supplement the resources for auto scaling.
3. Modify the maximum number of nodes to continue scaling out if the upper limit is reached.
4. Modify the minimum number of nodes to continue scaling in if the lower limit is reached.
5. Switch to another subnet in the same VPC.
6. Switch to specifications of resources that are sufficient or submit a ticket to contact developers.
7. Top up the account to ensure that the account balance is sufficient.
-
Moderate
Yes
Yes
The node process is unavailable
The node process is unavailable
Manually troubleshoot the issue
-
Moderate
No
Yes
The process is killed by OOMKiller
The process OOM is killed by OOMKiller
Adjust the process heap memory size
-
Severe
No
Yes
A JVM or OLD exception occurred
A JVM or OLD exception occurred
Manually troubleshoot the issue
1. The OLD utilization reaches 80% for 5 consecutive minutes
Or
2. The JVM memory utilization reaches 90%
Severe
Yes
Yes
Timeout of service role health status occurred
The service role health status has timed out for t seconds (180 ≤ t ≤ 604,800)
The service role health status has timed out for minutes. To resolve this issue, check the logs of the corresponding service role and perform necessary actions accordingly.
t=300
Moderate
Yes
No
A service role health status exception occurred
The service role health status has been abnormal for t seconds (180 ≤ t ≤ 604,800)
The service role health status has been unavailable for minutes. To resolve this issue, check the logs of the corresponding service role and perform necessary actions accordingly.
t=300
Severe
Yes
Yes
Auto scaling failed
This alert indicates that the auto scaling process has failed (either completely or partially)

 Yes
Yes
 No
No
Was this page helpful?