性能相关问题
Download
聚焦模式
字号
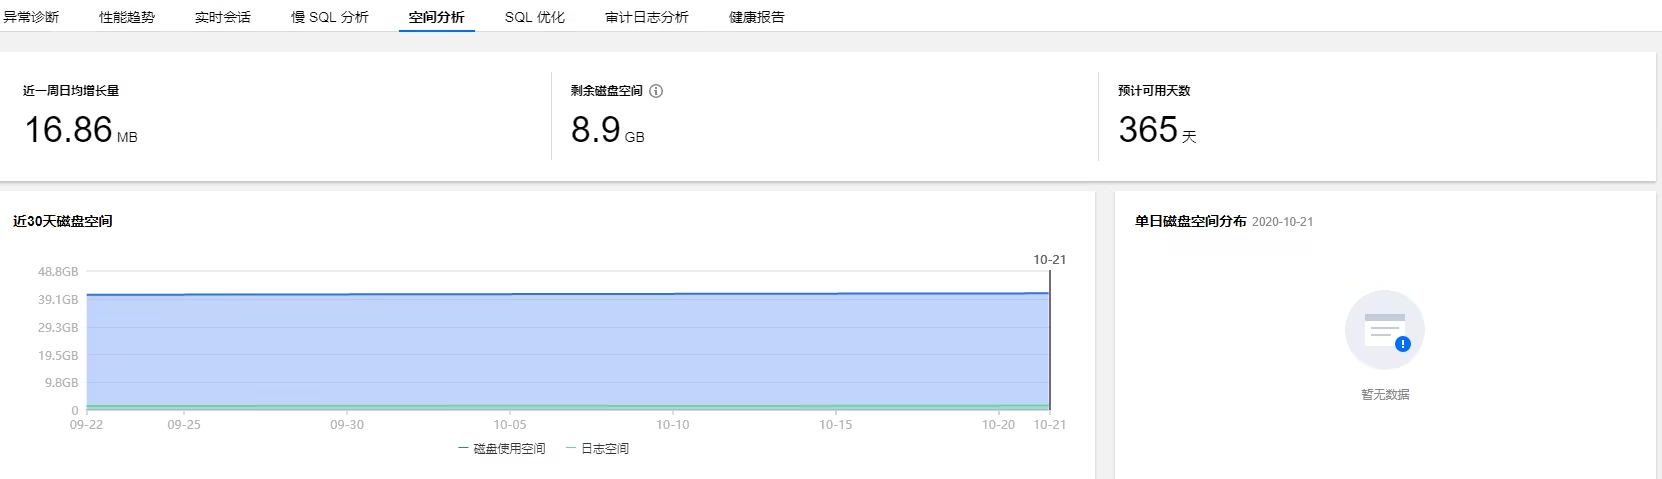
如何查看 MySQL 实例存储空间使用情况?
在空间分析页可查看近一周的日均增长量对比、剩余磁盘空间、预计可用天数,以及近一周的磁盘空间趋势表。 同时也可以查看实例中数据库下各表的占用空间详情和碎片情况。
如何分析 MySQL 全量 SQL 执行轨迹?
1. 单击创建分析任务,选择时间段,单击确定。
2. 在任务列表单击查看 SQL 分析,进入 SQL 分析页。
3. 在 SQL 分析页,可选择 SQL Type、Host、User 或 SQL Code 维度的视图,并可选择时间段拉伸视图来查看具体时间点的数据。
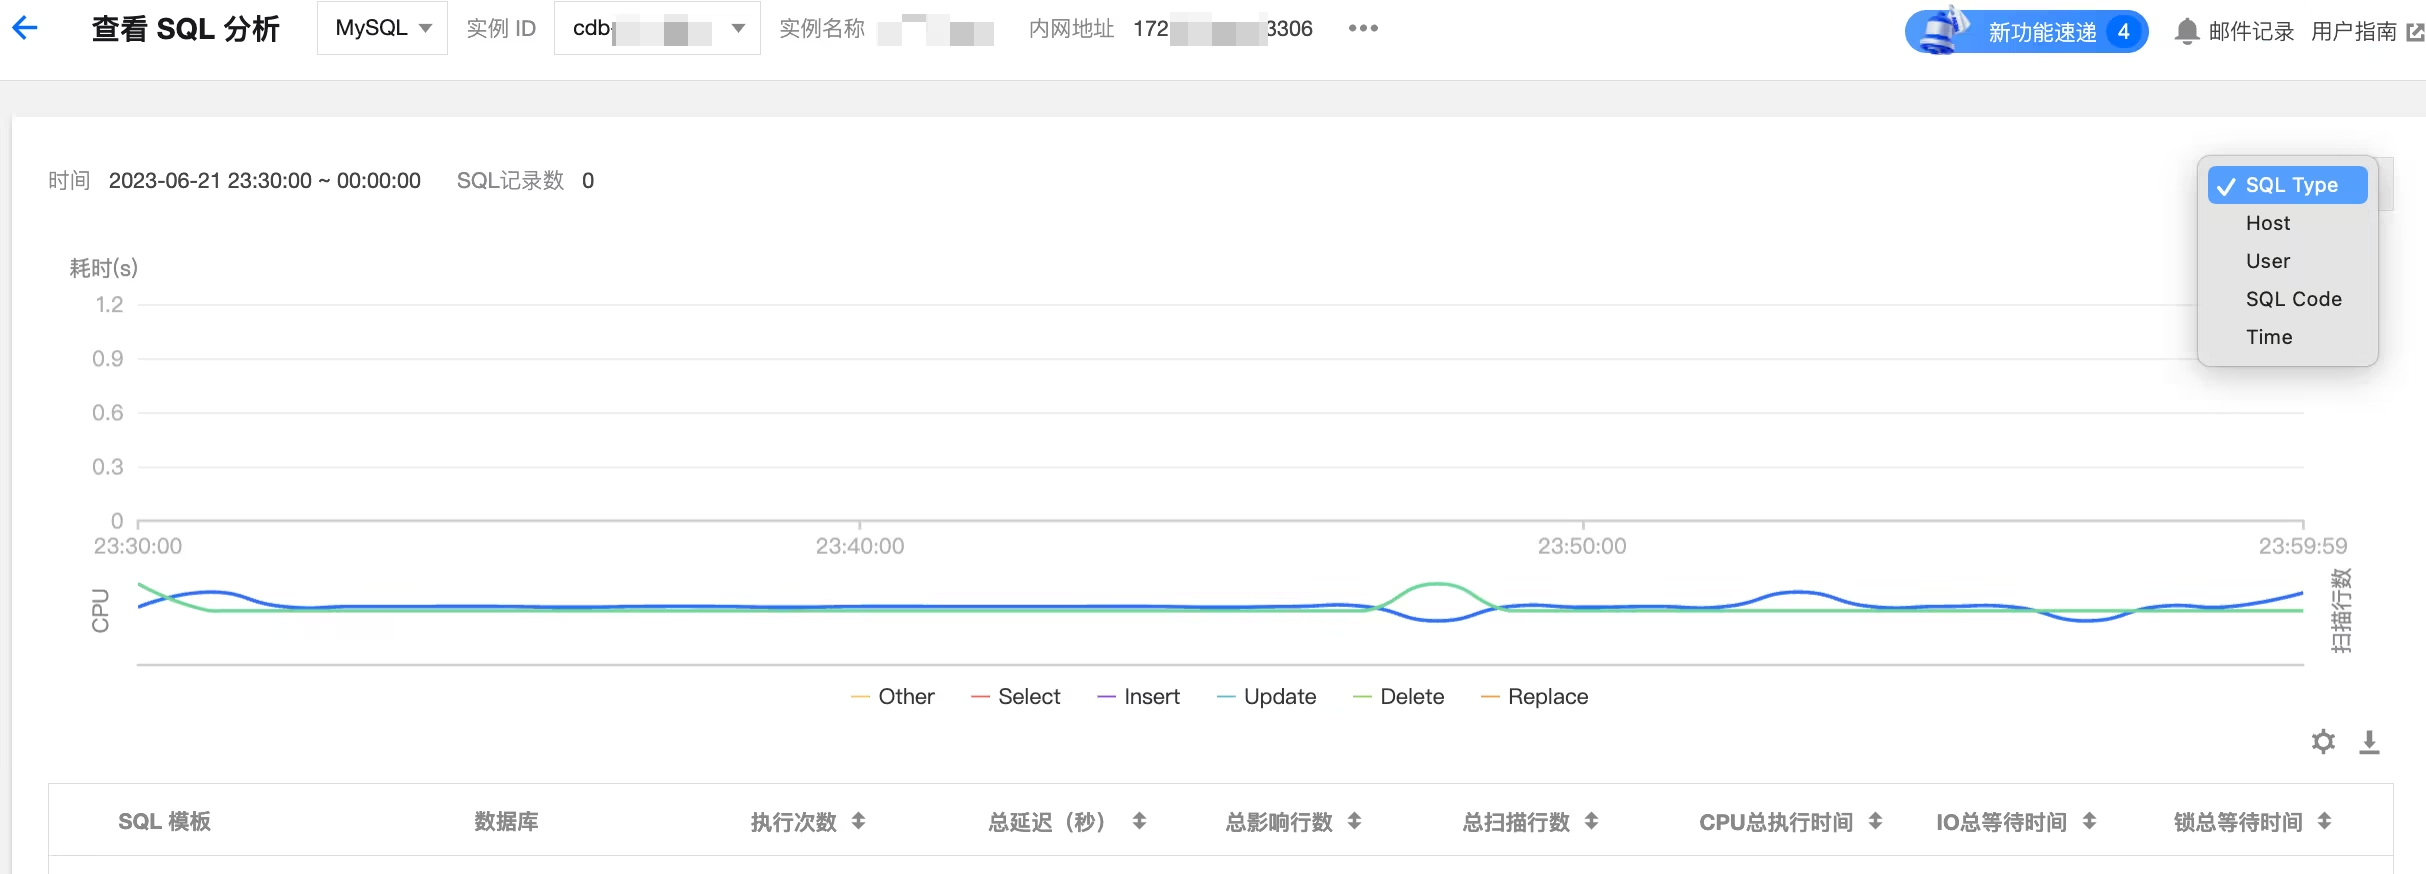
4. 单击某行 SQL 模板,在右侧会弹出 SQL 语句的详情。
在分析页,可查看和复制具体 SQL 语句,根据给出的优化建议或说明来优化 SQL 语句。
在统计页,可查看该类 SQL 在 Host、User、SQL Code 维度的统计分析和执行时间轨迹。
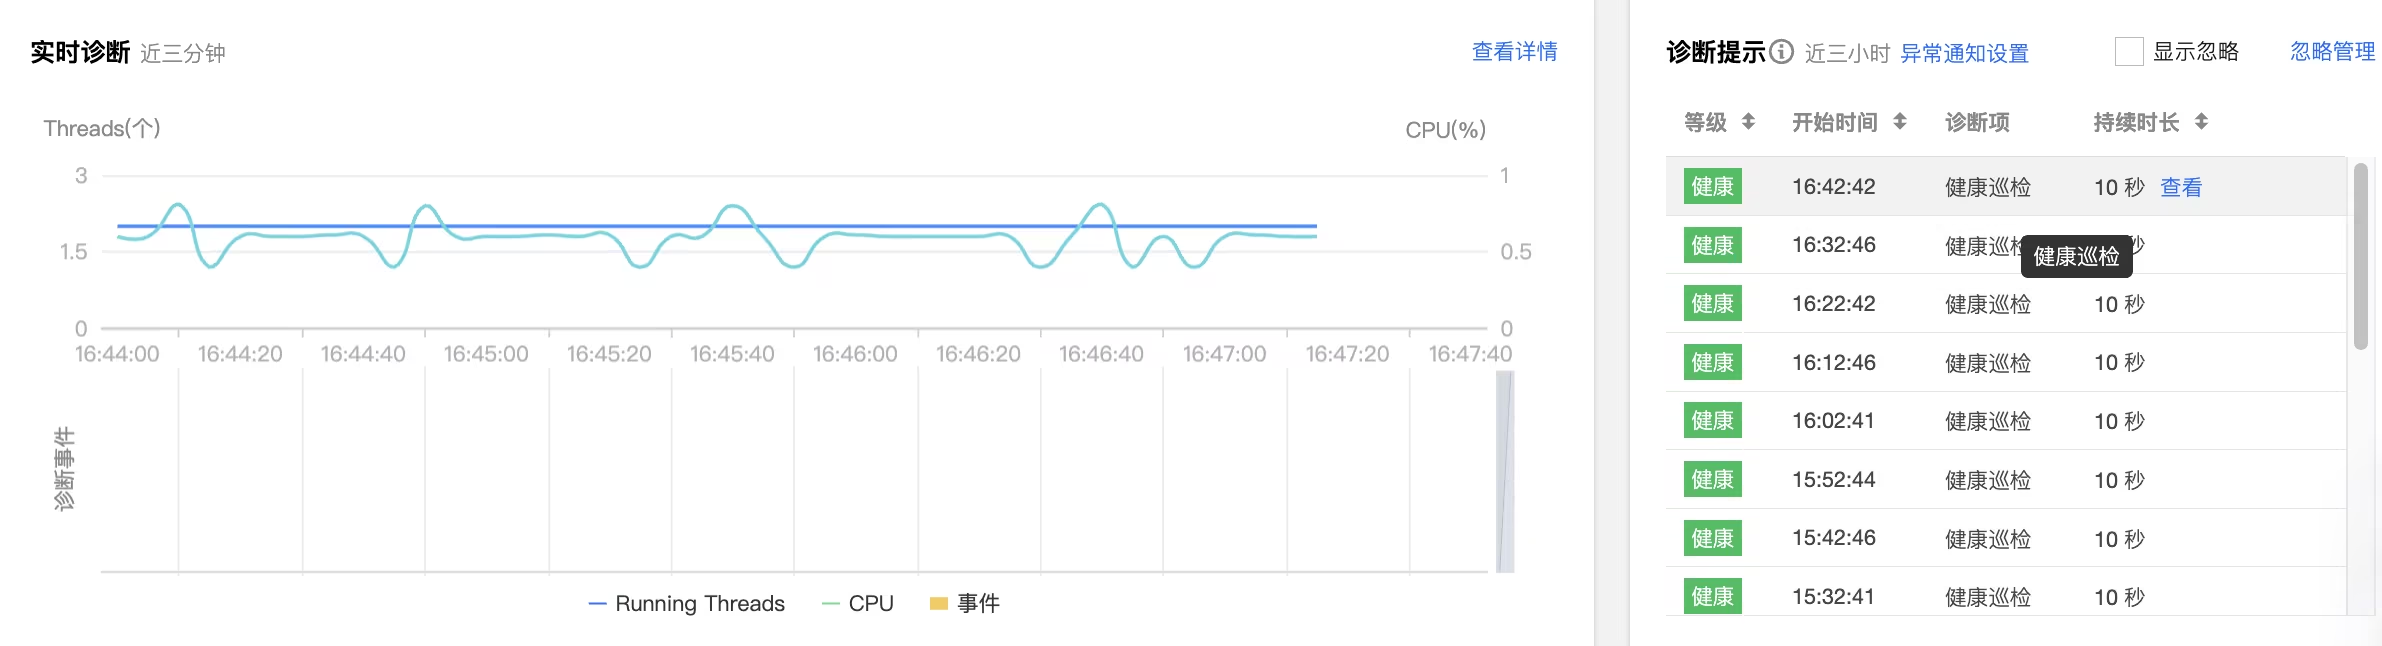
MySQL 实例故障或异常时,如何自助诊断优化?
1. 登录 DBbrain 控制台,在左侧导航选择诊断优化,在上方选择对应数据库,然后选择异常诊断页。
2. “诊断提示”栏展示诊断事件历史记录的概要信息,包括等级、开始时间、诊断项、持续时长。DBbrain 会定期对实例进行健康巡检。
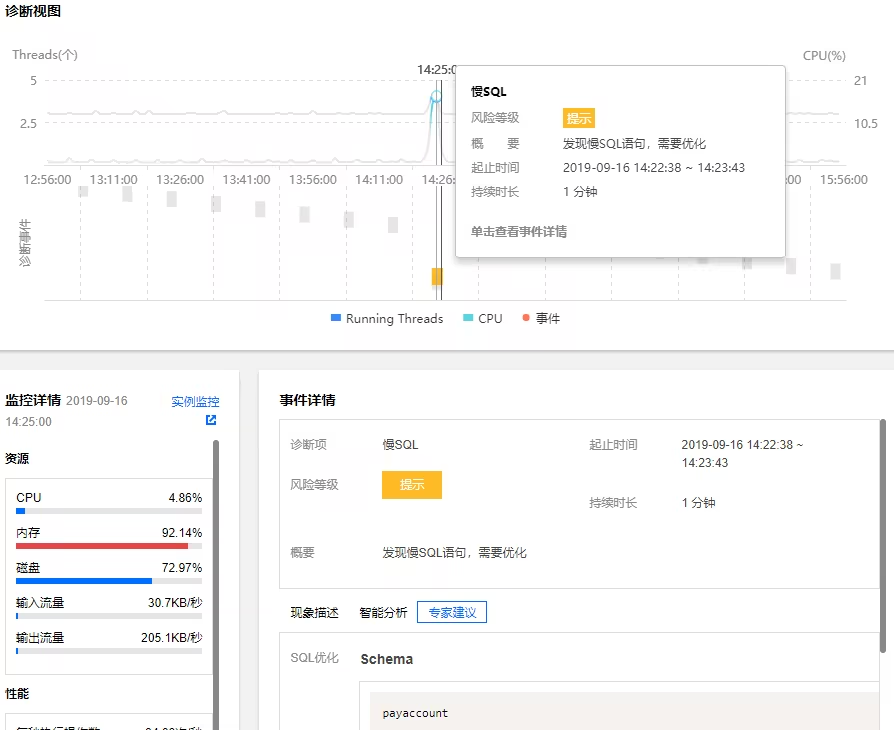
3. 单击查看详情或“诊断提示”栏的诊断项可进入诊断详情页,在视图单击诊断事件,在下方会显示该事件的详情,包括事件概要、现象描述、智能分析以及专家建议,根据专家建议进行优化,即可解决数据库异常,提升实例性能。
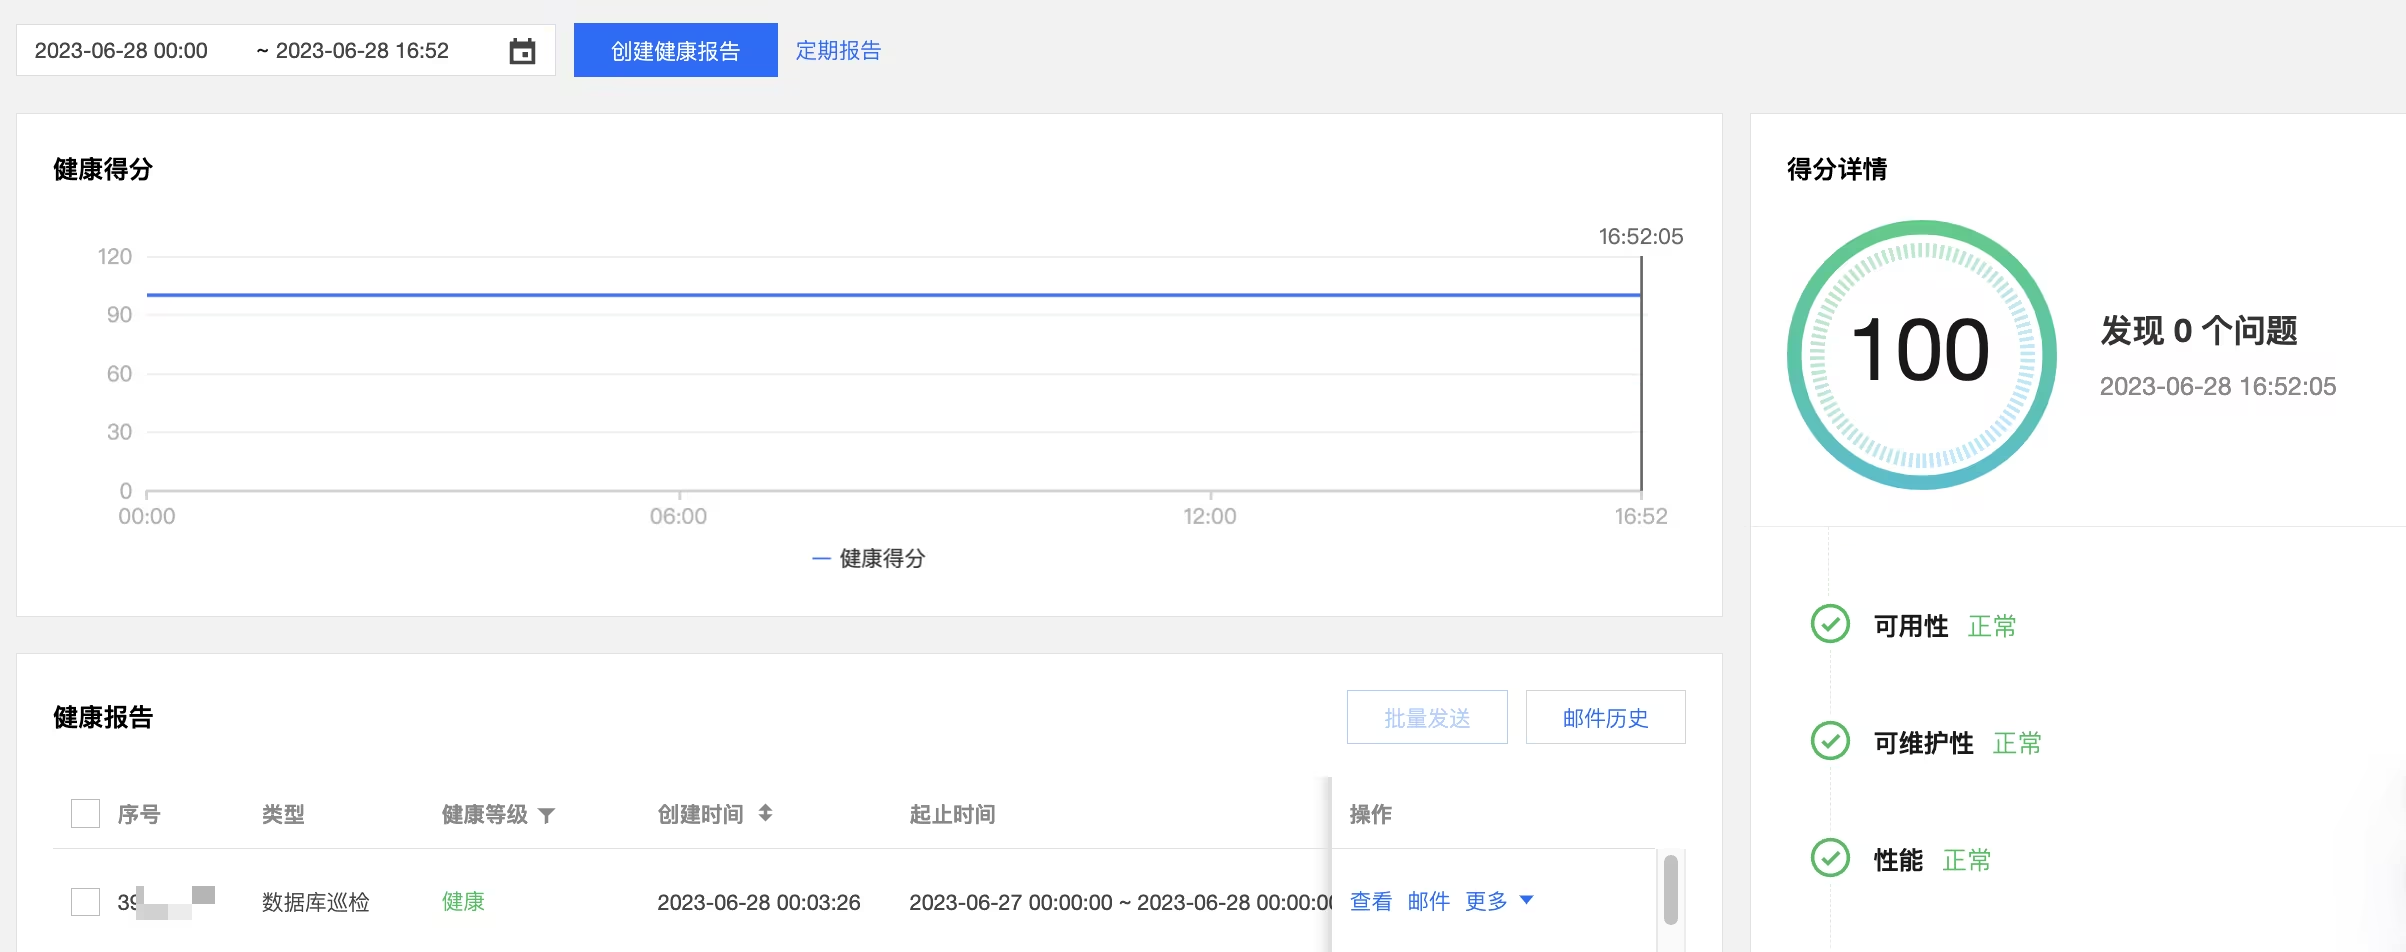
如何定期获取 MySQL 健康报告?
设置报告时间范围,然后单击创建健康报告,任务完成后可以查看或下载该时段的健康报告。
单击定期生成设置,可配置自动生成健康报告的时间周期。
如何查看和优化 MySQL 慢日志?
1. 登录 DBbrain 控制台,在左侧导航选择诊断优化,在上方选择对应数据库,然后选择慢 SQL 分析页,“SQL 统计”栏展示实例的慢查询数和 CPU 使用率。
2. 单击或拉选 SQL 统计图表的慢查询,下方会显示聚合 SQL 模板以及执行信息,各列数据均支持正序或逆序排序。右侧的耗时分布中会展示所选时间段内的 SQL 总体耗时分布情况。
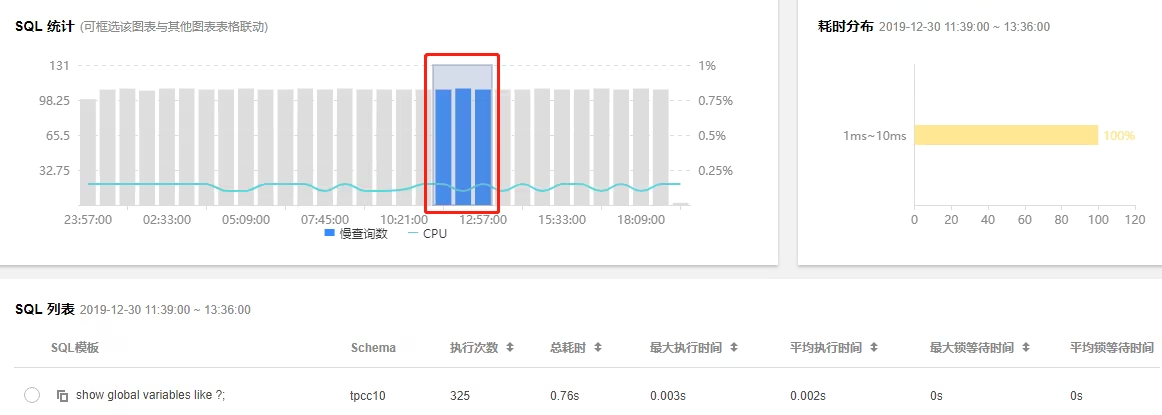
3. 单击某条聚合的 SQL 模板行,右侧边会弹出 SQL 的优化建议和统计信息,可根据优化建议改写 SQL 或者增加适当索引,即可提升 SQL 执行效率,提高数据库性能。
云数据库 MySQL 执行任务时,为什么会卡死?
是并发操作导致的锁等待,属于正常现象。
为什么查看云数据库 MySQL 中的中文数据时出现乱码?
您将数据存储到云数据库中时,请登录 MySQL 控制台 进入实例详情页查看该实例的默认字符集。在编写程序时,将
character_set_client、character_set_results、character_set_connection 设置为和云数据库实例相同的字符集。否则,如果存储的数据中有中文,会出现中文数据乱码现象。
例如:云数据库实例的默认字符集为 utf8,在编写程序连接数据库时,需要先执行以下语句,再将中文数据存储到云数据库。SET NAMES 'utf8';
云数据库 MySQL 连接数占用满了的常见原因和解决方法?
sleep 线程数很多,建议在控制台调低 wait_timeout 和 interactive_timeout 参数值。
慢查询堆积,long_query_time 参数值默认10s,建议调成1s - 2s,观察慢查询日志。
sleep 线程数很少,也没有慢查询堆积,建议在控制台调大 max_connections 参数值。
云数据库 MySQL CPU 占比过高的常见原因和解决方法?
慢查询堆积,请查看实例监控上的慢查询和全表扫描,结合慢查询日志(控制台可下载)进行分析优化,若监控上没有慢查询只有全表扫描,建议在控制台将 long_query_time 调小至1s - 2s,使用一段时间后再分析慢查询。
没有慢查询堆积,请查看实例监控上的内存占用,若超出实例规格很多,并且磁盘读写量明显增大,表明内存遇到瓶颈,建议升级内存。
用户平时需要关注实例的哪些监控指标?
如何统计多个实例的容量使用信息?
您可登录 DBbrain 控制台,在实例概览查看账号下实例的汇总信息。
或使用 getmonitordata 接口来查看多个实例的容量使用信息。
文档反馈