작업 로그
Download
포커스 모드
폰트 크기
작업 시나리오
지정 시간을 초과한 SQL 명령 쿼리를 '슬로우 쿼리'라고 하며, 그와 상응하는 명령을 '슬로우 쿼리 명령'이라고 합니다. 그리고 Database Administrator(DBA)가 슬로우 쿼리 명령에 대해 분석하고 슬로우 쿼리가 발생한 원인을 찾는 과정을 '슬로우 쿼리 분석'이라고 합니다.
솔의 작업 로그 페이지에서 인스턴스의 슬로우 로그 상세, 오류 로그 상세, 롤백 로그, 로그 전송, 확장 이력 및 슬로우 로그 다운로드를 확인할 수 있습니다. 명령줄 인터페이스(CLI) 또는 TencentCloud API를 통해 데이터베이스 로그를 조회하고 다운로드할 수도 있습니다. 자세한 내용은 슬로우 쿼리 로그 조회 및 바이너리 로그 조회를 참조하십시오.
설명:
TencentDB for MySQL 단일 노드(클라우드 디스크) 인스턴스 및 클라우드 디스크 버전 인스턴스는 슬로우 로그 다운로드, 롤백, 로그 전송 기능을 지원하지 않습니다. 클라우드 디스크 버전 인스턴스는 확장 이력 조회도 지원하지 않습니다.
MySQL 슬로우 쿼리 관련 설명
long_query_time: 슬로우 쿼리 임계값 매개변수로, 정확도가 마이크로초 수준에 달하며 기본 10s로 설정되어 있습니다. SQL 명령 실행 시간이 해당 값을 초과하면 슬로우 로그로 기록됩니다.
long_query_time 매개변수를 조정할 경우 기존 슬로우 로그에는 영향을 주지 않습니다. 예를 들어, 슬로우 로그 임계 값 매개변수가 10s였고, 10s를 초과한 슬로우 로그 기록이 리포트되는 상황에서, 이를 1s로 변경해도 기존에 리포트한 로그는 그대로 표시됩니다.
log_queries_not_using_indexes: 인덱스를 사용하지 않은 쿼리를 기록할지 여부로서, 기본 설정 값은 OFF입니다.
작업 단계
설명:
인스턴스에서 읽기 전용 분석 엔진이 활성화된 경우, 처음으로 데이터를 읽기 전용 분석 엔진에 로드할 때 읽기/쓰기 인스턴스에서 데이터를 가져오기 때문에 슬로우 SQL이 발생할 수 있습니다. "txsqlPlugins_analytics_repl" 계정에서 생성된 슬로우 SQL 정보는 무시해 주세요.
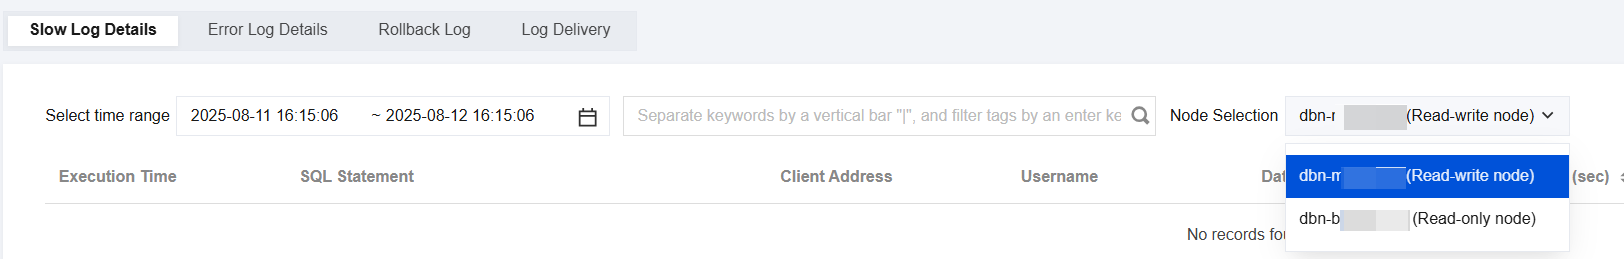
클라우드 디스크 버전 인스턴스의 경우, 작업 로그의 슬로우 로그 상세 및 오류 로그 상세에서 인스턴스 내의 특정 노드를 선택하여 조회할 수 있습니다.
1. MySQL 콘솔 로그인 후, 인스턴스 리스트에서 인스턴스 ID 또는 작업열의 관리를 클릭하여 인스턴스 관리 페이지로 이동합니다.
2. 인스턴스 관리 페이지에서 운영 로그 페이지를 선택하면 인스턴스의 슬로우 로그 상세, 오류 로그 상세, 롤백 로그, 로그 전송, 확장 이력 및 슬로우 로그 다운로드를 확인할 수 있습니다.
기능 항목 | 설명 |
슬로우 로그 상세 | 1개월 내 데이터베이스에서 실행 시간이 1초를 초과하는 SQL 문 기록. |
슬로우 로그 다운로드 | 슬로우 로그 다운로드 제공. |
오류 로그 상세 | 인스턴스의 시작 및 종료 시 상세 정보와 실행 중 발생한 주요 경고 및 오류 기록. |
롤백 로그 | 롤백 작업의 실행 상태 및 진행 상황 기록. |
TencentDB for MySQL 인스턴스의 슬로우 로그 및 오류 로그 데이터를 수집하여 Cloud Log Service(CLS)로 전송하여 분석. | |
확장 이력 | 인스턴스의 CPU 탄력적 확장 이력 기록. |
3. 슬로우 로그 다운로드 페이지에서 작업 열의 다운로드를 클릭하여 슬로우 로그를 다운로드합니다.
4. 팝업 창에서 다운로드 주소를 복사하고 CDB가 속한 VPC의 CVM에 로그인(Linux 시스템)하고, wget 명령어로 내부 네트워크 고속 다운로드를 사용하면 보다 효율적입니다.
설명:
로그 용량이 0KB일 경우, 다운로드할 수 없습니다.
또한 로컬 다운로드를 선택하여 직접 다운로드할 수 있지만, 다소 긴 시간이 소요될 수 있습니다.
wget 명령어 형식: wget -c '로그 파일 다운로드 주소' -O 사용자 정의 파일 이름.log
예시는 다음과 같습니다.
wget -c 'http://szx.dl.cdb.tencentyun.com:303/cfdee?appid=1210&time=1591&sign=aIGM%3D' -O test.log
피드백