Monitoring
Download
Focus Mode
Font Size
To make it easier for you to view and stay up to date with how instances work, TencentDB for MySQL provides a wide variety of performance monitoring metrics and convenient monitoring features (custom view, time comparison, merged monitoring metrics, etc). You can log in to the TencentDB for MySQL console, and view them in Instance Monitoring on the instance management page.
Note:
You can get instance monitoring metrics by calling the GetMonitorData API or using the TencentDB for MySQL monitoring metrics in Tencent Cloud Observability Platform (TCOP).
You can create dashboards for monitoring metrics to analyze monitored data dynamically.
If one instance contains more than 300,000 tables, it can negatively impact database monitoring. Therefore, it is crucial to manage the number of tables effectively and ensure that the total number of tables in each instance stays below this threshold.
Types of Instances for Monitoring
TencentDB for MySQL source, read-only, and disaster recovery instances as well as database proxy nodes can be monitored, and each instance is provided with a separate monitoring view for easy query.
Monitoring Types
Four types of monitoring are available for TencentDB for MySQL: resource monitoring, engine monitoring (general), engine monitoring (extended), and deployment monitoring. You can view the metrics of different monitoring types to gain a quick and accurate understanding of how instances perform and operate.
Note:
TencentDB for MySQL single-node instances of cloud disk edition currently support resource monitoring and engine monitoring (general) but not engine monitoring (extended) and deployment monitoring.
Resource monitoring provides monitoring data of CPU, memory, disk, and network.
Engine monitoring (general) provides monitoring data of the number of connections, locks, hotspot tables, and slow queries, helping you troubleshoot issues and optimize the performance.
Engine monitoring (extended) provides a wider variety of engine-related monitoring metrics so as to assist you in identifying existing or potential database problems as much as possible.
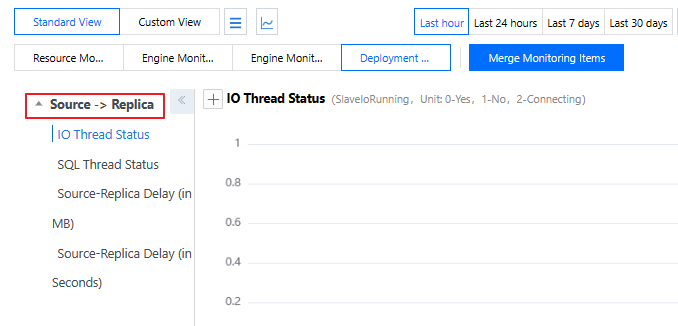
Deployment monitoring provides monitoring metrics with regard to source-replica delay. It divides into source monitoring and replica monitoring:
If the instance is a source instance, the object of instance deployment monitoring is the linkage between the source instance and its hidden replica. Deployment monitoring displays the IO and SQL thread status of the hidden replica. The source-replica delay (in MB or in seconds) refers to the delay between the source instance and its hidden replica.
If the instance is a read-only instance, the object of instance deployment monitoring is the linkage between the source instance and the read-only instance. Deployment monitoring displays the IO and SQL thread status of the read-only instance. The source-replica delay (in MB or in seconds) refers to the delay between the read-only instance and the source instance.
If the instance is a disaster recovery instance:
The monitoring of disaster recovery instance deployment is mainly focused on the linkage between a disaster recovery instance and the primary instance. This monitoring system offers valuable insights into the I/O and SQL thread statuses of the disaster recovery instance, while the primary-replica delay distance and primary-replica delay time reflect the relationship between these two instances.
The monitoring of disaster recovery instance deployment is mainly focused on the linkage between a disaster recovery instance and the hidden secondary server. This monitoring system offers valuable insights into the I/O and SQL thread statuses of the hidden secondary server, while the primary-replica delay distance and primary-replica delay time reflect the relationship between the disaster recovery instance and the hidden secondary server.
Monitoring Granularity
TencentDB for MySQL has adopted an adaptive policy for monitoring granularity since August 11, 2018, which means that you cannot select a monitoring granularity as desired for the time being. The adaptive policy is as follows:
Time Span | Monitoring Granularity | Adaptation Description | Retention Period |
(0h, 4h] | 5 seconds | The time span is below 4 hours, and the monitoring granularity is 5 seconds. | 1 day |
(4h, 2d] | 1 minute | The time span is above 4 hours but below 2 days, and the monitoring granularity is 1 minute. | 15 days |
(2d, 10d] | 5 minutes | The time span is above 2 days but below 10 days, and the monitoring granularity is 5 minutes. | 31 days |
(10d, 30d] | 1 hour | The time span is above 10 days but below 30 days, and the monitoring granularity is 1 hour. | 62 days |
(30d,180d] | 1 day | The time span is above 30 days but within 180 days, the monitoring granularity is adjusted to 1 day. | 180 days |
Note:
Currently, you can view monitoring data of TencentDB for MySQL in the past 180 days.
Monitoring Metrics
Tencent Cloud Observability Platform (TCOP) offers an extensive range of monitoring metrics for TencentDB for MySQL instances, available at the instance level. For details, see the table below.
Besides mastering the running status of an instance through monitoring metrics, TencentDB for MySQL also supports monitoring events and event alarms. By setting event rules, event targets and push users, when an abnormal event is detected, the event alarm will send alarm notifications to users through various optional channels, helping users more comprehensively control the running information of the instance.
For details about event alarms, see EventBridge.
For more supported monitoring events, see List of Events for TencentDB for MySQL.
For the monitoring metrics of the read-only analysis engine, see Monitoring and Alarms.
Note:
When you obtain monitoring data through calling APIs, the monitoring metric names used in the call parameter items should follow the Callable Metric Name column in the table below.
Monitoring Metric Name | Callable Metric Name | Unit | Metric Description |
CPU Utilization | CpuUseRate | % | May exceed 100% because some idle CPU resources can be overused. |
Memory Utilization | MemoryUseRate | % | May exceed 100% because some idle CPU resources can be overused. |
Memory Usage | MemoryUse | MB | May exceed purchase specifications because some idle CPU resources can be overused. |
Disk utilization | VolumeRate | % | Not on the allowlist: Disk utilization = Data usage space/Purchased instance space. Added to the allowlist: Disk utilization = (Data usage space + Log usage space)/Purchased instance space. Note: The disk utilization is calculated by the following formula: Disk utilization = (Data usage space + Log usage space)/Purchased instance space. If you need to display disk utilization, contact after-sales to enable this feature. |
Data File Usage Space | RealCapacity | MB | Size of data files. |
Disk occupied space | Capacity | MB | Size of data files, log files, and temporary files. |
IOPS | Iops | Times/second | Number of I/O operations per second. |
IOPS utilization | IopsUseRate | % | IOPS utilization. |
Private network outbound traffic. | BytesSent | Byte/second | Number of bytes sent per second. |
Private network inbound traffic. | BytesReceived | Byte/second | Number of bytes received per second. |
Queries per second | Qps | Times/second | Number of SQL statements executed per second by the database (including operations such as insertion, selection, update, deletion, and replacement) primarily reflects the actual processing capability of the TencentDB for MySQL instance. |
Transactions per second | Tps | Times/second | Number of transactions processed per second by the database. |
Connection utilization | ConnectionUseRate | % | Current number of established connections/Maximum number of allowed connections. |
Maximum Connections | MaxConnections | Count | The maximum connections. |
Threads Connected | ThreadsConnected | Count | Current number of established connections. |
Number of Slow Queries | SlowQueries | Times | Number of queries that exceed the long_query_time threshold, measured in seconds. |
Number of full-table scans | SelectScan | Times/second | Number of full-table scans per second. |
Number of Queries | SelectCount | Times/second | Number of queries per second. |
Number of Updates | ComUpdate | Times/second | Number of updates per second. |
Number of Deletions | ComDelete | Times/second | Number of deletions per second. |
Number of Insertions | ComInsert | Times/second | Number of insertions per second. |
The number of Replaces | ComReplace | Times/second | Number of replacements per second. |
Total Number of Requests | Queries | Times/second | All executed SQL statements, including set and show. |
Query utilization | QueryRate | % | Queries per second/Recommended queries per second. |
Number of temporary tables | CreatedTmpTables | Second | Number of temporary memory tables. |
Number of table lock waits | TableLocksWaited | Times/second | Number of table lock waits per second. |
Buffer Cache Hit Ratio | InnodbCacheHitRate | % | InnoDB cache hit rate. |
Cache utilization | InnodbCacheUseRate | % | InnoDB cache utilization. |
Number of disk reads | InnodbOsFileReads | Times/second | Number of InnoDB disk reads |
Number of disk writes | InnodbOsFileWrites | Times/second | Number of InnoDB disk writes |
Number of Fsync operations | InnodbOsFsyncs | Times/second | Number of InnoDB Fsync operations. |
Current number of open InnoDB tables | InnodbNumOpenFiles | Count | Current number of open InnoDB tables. |
Buffer Cache Hit Ratio | KeyCacheHitRate | % | MyISAM cache hit rate. |
Cache utilization | KeyCacheUseRate | % | MyISAM cache utilization. |
Number of submissions | ComCommit | Times/second | Number of submissions per second. |
Number of rollbacks | ComRollback | Times/second | Number of rollbacks per second. |
Number of threads created | ThreadsCreated | Times/second | Number of threads created. |
Number of running threads | ThreadsRunning | Count | Number of running threads. |
Number of temporary disk tables | CreatedTmpDiskTables | Times/second | Number of temporary disk tables. |
Number of temporary files | CreatedTmpFiles | Times/second | Number of temporary files. |
Number of requests for next row reads | HandlerReadRndNext | Times/second | Number of requests for next row reads. |
Number of internal rollbacks | HandlerRollback | Times/second | Number of transaction rollbacks per second. |
Number of internal submissions | HandlerCommit | Times/second | Number of internal submissions. |
Number of InnoDB free pages | InnodbBufferPoolPagesFree | Count | Number of InnoDB free pages. |
Total number of InnoDB pages | InnodbBufferPoolPagesTotal | Count | Total number of InnoDB pages. |
InnoDB logical reads | InnodbBufferPoolReadRequests | Times/second | Number of InnoDB buffer pool reads ahead. |
InnoDB physical reads | InnodbBufferPoolReads | Times/second | Number of InnoDB disk page reads. |
Number of InnoDB data reads | InnodbDataRead | Byte/second | Number of bytes read per second by the InnoDB engine. |
Total number of InnoDB data reads | InnodbDataReads | Times/second | Total number of InnoDB data reads. |
Total number of InnoDB data writes | InnodbDataWrites | Times/second | Total number of InnoDB data writes. |
InnoDB data written | InnodbDataWritten | Byte/second | Number of bytes written per second by the InnoDB engine. |
InnoDB rows deleted | InnodbRowsDeleted | Times/second | Number of rows deleted per second by the InnoDB engine. |
InnoDB rows inserted | InnodbRowsInserted | Times/second | Number of rows inserted per second by the InnoDB engine. |
InnoDB rows updated | InnodbRowsUpdated | Times/second | Number of rows updated per second by the InnoDB engine. |
InnoDB rows read | InnodbRowsRead | Times/second | Number of rows read per second by the InnoDB engine. |
Average time to acquire row locks in InnoDB | InnodbRowLockTimeAvg | Millisecond | Average duration of row locks in the InnoDB engine. |
Number of InnoDB row lock waits | InnodbRowLockWaits | Times/second | Number of row lock waits per second in the InnoDB engine. |
Number of unused key cache blocks | KeyBlocksUnused | Count | Number of unused key cache blocks in the MyISAM engine. |
Number of used key cache blocks | KeyBlocksUsed | Count | Number of used key cache blocks in the MyISAM engine. |
Number of key cache block reads | KeyReadRequests | Times/second | Number of key cache block reads per second in the MyISAM engine. |
Number of disk block reads | KeyReads | Times/second | Number of disk block reads per second in the MyISAM engine. |
Number of key cache block writes | KeyWriteRequests | Times/second | Number of key cache block writes per second in the MyISAM engine. |
Number of disk block writes | KeyWrites | Times/second | Number of disk block writes per second in the MyISAM engine. |
Number of tables opened | OpenedTables | Count | Number of tables opened at the instance level. |
Number of table locks released immediately | TableLocksImmediate | Times/second | Number of table locks released immediately. |
Total number of open files | OpenFiles | Count | Total number of open files. |
Log usage | LogCapacity | MB | Log usage space. |
I/O thread status | SlaveIoRunning | Status values: 0 - Yes 1 - No 2 - Connecting | I/O thread status of the primary instance. Note: In the status values, 0 indicates "running," 1 indicates "disconnected," and 2 indicates "connecting." |
SQL thread status | SlaveSqlRunning | Status values: 0 - Yes 1 - No | SQL thread status of the primary instance. Note: In the status values, 0 indicates "running" and 1 indicates "disconnected." |
Primary-Replica delay distance | MasterSlaveSyncDistance | MB | Primary-Replica delay distance. |
Primary-Replica delay time | SecondsBehindMaster | Second | Primary-Replica delay time. |
FAQs
How Do You Configure Monitoring for Primary-Replica Delays?
You can configure monitoring for primary-replica delays as required in the following two scenarios:
Scenario 1: Configure monitoring for primary-replica delays for the primary instance.
1. Log in to the Tencent Cloud Observability Platform console, select Alarm Management in the left sidebar, and choose Alarm Configuration > Create Policy.
2. On the Alarm Policy page, choose CDB > MySQL > SLAVE under Policy Type.
Note:
To configure monitoring for primary-replica delays for the primary instance, select secondary server monitoring as the policy type to monitor the delay information from the secondary server to the primary server.
3. Under Configure Alarm Rules, set the trigger conditions for monitoring the primary-replica delay distance and primary-replica delay time, complete the settings for other configuration items as needed, and click Complete.
4. After the settings are completed, an alarm will be triggered when the primary-replica delay distance and primary-replica delay time meet the trigger conditions.
Scenario 2: Configure monitoring for primary-replica delays for RO and disaster recovery instances.
1. Log in to the Tencent Cloud Observability Platform console, select Alarm Management in the left sidebar, and choose Alarm Configuration > Create Policy.
2. On the Alarm Policy page, choose CDB > MySQL > MASTER for the policy type.
Note:
To configure monitoring for primary-replica delays for an RO instance, select host monitoring as the policy type to monitor the delay information from the RO instance to its primary instance.
When monitoring for primary-secondary replication delays is configured for a disaster recovery instance, selecting Monitoring CVM Instances as the policy type will monitor the delay between the disaster recovery instance and its primary instance. On the other hand, if you select Secondary Server Monitoring, it will track the delay information from the secondary instance back to the disaster recovery instance.
3. Under Configure Alarm Rules, set the trigger conditions for monitoring the primary-replica delay distance and primary-replica delay time, complete the settings for other configuration items as needed, and click Complete.
4. After the settings are completed, an alarm will be triggered when the primary-replica delay distance and primary-replica delay time meet the trigger conditions.
Help and Support
Was this page helpful?
You can also Contact sales or Submit a Ticket for help.
Help us improve! Rate your documentation experience in 5 mins.
Feedback