To monitor the SQL full-link average latency, DB execution average latency, and Proxy internal average latency, the database proxy kernel stable version must be 1.3.22 or later.
Metric Name
Unit
Description
Current Connections
pcs
Current number of node access connections
Requests
counts/sec
Number of requests to access nodes
Read Requests
counts/sec
Number of read operation requests
Write Requests
counts/sec
Number of write operation requests
CPU Utilization
%
CPU usage
Memory Utilization
%
Memory usage status
Memory Usage
MB
Used memory status
SQL Full Link Avg Duration
μs
-
DB Execution Avg Duration
μs
-
Proxy Internal Average Time Consumption
μs
-
Operation Steps
Method 1:
1. Log in to the TencentDB for MySQL console. On the instance list page, select the primary instance for which the database proxy is enabled. Then, click the instance ID or Manage in the Operation column to go to the instance management page.
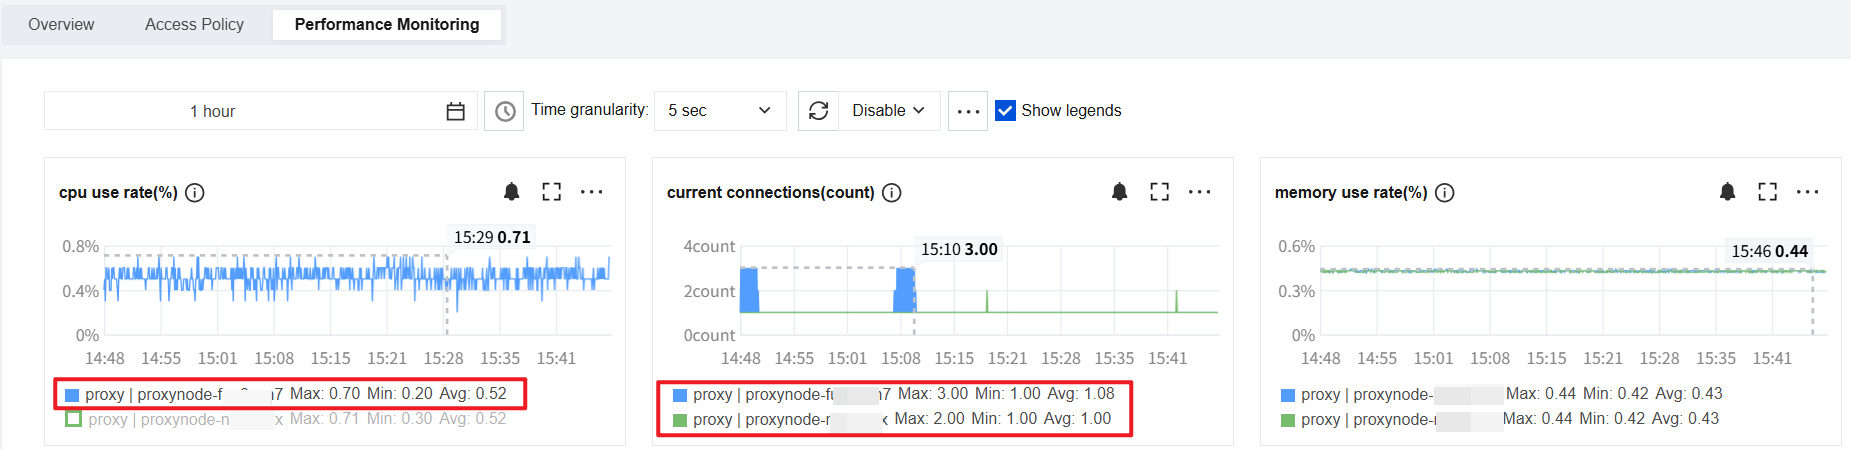
2. On the instance management page, choose Database Proxy > Performance Monitoring. Then, click a node name to switch and view the monitoring data for each proxy node.
Note:
For monitoring data with a granularity of 5 seconds, the system automatically switches to 5-second granularity for monitoring within a 4-hour time span by default.
Method 2:
1. Log in to the TencentDB for MySQL console. On the instance list page, select the primary instance for which the database proxy is enabled. Then, click the instance ID or Manage in the Operation column to go to the instance management page.
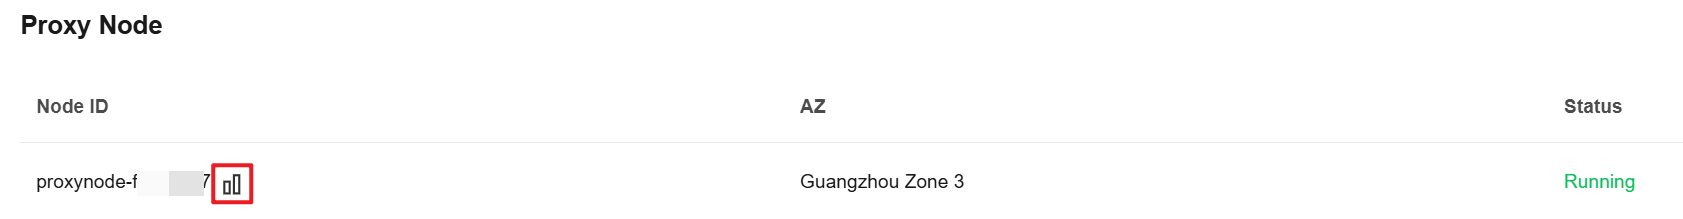
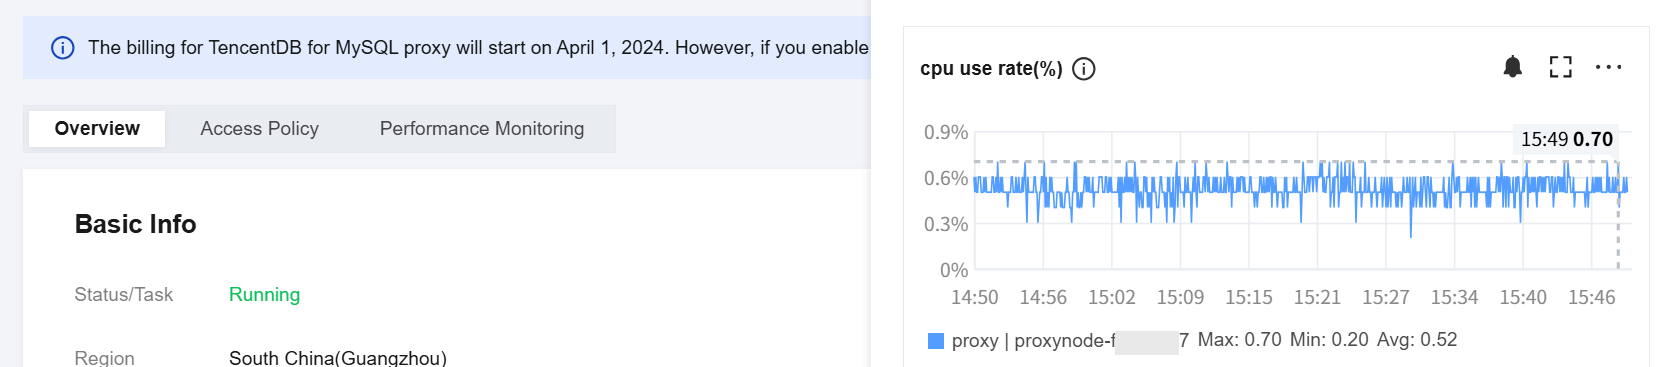
2. On the instance management page, choose Database Proxy > Overview. In the Proxy Node column, click the
icon next to the target node ID to directly access its performance monitoring details.