Overview
Download
Focus Mode
Font Size
In the CSS console, you can manage domain name and streams, configure transcoding, recording, and acceleration, as well as push streams (web) and monitor resources.
Prerequisites
You have activated CSS.
You have logged in to the CSS console.
Overview
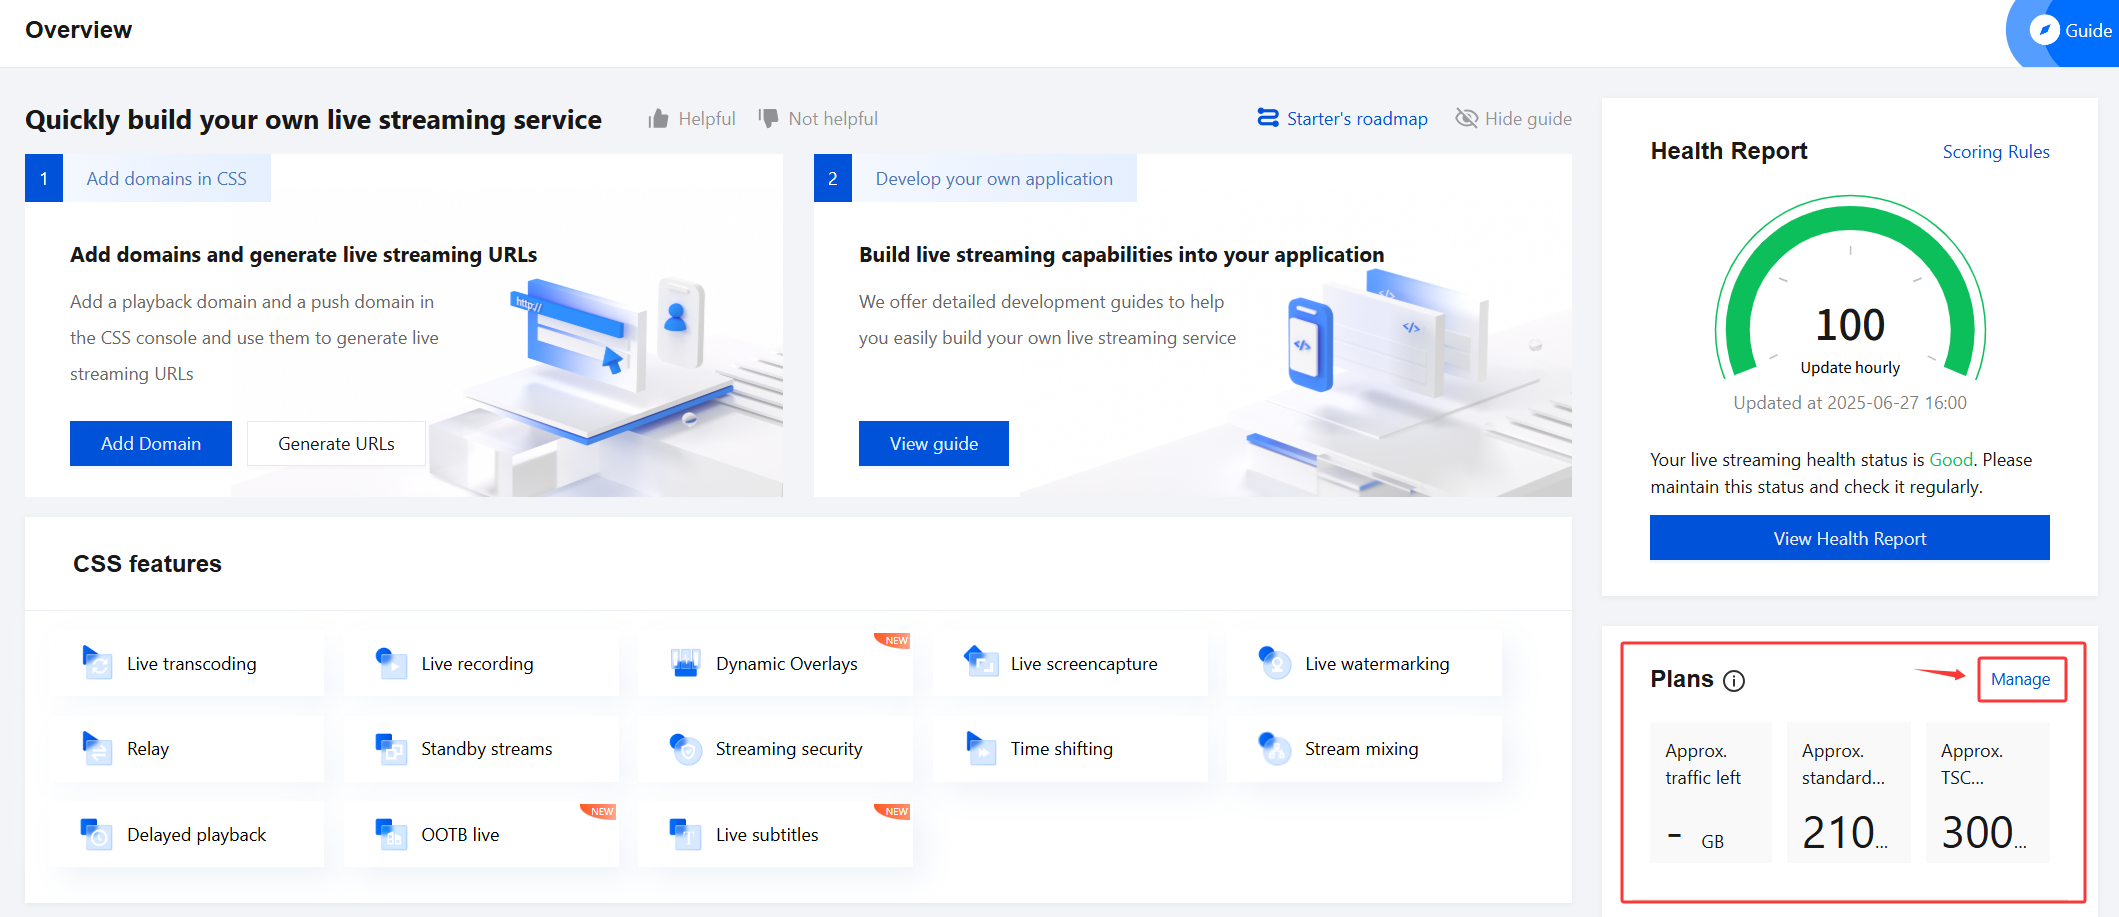
Quickly establish your personalized live streaming service. You may refer to the relevant guidelines, add domains, generate URLs, explore the live streaming development guide, and swiftly navigate to live streaming features.
You can click the "Health Report" card located at the upper-right corner of the Overview page to access the Live Health Report. For more details, please refer to Health Report.
You can view relevant data, including real-time downstream bandwidth, today's downstream traffic, the current number of pushes, concurrent connections, and trends for billed bandwidth, billed traffic, and the number of pushes over the past 30 days. Additionally, you can view Health Report and Plans consumption details. You can switch Billing Mode or change the time granularity as needed. For beginner's guidance, you can click the Guide in the upper right corner to view instructions for getting started with CSS.
Today's Data
This section displays the downstream peak bandwidth, downstream traffic usage, the current number of push channels, and the number of concurrent connections of the day.
Item | Description |
Current Downstream Bandwidth | The peak bandwidth consumed for acceleration by all playback domain names. |
Today's Downstream Traffic | The total traffic consumed for acceleration by all playback domain names on the current day. |
Current Push Channels | The number of current push channels. |
Concurrent Connections | If the playback protocol is RTMP or FLV, Concurrent Connections indicates the number of online viewers. If the playback protocol is HLS, Concurrent Connections cannot be used as an indication of the number of online viewers. |
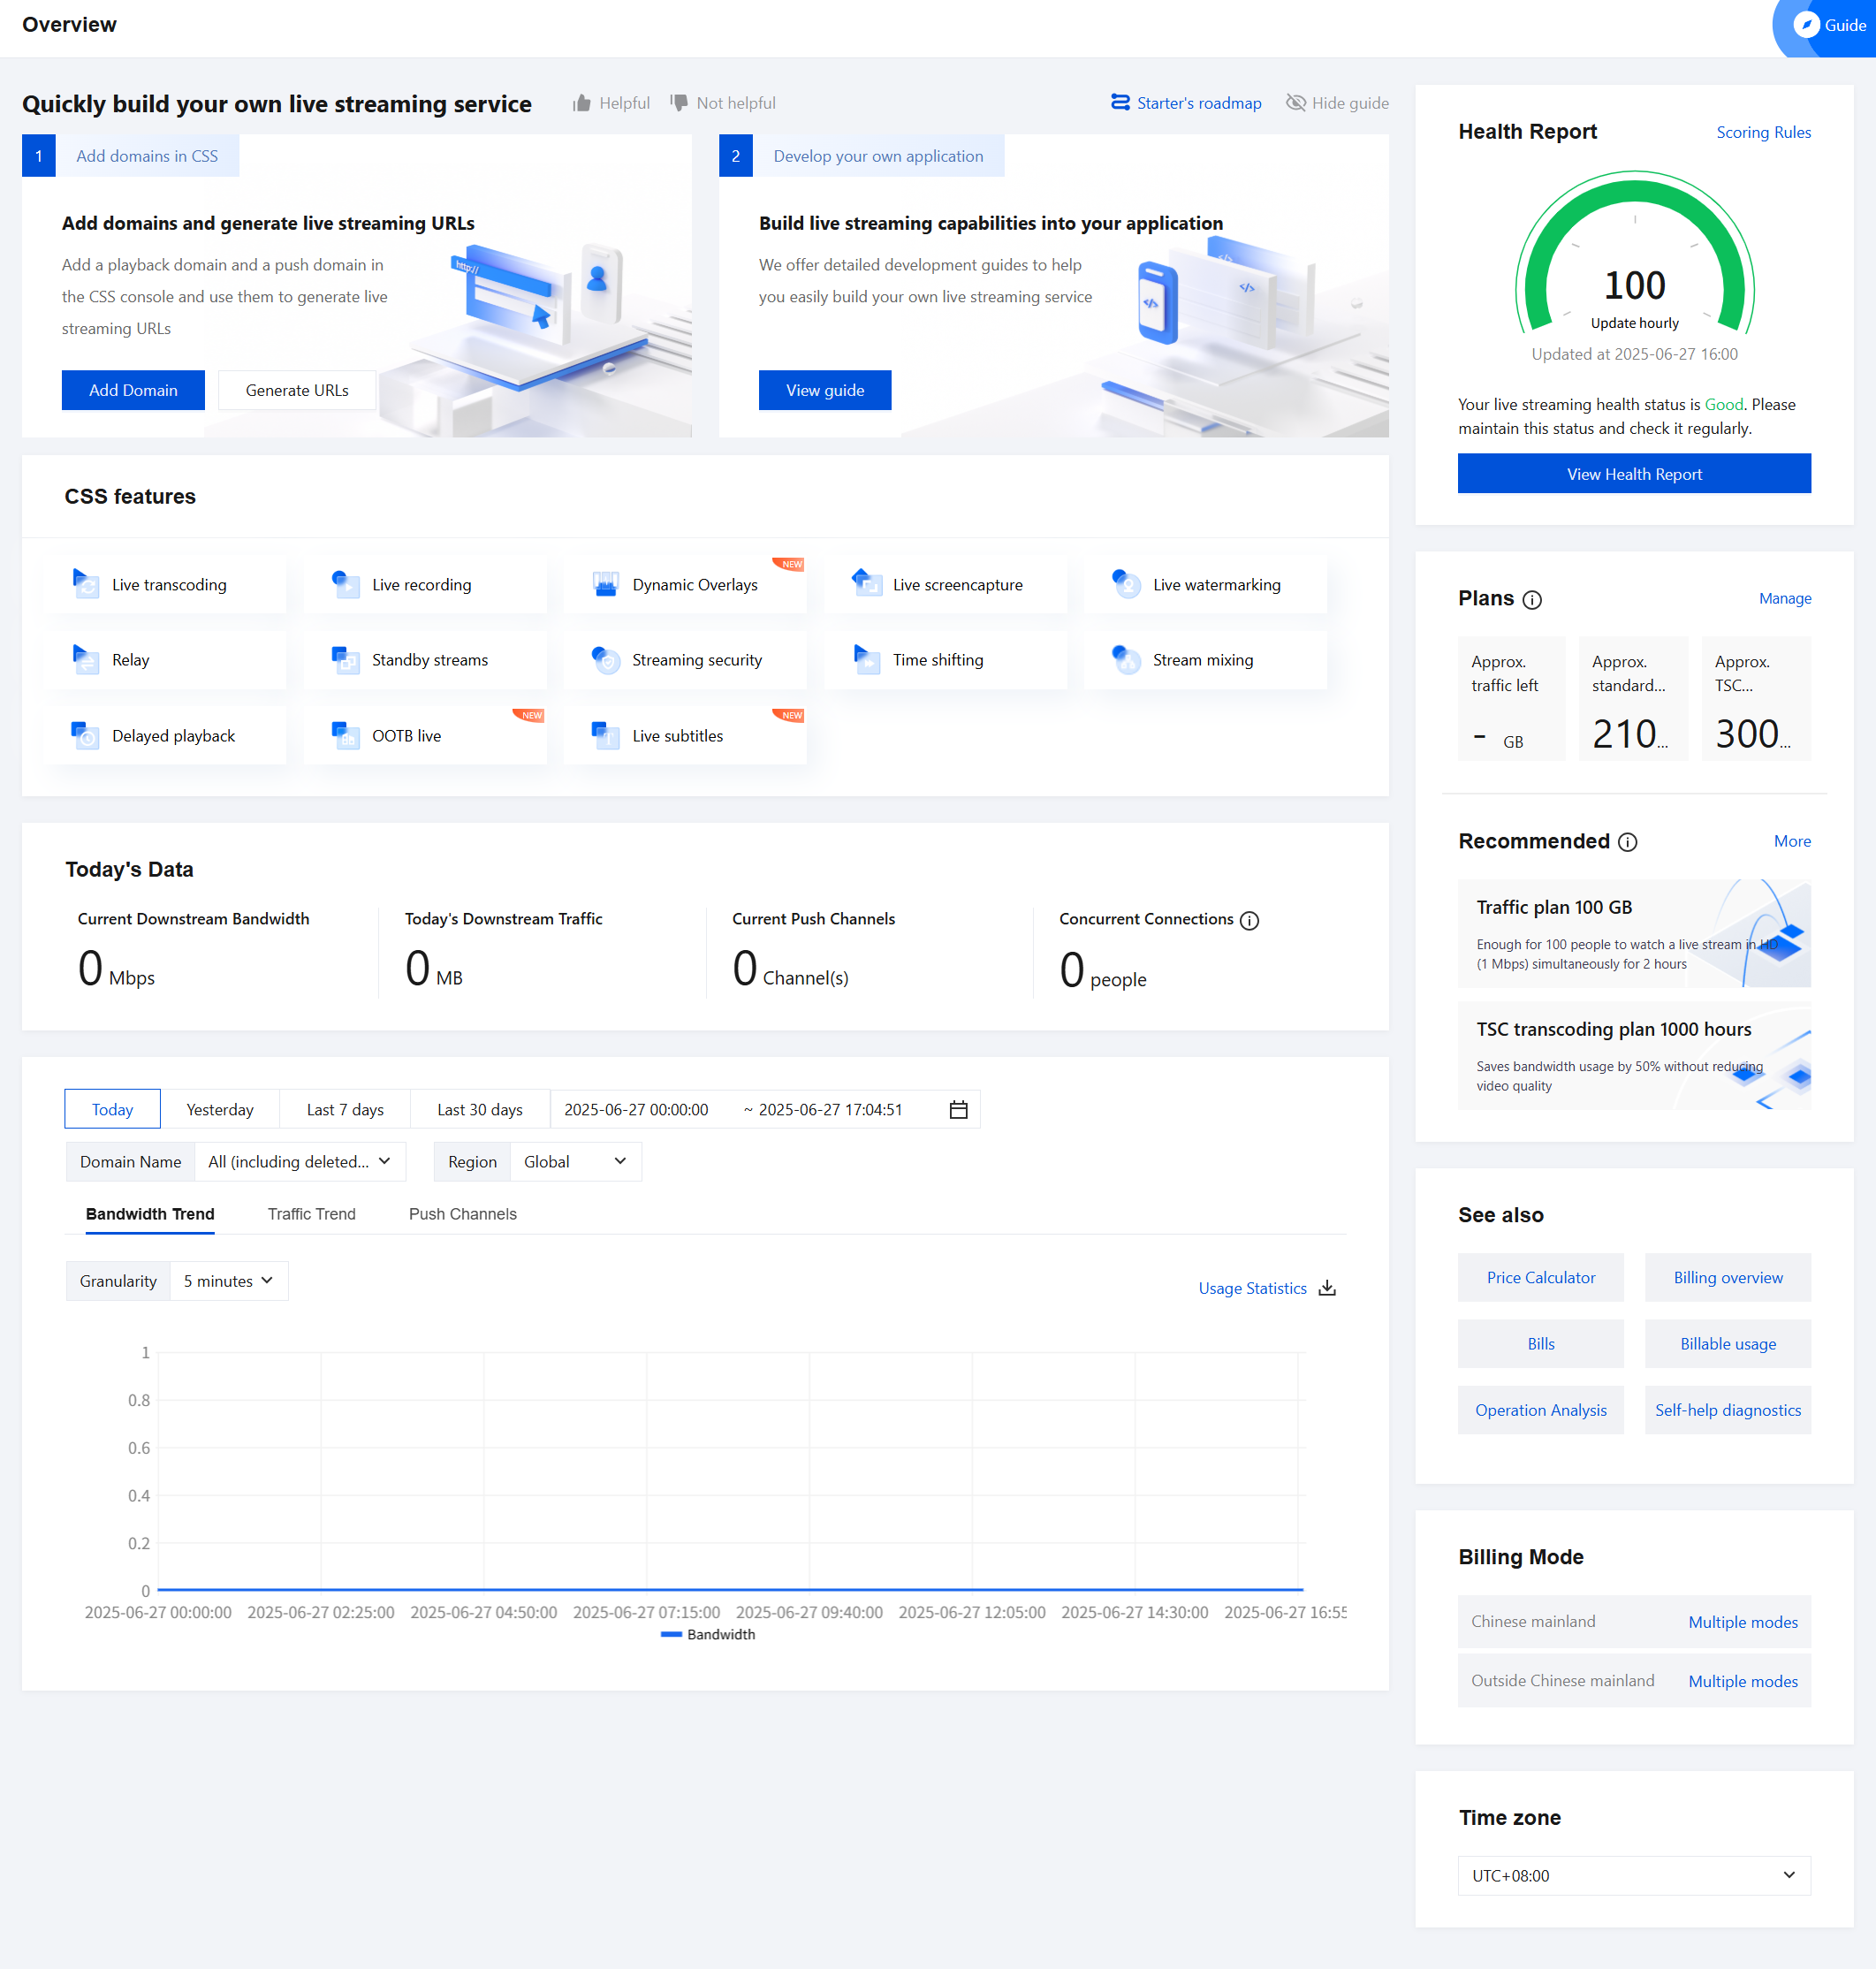
Usage Trends
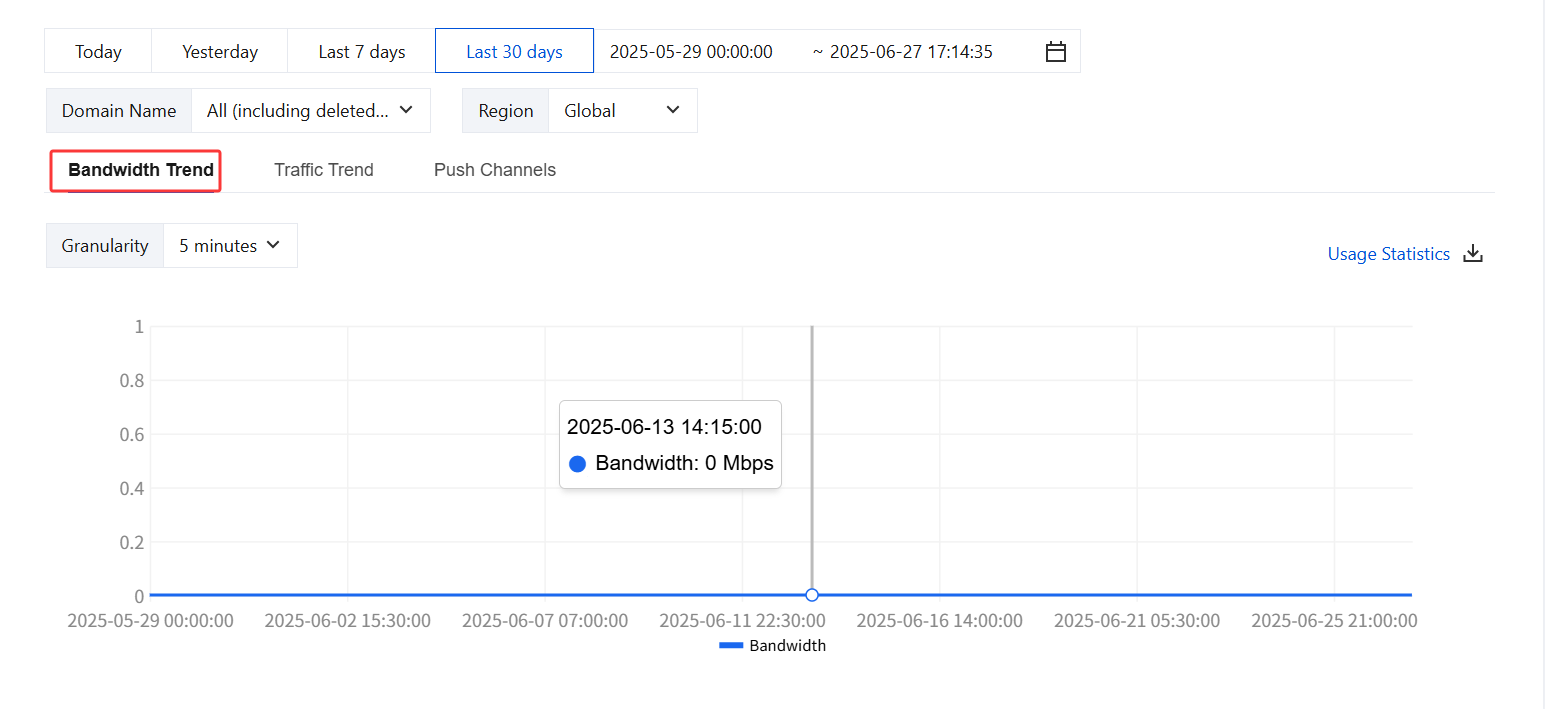
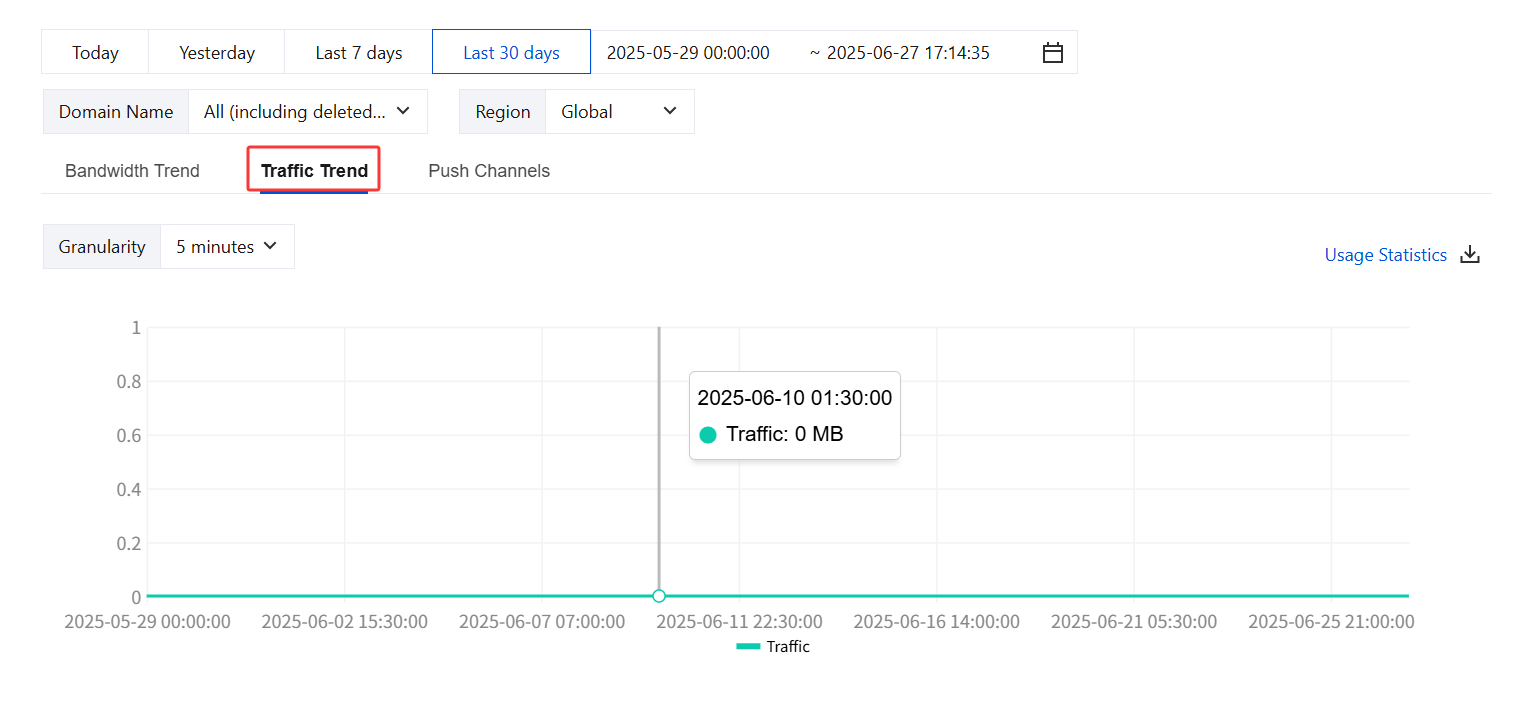
This section displays usage trends ( Bandwidth Trend, Traffic Trend, and Push Channels) for today, yesterday, the last 7 days, and the last 30 days.
Item | Description |
Bandwidth Trend | The sum of the peak bandwidth consumed for acceleration by all playback domain names in the query period. |
Traffic Trend | The total traffic consumed for acceleration by all playback domain names in the query period. |
Push Channels | The number of push channels under the selected domain names in the query period. |
Changing the Granularity
You can click the drop-down list box next to Granularity to change the granularity of the usage trend data.
Resource Package
Note:
The remaining amount of resource packages displayed on the overview page is not real-time data. The update time coincides with the settlement time of the account statement.
Viewing Resource Package Consumption Details
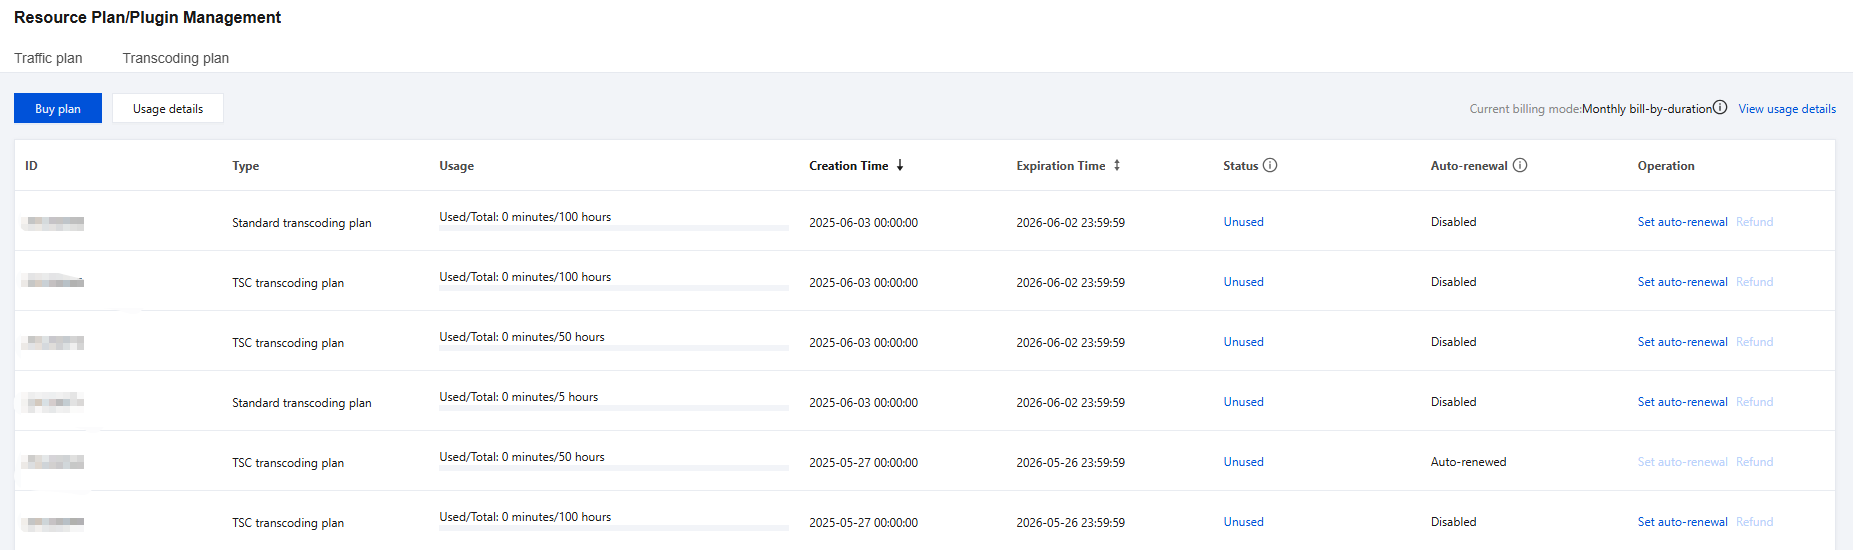
Click Manage on the right to enter the Resource Package/Plugin Management page.
You can view the Usage , Creation Time , Expiration Time , Status , and Auto-renewal of traffic resource packages/transcoding resource packages.
Auto-renewal (renew automatically when it is exhausted or expired) is supported for streaming traffic resource packages and streaming transcoding resource packages (including standard transcoding and top speed codec transcoding). For details, see Renewal documentation.
Purchasing Traffic Resource Package: Click Buy under the traffic package statistics, and you will enter the CSS Traffic Resource Package Purchase Page to purchase related packages.
Note:
Billing
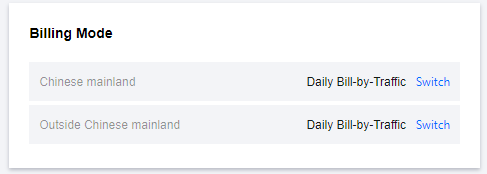
Switching Billing Mode
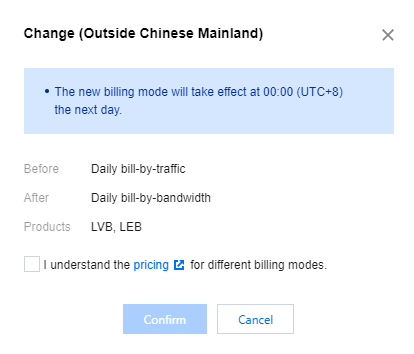
Based on your actual business needs, if your current billing mode is daily bill-by-traffic or daily bill-by-bandwidth, you can click Switch to change the billing mode.
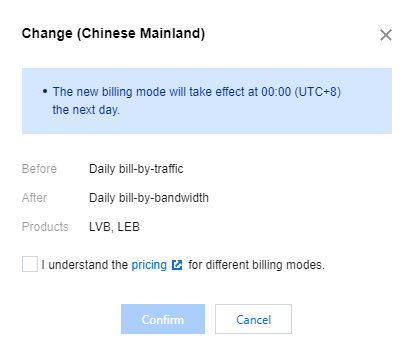
To view billing switch reminders, click Confirm to complete the switch of billing mode. For more detailed information on billing changes, see Changing Billing Modes.
Help and Support
Was this page helpful?
You can also Contact sales or Submit a Ticket for help.
Help us improve! Rate your documentation experience in 5 mins.
Feedback