采集容器日志到 CLS
Download
聚焦模式
字号
操作步骤
创建日志采集规则
1. 登录 容器服务控制台,选择左侧导航栏中的日志管理 > 日志规则。
2. 在日志规则页面上方选择地域和需要配置日志采集规则的集群,单击新建。如下图所示: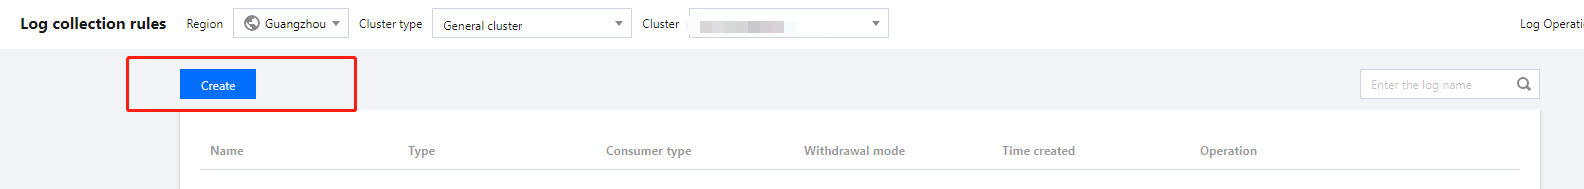
3. 在新建日志采集规则页面中配置日志服务消费端,在消费端 > 类型中选择 CLS。如下图所示: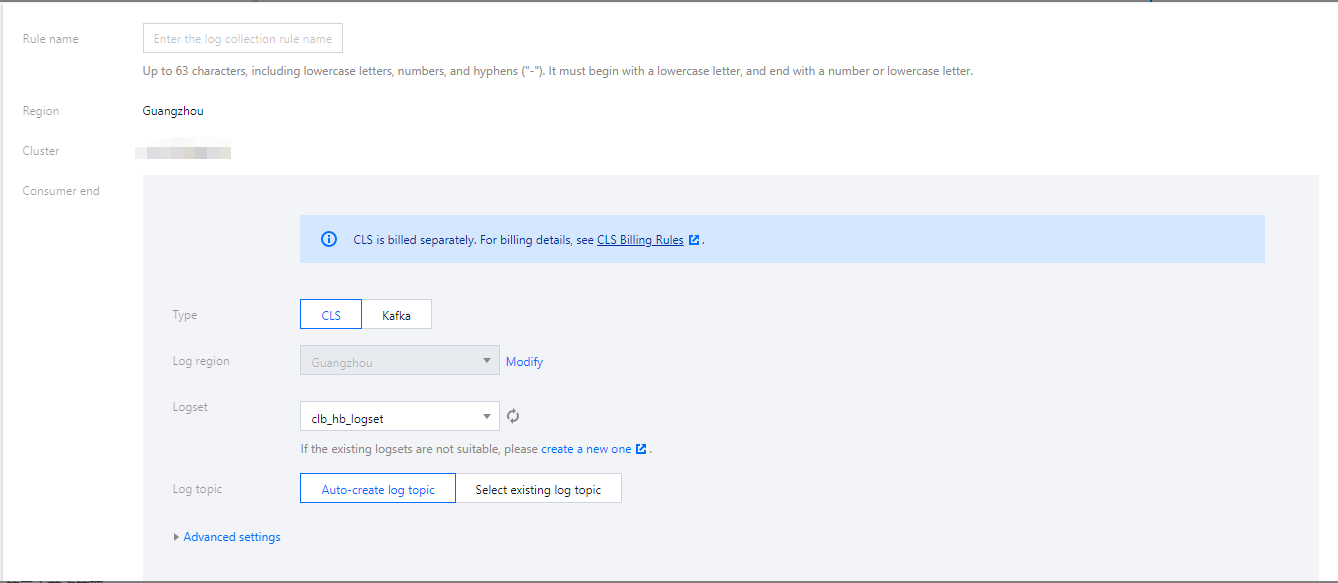
收集规则名称:您可以自定义日志收集规则名称。
日志所在地域:CLS 支持跨地域日志投递,您可通过单击“修改”选择日志投递的目标地域。
日志主题:选择日志集下对应的日志主题,支持“自动创建”和“选择已有”日志主题两种模式。
高级设置:
默认元数据:CLS 默认将元数据
pod_name、namespace、container_name 设为索引用于日志检索。自定义元数据:支持自定义元数据及日志索引。
说明:
CLS 不支持国内和海外地域之间跨地域日志投递;针对 CLS 未开通日志服务的地域仅支持就近投递,如深圳集群采集的容器日志仅支持投递到广州,天津集群采集的容器日志仅支持投递到北京;详情可通过控制台查看。
一个日志主题目前仅支持配置一类日志,即日志、审计、事件不可采用同一个 topic,会产生覆盖情况,请确保所选日志主题没有被其他采集配置占用;若日志集下已存在500个日志主题,则不能新建日志主题。
自定义元数据和基于元数据开启索引创建后不能修改,您可前往 日志服务控制台 修改。
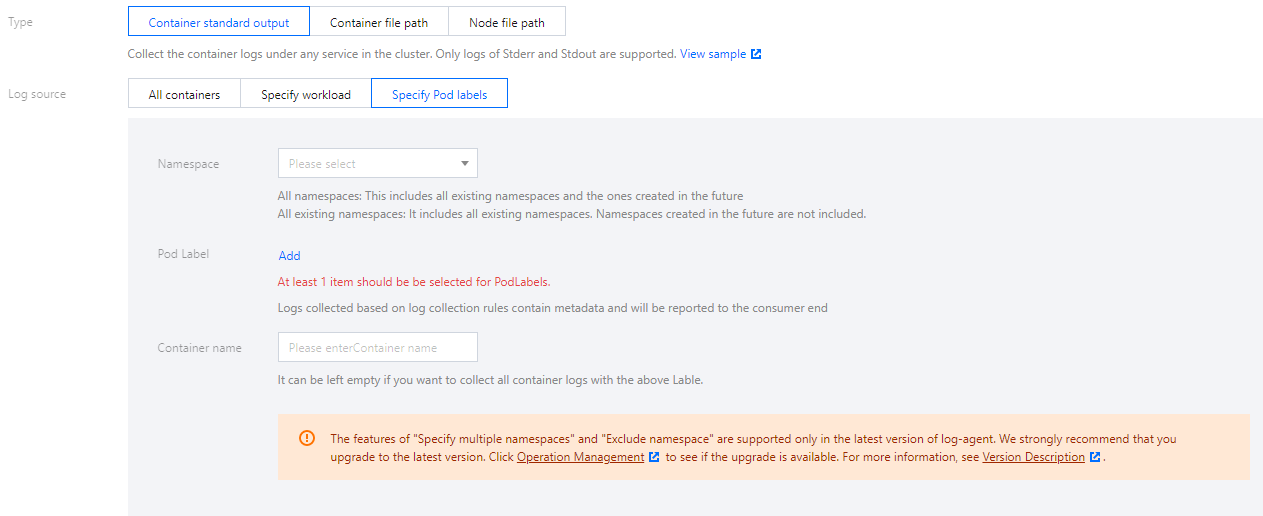
4. 选择采集类型并配置日志源,目前采集类型支持容器标准输出、容器文件路径和节点文件路径。
日志源支持所有容器、指定工作负载、指定 Pod Lables 三种类型。如下图所示: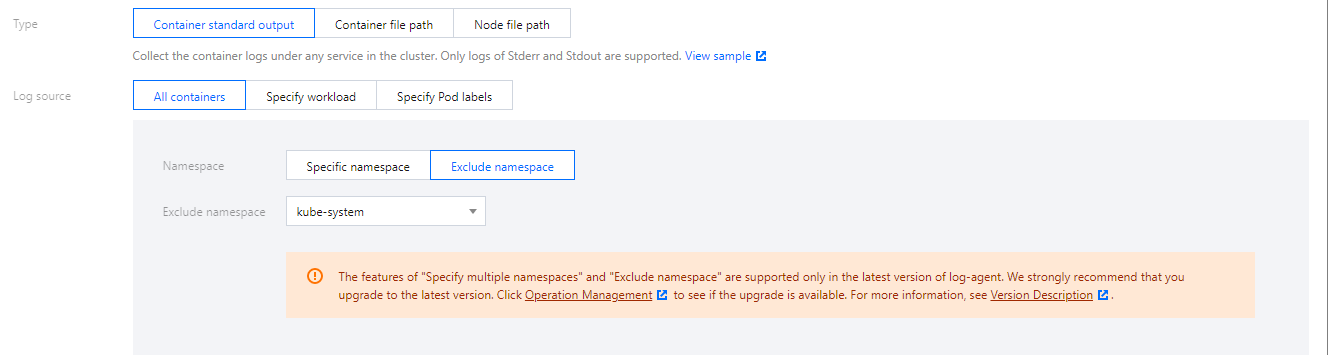
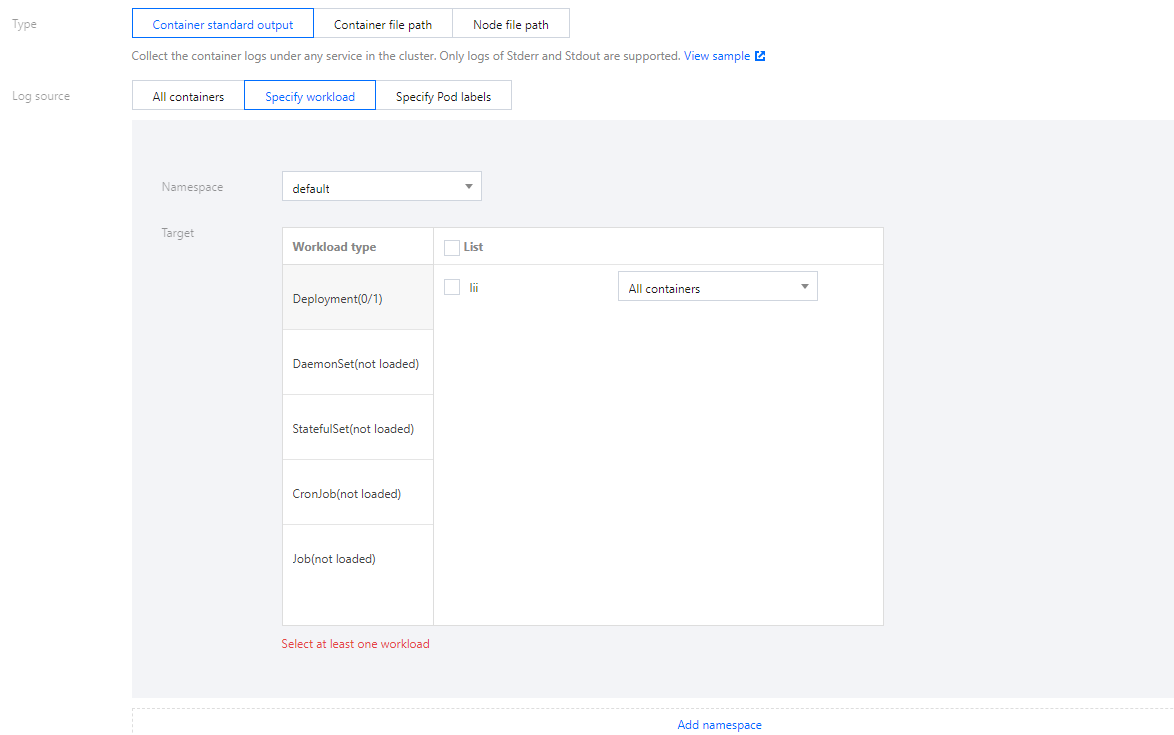
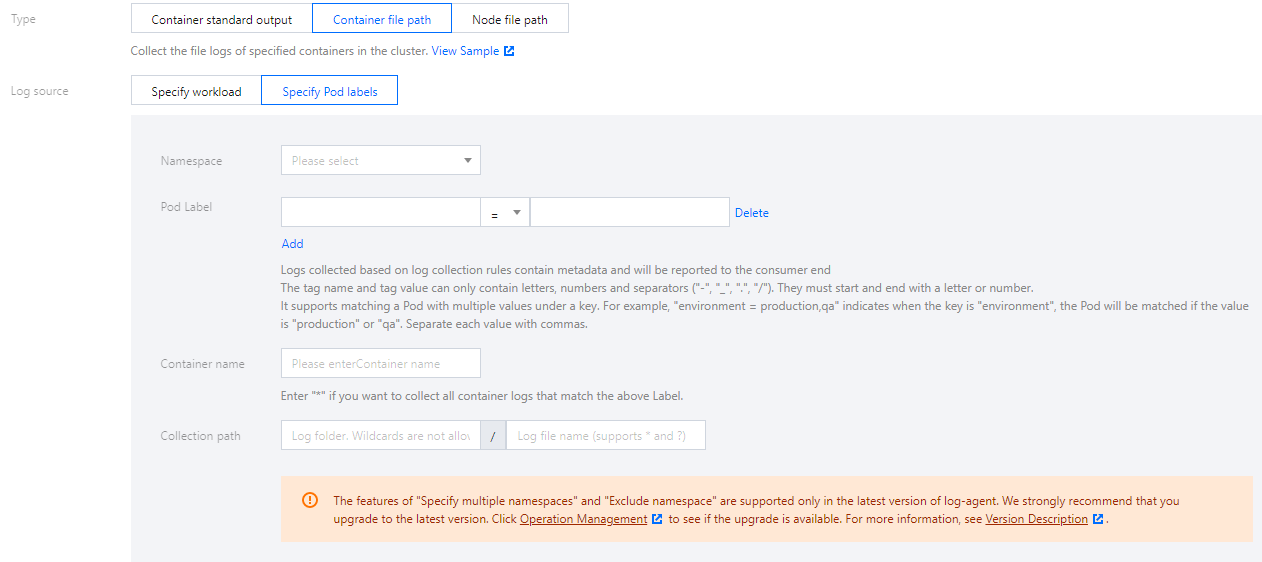
日志源支持指定工作负载、指定Pod Lables 两种类型。
采集文件路径支持文件路径和通配规则,例如当容器文件路径为
/opt/logs/*.log,可以指定采集路径为 /opt/logs,文件名为 *.log。如下图所示: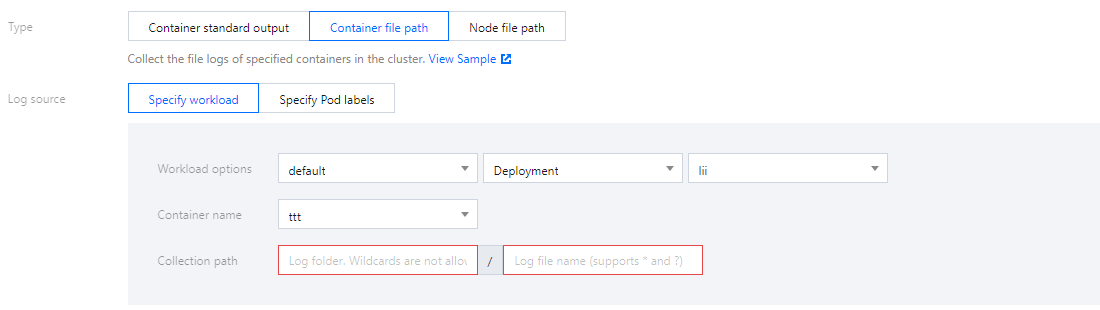
注意
“容器文件路径” 不能为软链接或硬链接,否则会导致软链接的实际路径在采集器的容器内不存在,采集日志失败。
采集路径支持以文件路径和通配规则的方式填写,例如当需要采集所有文件路径形式为
/opt/logs/service1/*.log,/opt/logs/service2/*.log,可以指定采集路径的文件夹为 /opt/logs/service* ,文件名为 *.log。您可根据实际需求自定义添加 Key-Value 形式的 metadata,metadata 将会添加到日志记录中。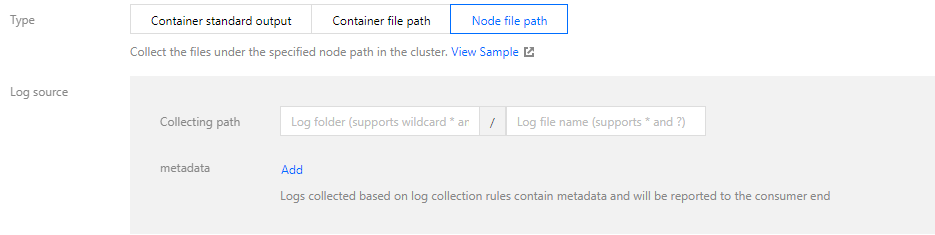
注意:
“节点文件路径” 不能为软链接或硬链接,否则会导致软链接的实际路径在采集器不存在,采集日志失败。
一个节点日志文件只能被一个日志主题采集。
说明
对于“容器的标准输出”及“容器内文件”(不包含“节点文件路径”即 hostPath 挂载),除了原始的日志内容, 还会带上容器或 kubernetes 相关的元数据(例如:产生日志的容器 ID)一起上报到 CLS,方便用户查看日志时追溯来源或根据容器标识、特征(例如:容器名、labels)进行检索。
容器或 kubernetes 相关的元数据请参考下方表格:
字段名 | 含义 |
container_id | 日志所属的容器 ID。 |
container_name | 日志所属的容器名称。 |
image_name | 日志所属容器的镜像名称 IP。 |
namespace | 日志所属 pod 的 namespace。 |
pod_uid | 日志所属 pod 的 UID。 |
pod_name | 日志所属 pod 的名字。 |
pod_lable_{label name} | 日志所属 pod 的 label(例如一个 pod 带有两个 label:app=nginx,env=prod,则在上传的日志会附带两个 metedata:pod_label_app:nginx,pod_label_env:prod)。 |
5. 配置采集策略。您可以选择全量或者增量。
全量:全量采集指从日志文件的开头开始采集。
增量:增量采集指从距离文件末尾1M处开始采集(若日志文件小于1M,等价于全量采集)。
6. 单击下一步,选择日志解析方式。如下图所示: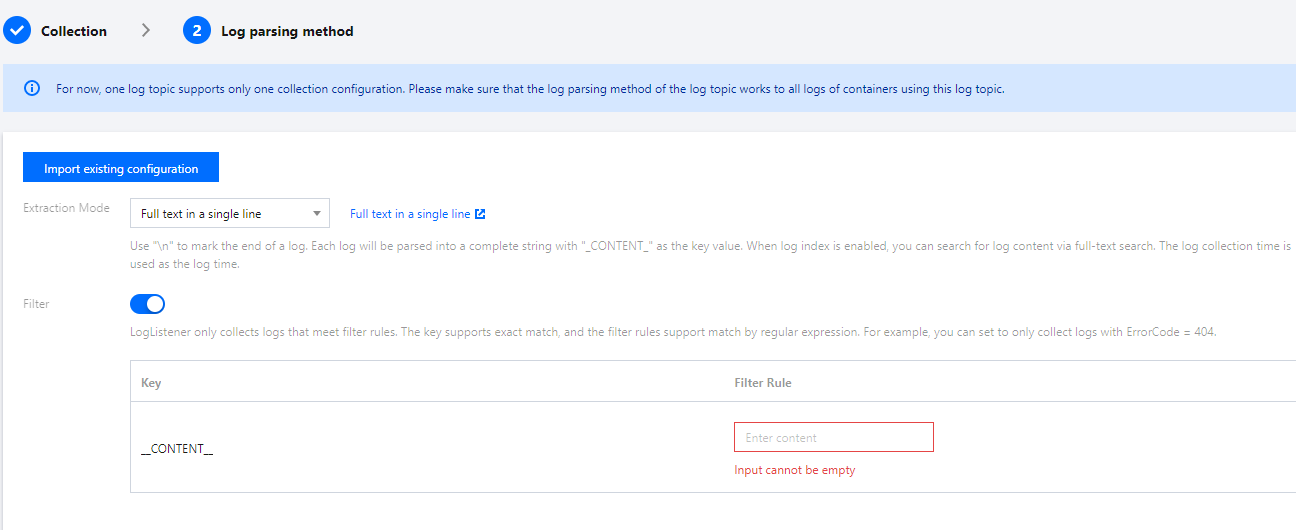
编码模式:支持UTF-8和GBK。
提取模式:支持多种类型的提取模式,详情如下:
解析模式 | 说明 | 相关文档 |
单行全文 | 一条日志仅包含一行的内容,以换行符 \\n 作为一条日志的结束标记,每条日志将被解析为键值为 CONTENT 的一行完全字符串,开启索引后可通过全文检索搜索日志内容。日志时间以采集时间为准。 | |
多行全文 | 指一条完整的日志跨占多行,采用首行正则的方式进行匹配,当某行日志匹配上预先设置的正则表达式,就认为是一条日志的开头,而下一个行首出现作为该条日志的结束标识符,也会设置一个默认的键值 CONTENT,日志时间以采集时间为准。支持自动生成正则表达式。 | |
单行 - 完全正则 | 指将一条完整日志按正则方式提取多个 key-value 的日志解析模式,您需先输入日志样例,其次输入自定义正则表达式,系统将根据正则表达式里的捕获组提取对应的 key-value。支持自动生成正则表达式。 | |
多行 - 完全正则 | 适用于日志文本中一条完整的日志数据跨占多行(例如 Java 程序日志),可按正则表达式提取为多个 key-value 键值的日志解析模式,您需先输入日志样例,其次输入自定义正则表达式,系统将根据正则表达式里的捕获组提取对应的 key-value。支持自动生成正则表达式。 | |
JSON | JSON 格式日志会自动提取首层的 key 作为对应字段名,首层的 value 作为对应的字段值,以该方式将整条日志进行结构化处理,每条完整的日志以换行符 \\n 为结束标识符。 | |
分隔符 | 指一条日志数据可以根据指定的分隔符将整条日志进行结构化处理,每条完整的日志以换行符 \\n 为结束标识符。日志服务在进行分隔符格式日志处理时,您需要为每个分开的字段定义唯一的 key,无效字段即无需采集的字段可填空,不支持所有字段均为空。 |
过滤器:LogListener 仅采集符合过滤器规则的日志,Key 支持完全匹配,过滤规则支持正则匹配,如仅采集
ErrorCode = 404 的日志。您可以根据需求开启过滤器并配置规则。说明:
一个日志主题目前仅支持一个采集配置,请保证选用该日志主题的所有容器的日志都可以接受采用所选的日志解析方式。若在同一日志主题下新建了不同的采集配置,旧的采集配置会被覆盖。
7. 单击完成,完成投递到 CLS 的容器日志采集规则创建。
更新日志规则
1. 登录 容器服务控制台,选择左侧导航栏中的日志管理 > 日志规则。
2. 在日志规则页面上方选择地域和需要更新日志采集规则的集群,单击右侧的编辑收集规则。如下图所示: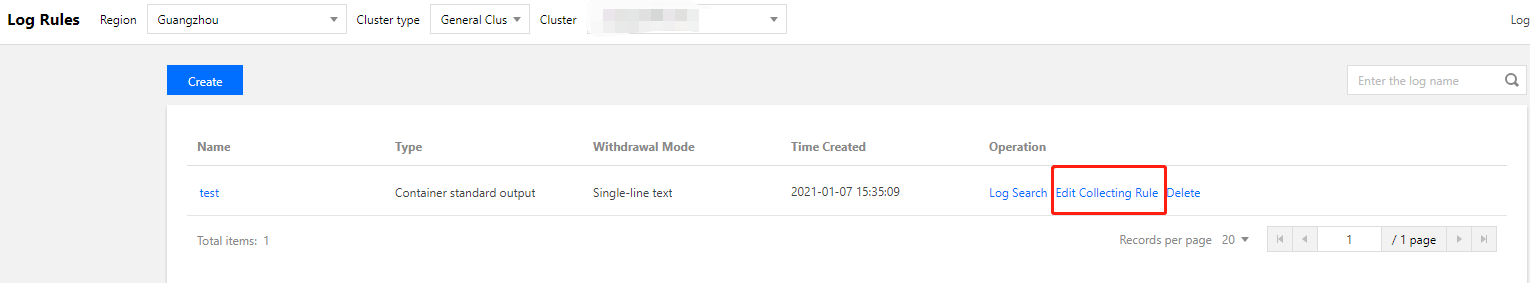
3. 根据需求更新相应配置,单击完成。
注意:
日志集和日志主题不可更新。
相关文档
文档反馈