This document describes how to ship logs of a registered cluster to CLS in the console.
Scenario
TKE's log collection feature allows you to collect logs in a cluster and send logs in specific paths of cluster services or nodes to Tencent Cloud Log Service (CLS). Log collection applies to users who need to store and analyze service logs in Kubernetes clusters.
You need to manually enable log collection for each cluster, and configure the collection rules. After log collection is enabled for a cluster, the log collection agent runs as a DaemonSet in the cluster, collects logs from the collection source based on the collection source, CLS log topic, and log parsing method configured by users in the log collection rules, and sends the collected logs to the consumer.
Notes
You have created a registered cluster, and it is in Running status.
Currently, logs of a registered cluster can be shipped to only CLS but not other log consumers.
Before enabling log collection, ensure that there are sufficient resources on cluster nodes.
0.11 to 1.1 cores are required. You can increase the CPU resources on your own as needed.
24 to 560 MB memory is required. You can increase the memory resources on your own as needed.
The maximum size of a log is 512 K. The log is truncated if this limit is exceeded.
To use the log collection feature, check whether nodes in the Kubernetes cluster can access the log consumer. Here, TKE ships logs over the public and private networks. You can select one option based on your business needs.
Shipping over public network: Cluster logs will be shipped to CLS over the public network. This requires that the cluster nodes can access the public network.
Shipping over private network: Cluster logs will be shipped to CLS over the private network. This requires that the cluster nodes are interconnected with CLS over the private network. Before choosing this option, contact us for confirmation.
Concept
Log Collection Agent: The agent that TKE uses to collect logs. It adopts Loglistener and runs within the cluster as a DaemonSet.
Log Rules: Configures rules to specify the log collection source, log topic, and log parsing method and configure the filter.
The log collection agent monitors changes in the log collection rules, and rule changes take effect within 10 seconds.
Multiple log collection rules do not create multiple DaemonSets, but too many log collection rules cause the log collection agent to occupy more resources.
Log Source: It includes the specified container standard output, files in containers, and node files.
When collecting container standard output logs, users can select TKE logs in all containers or specified workloads and specified Pod labels as the log collection source.
When collecting container file path logs, users can specify container file path logs in workloads or Pod labels as the collection source.
When collecting node file path logs, users can set the node file path as the log collection source.
Consumer: It can be a logset or a log topic.
Extraction mode: The log collection agent can ship the collected logs to the specified log topic in the format of single-line text, JSON, separator-based text, multi-line text, or full regex.
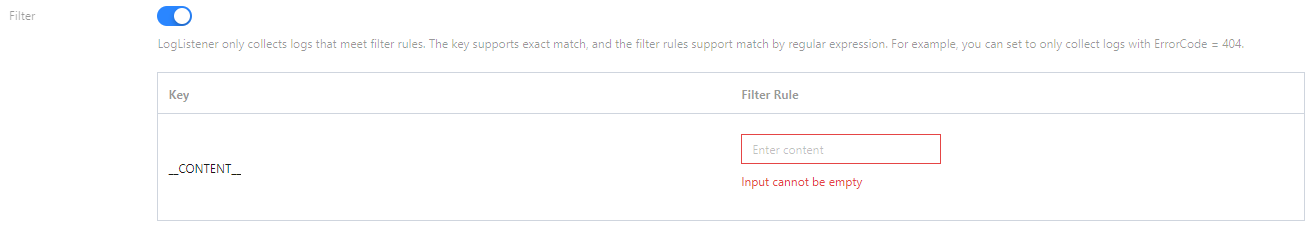
Filter: Sets filters to collect only logs match the rules. "key" supports full matching and the rule supports regex matching. For example, you can set to collect logs containing "ErrorCode = 404".
Directions
Enabling log collection
1. Log in to the TKE console and select Operation Management in the left sidebar.
2. At the top of the Feature Management page, select a desired region and Registered cluster to filter out the cluster for which you want to enable log collection, and click Set on the right.
3. On the Configure Features page, click Edit for log collection, select Enable Log Collection, select the Shipping Method, and click Confirm.
Configuring the log rules
1. Log in to the TKE console and select Log Management > Log Rules in the left sidebar.
2. At the top of the Feature Management page, select a desired region and Registered cluster to filter out the cluster for which you want to configure the log collection rules, and click Create.
3. On the Create Log Collecting Policy page, select the collection type and configure the log source. Currently, the following collection types are supported: Container Standard Output, Container File Path, and Node File Path.
Collecting standard output logs of a container
Collecting file logs in containers
Collecting file logs on nodes
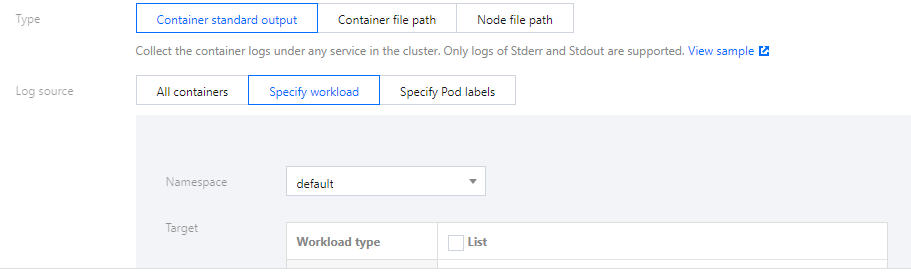
Select Container Standard Output as the collection type and configure the log source as needed. This type of log source allows you to select the workloads of multiple namespaces at a time, as shown in the figure below:
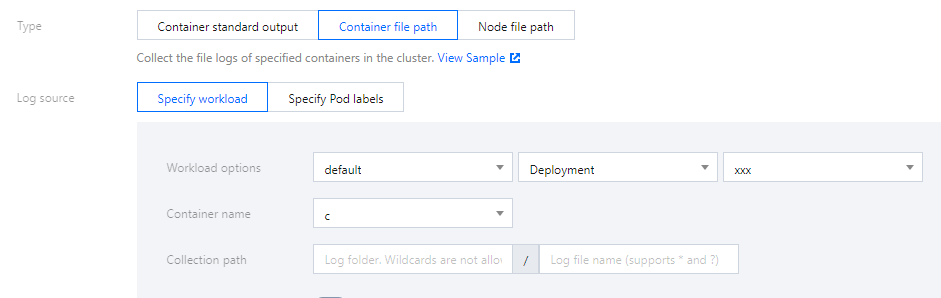
Select Container File Path as the collection type and configure the log source, as shown in the figure below:
You can specify a file path or use wildcards for the collection path. For example, when the container file path is /opt/logs/*.log, you can specify the collection path as /opt/logs and the file name as *.log.
Note:
If the collection type is selected as "Container File Path", the corresponding path cannot be a soft link. Otherwise, the actual path of the soft link will not exist in the collector's container, resulting in log collection failure.
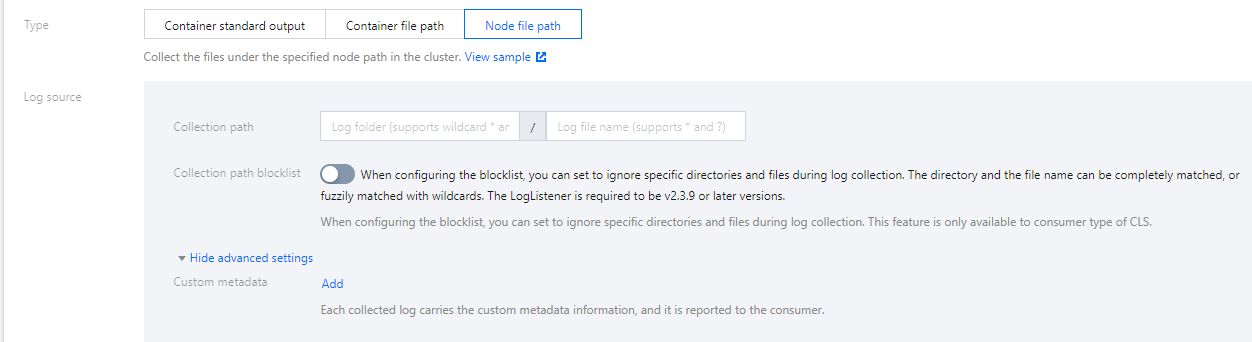
Select Node File Path as the collection type. You can add custom metadata as needed. Attach metadata with a specified key-value pair to the collected log information to add the attached metadata to log records, as shown in the figure below:
Note
Each node log file can be collected to only one log topic.
You can specify a file path or use wildcards. For example, when the container file paths for collection are /opt/logs/service1/*.log and /opt/logs/service2/*.log, you can specify the folder of the collection path as /opt/logs/service* and the file name as *.log.
Note:
For container standard output and container files (not mounted in hostPath), besides the original log content, the metadata related to the container or Kubernetes (such as the ID of the container that generated the logs) will also be reported to the CLS. Therefore, when viewing logs, users can trace the log source or search based on the container identifier or characteristics (such as container name and labels).
The metadata related to the container or Kubernetes is shown in the table below:
Field
Description
container_id
ID of the container to which the log belongs
container_name
Name of the container to which the log belongs
image_name
Image name IP of the container to which the log belongs
namespace
Namespace of the Pod to which the log belongs
pod_uid
UID of the Pod to which the log belongs
pod_name
Name of the Pod to which the log belongs
pod_lable_{label name}
Labels of the Pod to which the log belongs (for example, if a Pod has two labels: app=nginx and env=prod, the reported log will have two metadata entries attached: pod_label_app:nginx and pod_label_env:prod)
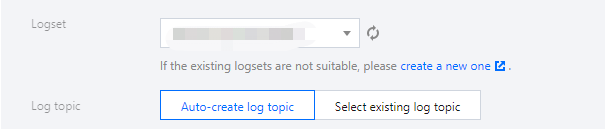
4. Configure CLS as the consumer end. Select the desired logset and log topic. You can create a log topic or select an existing one.
Note
Currently, CLS only supports log collection and reporting for TKE clusters in the same region.
If there are already 500 log topics in the logset, no more log topic can be created.
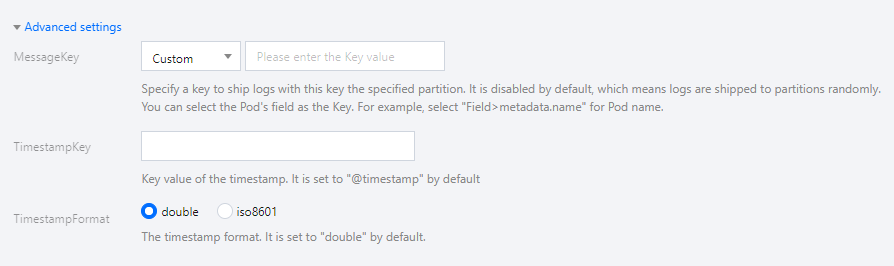
5. You can ship the logs to a specified partition by specifying a key in advanced settings. This feature is disabled by default and the logs are shipped randomly. When it is enabled, logs with the same key are shipped to the same partition. You can enter the TimestampKey (@timestamp by default) and specify the timestamp format. See the figure below:
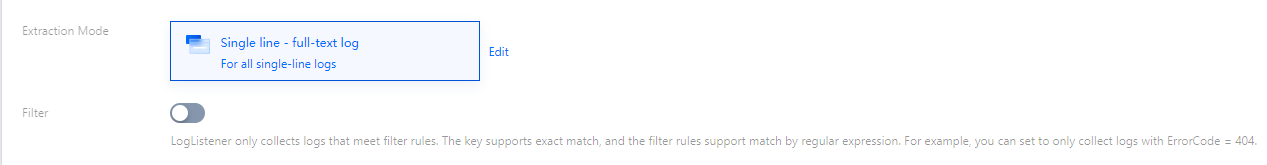
6. Click Next and choose a log extraction mode, as shown below:
Note
Configuring log parsing method is only supported when you select shipping logs to CLS.
Parsing mode
Description
Reference
Full text in a single line
A log contains only one line of content, and the line break \\n to mark the end of a log. Each log will be parsed into a complete string with CONTENT as the key value. When log Index is enabled, you can search for log content via full-text search. The time attribute of a log is determined by the collection time.
A log with full text in multi lines spans multiple lines and a first-line regular expression is used for match. When a log in a line matches the preset regular expression, it is considered as the beginning of a log, and the next matching line will be the end mark of the log. A default key value, CONTENT, will be set as well. The time attribute of a log is determined by the collection time. The regular expression can be generated automatically.
The single-line - full regular expression mode is a log parsing mode where multiple key-value pairs can be extracted from a complete log. When configuring the single-line - full regular expression mode, you need to enter a sample log first and then customize your regular expression. After the configuration is completed, the system will extract the corresponding key-value pairs according to the capture group in the regular expression. The regular expression can be generated automatically.
The multi-line - full regular expression mode is a log parsing mode where multiple key-value pairs can be extracted from a complete piece of log data that spans multiple lines in a log text file (such as Java program logs) based on a regular expression. When configuring the multi-line - full regular expression mode, you need to enter a sample log first and then customize your regular expression. After the configuration is completed, the system will extract the corresponding key-value pairs according to the capture group in the regular expression. The regular expression can be generated automatically.
A JSON log automatically extracts the key at the first layer as the field name and the value at the first layer as the field value to implement structured processing of the entire log. Each complete log ends with a line break \\n.
Structure the data in a log with the specified separator, and each complete log ends with a line break \\n. Define a unique key for each separate field. Leave the field blank if you don’t need to collect it. At least one field is required.
7. Enable the filter and configure rules as needed and then click Done.
Updating the log rules
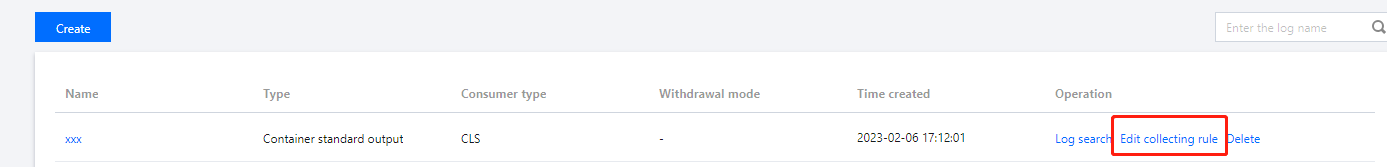
1. Log in to the TKE console and select Log Management > Log Rules in the left sidebar.
2. At the top of the Log Collection page, select a desired region and Registered cluster to filter out the cluster for which you want to configure the log collection rules, and click Edit Collecting Rule.
3. Update the configuration as needed and click Done.
Note
The logset and log topic cannot be modified later.