- Release Notes and Announcements
- Release Notes
- Announcements
- qGPU Service Adjustment
- Version Upgrade of Master Add-On of TKE Managed Cluster
- Upgrading tke-monitor-agent
- Discontinuing TKE API 2.0
- Instructions on Cluster Resource Quota Adjustment
- Discontinuing Kubernetes v1.14 and Earlier Versions
- Deactivation of Scaling Group Feature
- Notice on TPS Discontinuation on May 16, 2022 at 10:00 (UTC +8)
- Basic Monitoring Architecture Upgrade
- Starting Charging on Managed Clusters
- Instructions on Stopping Delivering the Kubeconfig File to Nodes
- Security Vulnerability Fix Description
- Release Notes
- Product Introduction
- Purchase Guide
- Quick Start
- TKE General Cluster Guide
- TKE General Cluster Overview
- Purchase a TKE General Cluster
- High-risk Operations of Container Service
- Deploying Containerized Applications in the Cloud
- Kubernetes API Operation Guide
- Open Source Components
- Permission Management
- Cluster Management
- Cluster Overview
- Cluster Hosting Modes Introduction
- Cluster Lifecycle
- Creating a Cluster
- Deleting a Cluster
- Cluster Scaling
- Changing the Cluster Operating System
- Connecting to a Cluster
- Upgrading a Cluster
- Enabling IPVS for a Cluster
- Enabling GPU Scheduling for a Cluster
- Custom Kubernetes Component Launch Parameters
- Using KMS for Kubernetes Data Source Encryption
- Images
- Worker node introduction
- Normal Node Management
- Native Node Management
- Overview
- Purchasing Native Nodes
- Lifecycle of a Native Node
- Native Node Parameters
- Creating Native Nodes
- Deleting Native Nodes
- Self-Heal Rules
- Declarative Operation Practice
- Native Node Scaling
- In-place Pod Configuration Adjustment
- Enabling SSH Key Login for a Native Node
- Management Parameters
- Enabling Public Network Access for a Native Node
- Supernode management
- Registered Node Management
- GPU Share
- Kubernetes Object Management
- Overview
- Namespace
- Workload
- Deployment Management
- StatefulSet Management
- DaemonSet Management
- Job Management
- CronJob Management
- Setting the Resource Limit of Workload
- Setting the Scheduling Rule for a Workload
- Setting the Health Check for a Workload
- Setting the Run Command and Parameter for a Workload
- Using a Container Image in a TCR Enterprise Instance to Create a Workload
- Auto Scaling
- Configuration
- Register node management
- Service Management
- Ingress Management
- Storage Management
- Application and Add-On Feature Management Description
- Add-On Management
- Add-on Overview
- Add-On Lifecycle Management
- CBS-CSI Description
- UserGroupAccessControl
- COS-CSI
- CFS-CSI
- P2P
- OOMGuard
- TCR Introduction
- TCR Hosts Updater
- DNSAutoscaler
- NodeProblemDetectorPlus Add-on
- NodeLocalDNSCache
- Network Policy
- DynamicScheduler
- DeScheduler
- Nginx-ingress
- HPC
- Description of tke-monitor-agent
- GPU-Manager Add-on
- CFSTURBO-CSI
- tke-log-agent
- Helm Application
- Application Market
- Network Management
- Container Network Overview
- GlobalRouter Mode
- VPC-CNI Mode
- VPC-CNI Mode
- Multiple Pods with Shared ENI Mode
- Pods with Exclusive ENI Mode
- Static IP Address Mode Instructions
- Non-static IP Address Mode Instructions
- Interconnection Between VPC-CNI and Other Cloud Resources/IDC Resources
- Security Group of VPC-CNI Mode
- Instructions on Binding an EIP to a Pod
- VPC-CNI Component Description
- Limits on the Number of Pods in VPC-CNI Mode
- Cilium-Overlay Mode
- OPS Center
- Log Management
- Backup Center
- Cloud Native Monitoring
- Remote Terminals
- TKE Serverless Cluster Guide
- TKE Edge Cluster Guide
- TKE Registered Cluster Guide
- TKE Container Instance Guide
- Cloud Native Service Guide
- Best Practices
- Cluster
- Cluster Migration
- Serverless Cluster
- Edge Cluster
- Security
- Service Deployment
- Hybrid Cloud
- Network
- DNS
- Using Network Policy for Network Access Control
- Deploying NGINX Ingress on TKE
- Nginx Ingress High-Concurrency Practices
- Nginx Ingress Best Practices
- Limiting the bandwidth on pods in TKE
- Directly connecting TKE to the CLB of pods based on the ENI
- Use CLB-Pod Direct Connection on TKE
- Obtaining the Real Client Source IP in TKE
- Using Traefik Ingress in TKE
- Release
- Logs
- Monitoring
- OPS
- Removing and Re-adding Nodes from and to Cluster
- Using Ansible to Batch Operate TKE Nodes
- Using Cluster Audit for Troubleshooting
- Renewing a TKE Ingress Certificate
- Using cert-manager to Issue Free Certificates
- Using cert-manager to Issue Free Certificate for DNSPod Domain Name
- Using the TKE NPDPlus Plug-In to Enhance the Self-Healing Capability of Nodes
- Using kubecm to Manage Multiple Clusters kubeconfig
- Quick Troubleshooting Using TKE Audit and Event Services
- Customizing RBAC Authorization in TKE
- Clearing De-registered Tencent Cloud Account Resources
- Terraform
- DevOps
- Auto Scaling
- Cluster Auto Scaling Practices
- Using tke-autoscaling-placeholder to Implement Auto Scaling in Seconds
- Installing metrics-server on TKE
- Using Custom Metrics for Auto Scaling in TKE
- Utilizing HPA to Auto Scale Businesses on TKE
- Using VPA to Realize Pod Scaling up and Scaling down in TKE
- Adjusting HPA Scaling Sensitivity Based on Different Business Scenarios
- Storage
- Containerization
- Microservice
- Cost Management
- Fault Handling
- Disk Full
- High Workload
- Memory Fragmentation
- Cluster DNS Troubleshooting
- Cluster kube-proxy Troubleshooting
- Cluster API Server Inaccessibility Troubleshooting
- Service and Ingress Inaccessibility Troubleshooting
- Troubleshooting for Pod Network Inaccessibility
- Pod Status Exception and Handling
- Authorizing Tencent Cloud OPS Team for Troubleshooting
- Engel Ingres appears in Connechtin Reverside
- CLB Loopback
- CLB Ingress Creation Error
- API Documentation
- History
- Introduction
- API Category
- Making API Requests
- Cluster APIs
- DescribeEncryptionStatus
- DisableEncryptionProtection
- EnableEncryptionProtection
- AcquireClusterAdminRole
- CreateClusterEndpoint
- CreateClusterEndpointVip
- DeleteCluster
- DeleteClusterEndpoint
- DeleteClusterEndpointVip
- DescribeAvailableClusterVersion
- DescribeClusterAuthenticationOptions
- DescribeClusterCommonNames
- DescribeClusterEndpointStatus
- DescribeClusterEndpointVipStatus
- DescribeClusterEndpoints
- DescribeClusterKubeconfig
- DescribeClusterLevelAttribute
- DescribeClusterLevelChangeRecords
- DescribeClusterSecurity
- DescribeClusterStatus
- DescribeClusters
- DescribeEdgeAvailableExtraArgs
- DescribeEdgeClusterExtraArgs
- DescribeResourceUsage
- DisableClusterDeletionProtection
- EnableClusterDeletionProtection
- GetClusterLevelPrice
- GetUpgradeInstanceProgress
- ModifyClusterAttribute
- ModifyClusterAuthenticationOptions
- ModifyClusterEndpointSP
- UpgradeClusterInstances
- CreateCluster
- UpdateClusterVersion
- UpdateClusterKubeconfig
- DescribeBackupStorageLocations
- DeleteBackupStorageLocation
- CreateBackupStorageLocation
- Add-on APIs
- Network APIs
- Node APIs
- Node Pool APIs
- TKE Edge Cluster APIs
- DescribeTKEEdgeScript
- DescribeTKEEdgeExternalKubeconfig
- DescribeTKEEdgeClusters
- DescribeTKEEdgeClusterStatus
- DescribeTKEEdgeClusterCredential
- DescribeEdgeClusterInstances
- DescribeEdgeCVMInstances
- DescribeECMInstances
- DescribeAvailableTKEEdgeVersion
- DeleteTKEEdgeCluster
- DeleteEdgeClusterInstances
- DeleteEdgeCVMInstances
- DeleteECMInstances
- CreateTKEEdgeCluster
- CreateECMInstances
- CheckEdgeClusterCIDR
- ForwardTKEEdgeApplicationRequestV3
- UninstallEdgeLogAgent
- InstallEdgeLogAgent
- DescribeEdgeLogSwitches
- CreateEdgeLogConfig
- CreateEdgeCVMInstances
- UpdateEdgeClusterVersion
- DescribeEdgeClusterUpgradeInfo
- Cloud Native Monitoring APIs
- Virtual node APIs
- Other APIs
- Scaling group APIs
- Data Types
- Error Codes
- API Mapping Guide
- TKE Insight
- TKE Scheduling
- FAQs
- Service Agreement
- Contact Us
- Purchase Channels
- Glossary
- User Guide(Old)
Scenarios
TKE provides users with an out-of-the-box event dashboard and can automatically configure analysis dashboards of event overview and exception events aggregation search for the clusters with the feature of Event Storage enabled. With user-defined filter items, and built-in CLS event global search, uses can comprehensively observe, find, analyze, and locate problems in the TKE console.
Description
Three dashboards are configured in the Event Search, namely Event Overview, Exception Events Aggregation Search, and Global Search. Please follow the steps below to go to the Event Search page and use the corresponding features:
1. Log in to the TKE console.
2. Enable Event Storage. For more information, see Event Storage.
3. Select Log Management > Event Logs in the left sidebar.
4. At the top of the Event Search page, select the region and cluster type to view the cluster event details.
Event overview
On the Event Overview page, you can filter events based on dimensions such as the cluster ID, namespace, level, reason, resource type, resource object event source, view summary statistics of core events, and display data comparison within a period, for example, dashboards of the total number and distribution of events, node exceptions, Pod OOM, important event trends, and top exception event lists.
You can customize the filter items as needed, as shown in the figure below: 
You can view more statistics on this page, as shown below:
Total number of events, level distribution, exception event reason and object distribution: 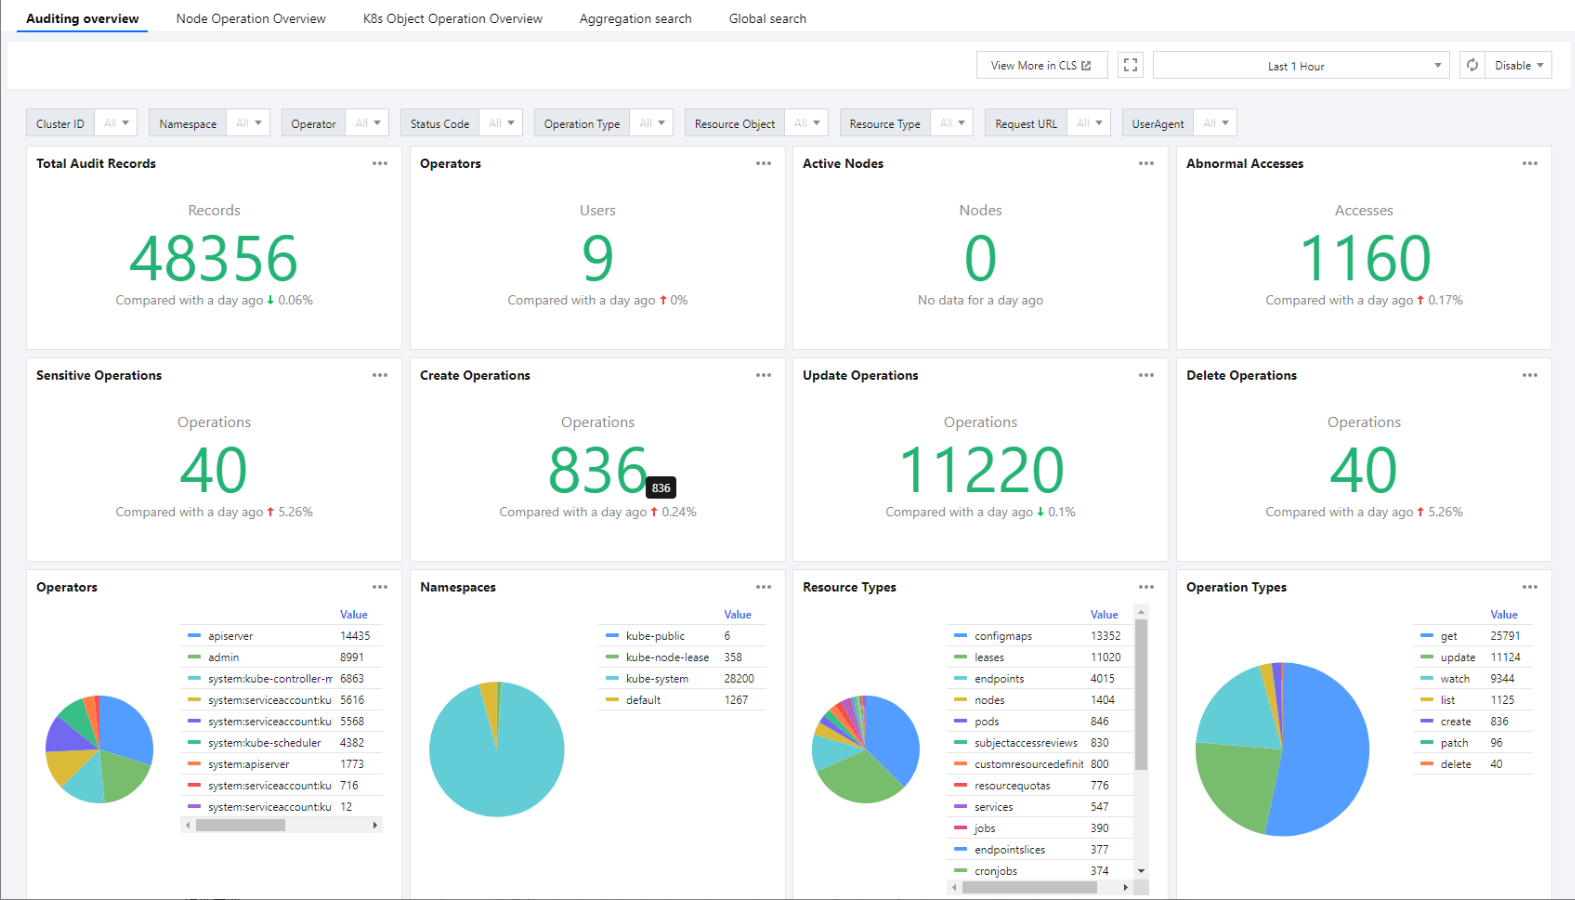
Summary of various common events: 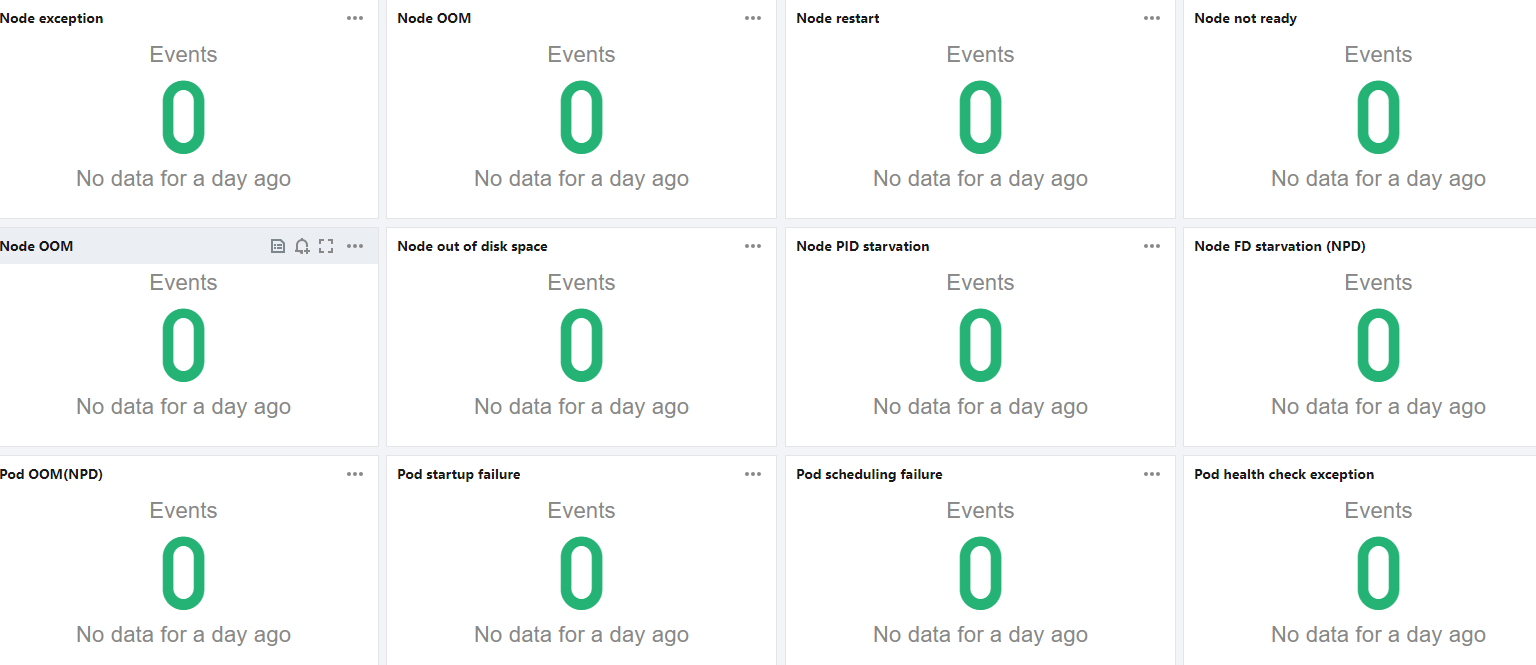
Event trends and top exception events list: 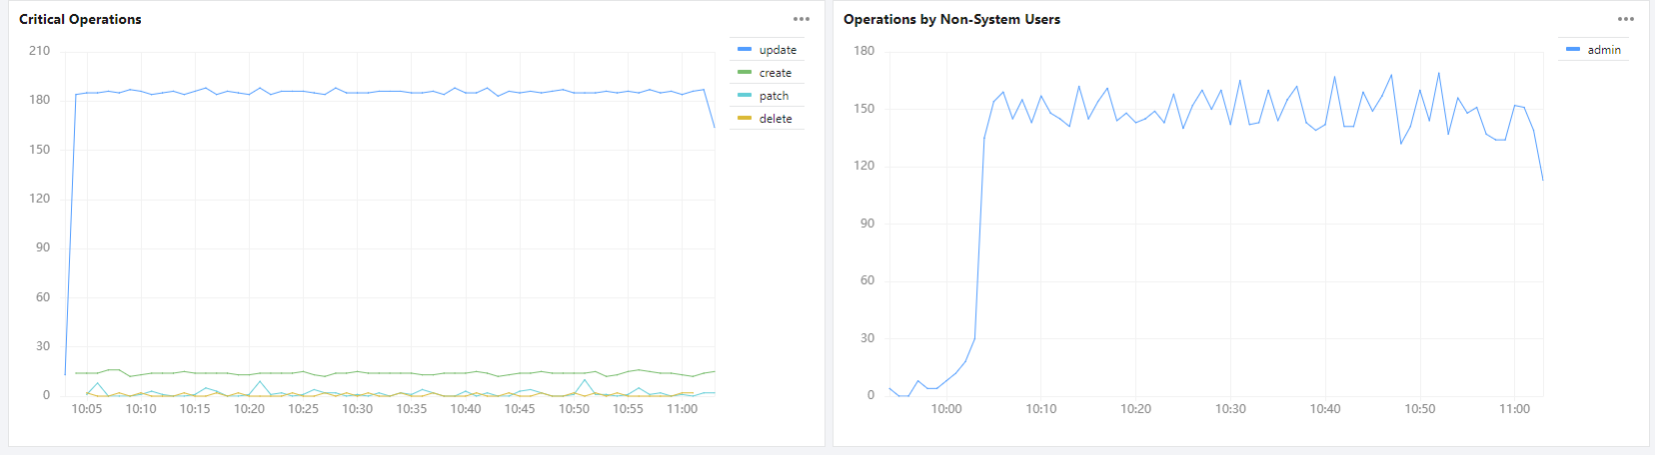
Exception events aggregation search
On the Exception Events Aggregation Search page, you can set filter conditions to view the reason and object distribution trends of various exception events in a certain period of time. You can also search the exception events in the list below the trend diagrams to quickly locate the problems as shown below: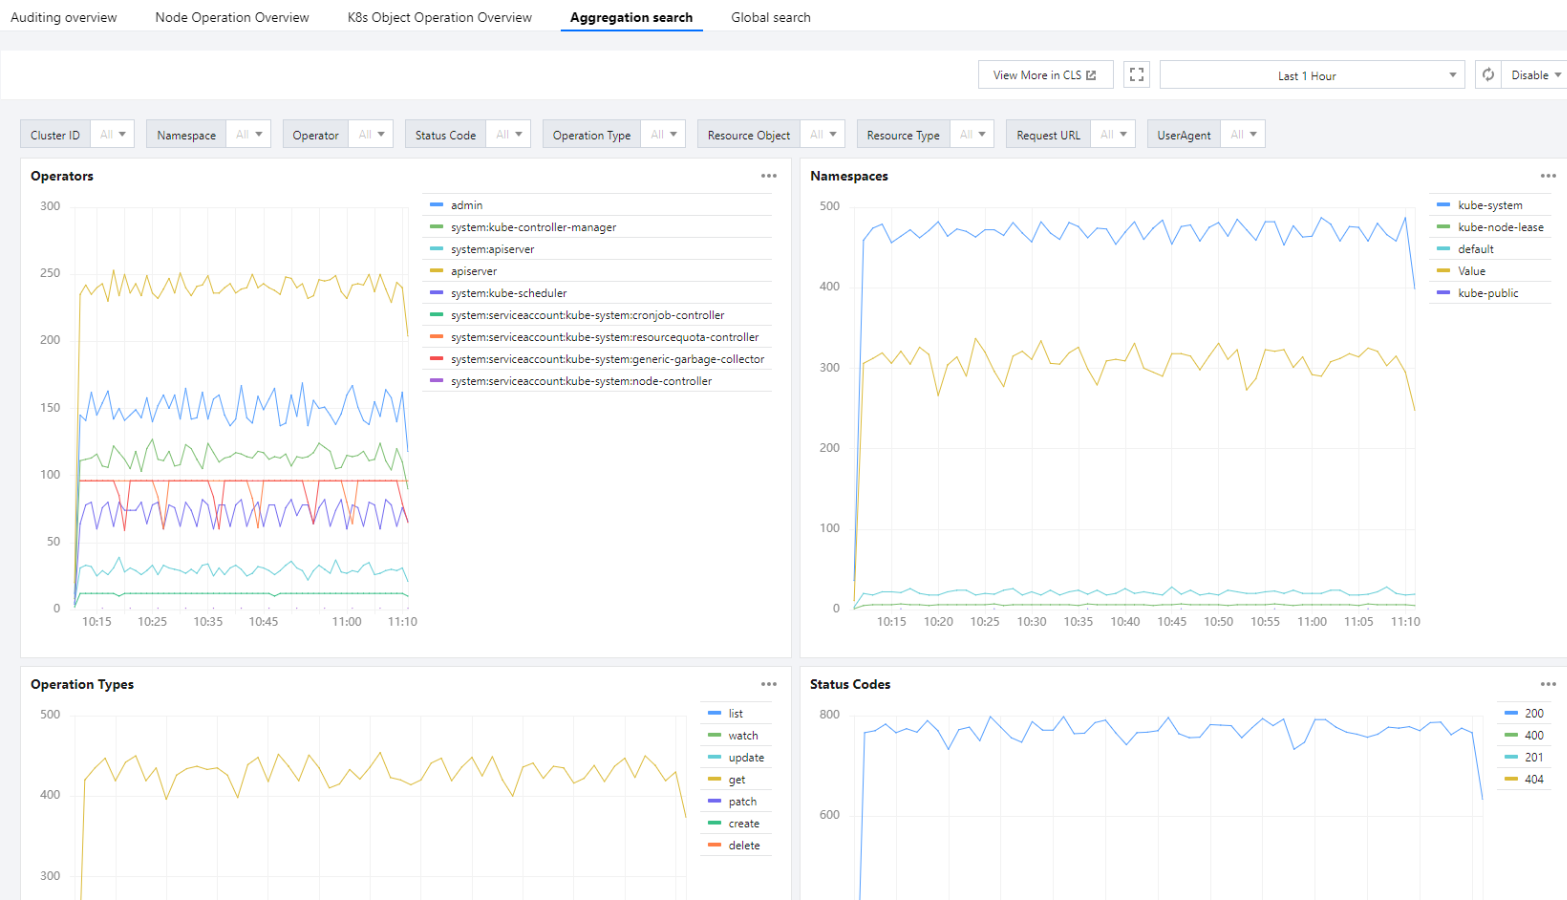
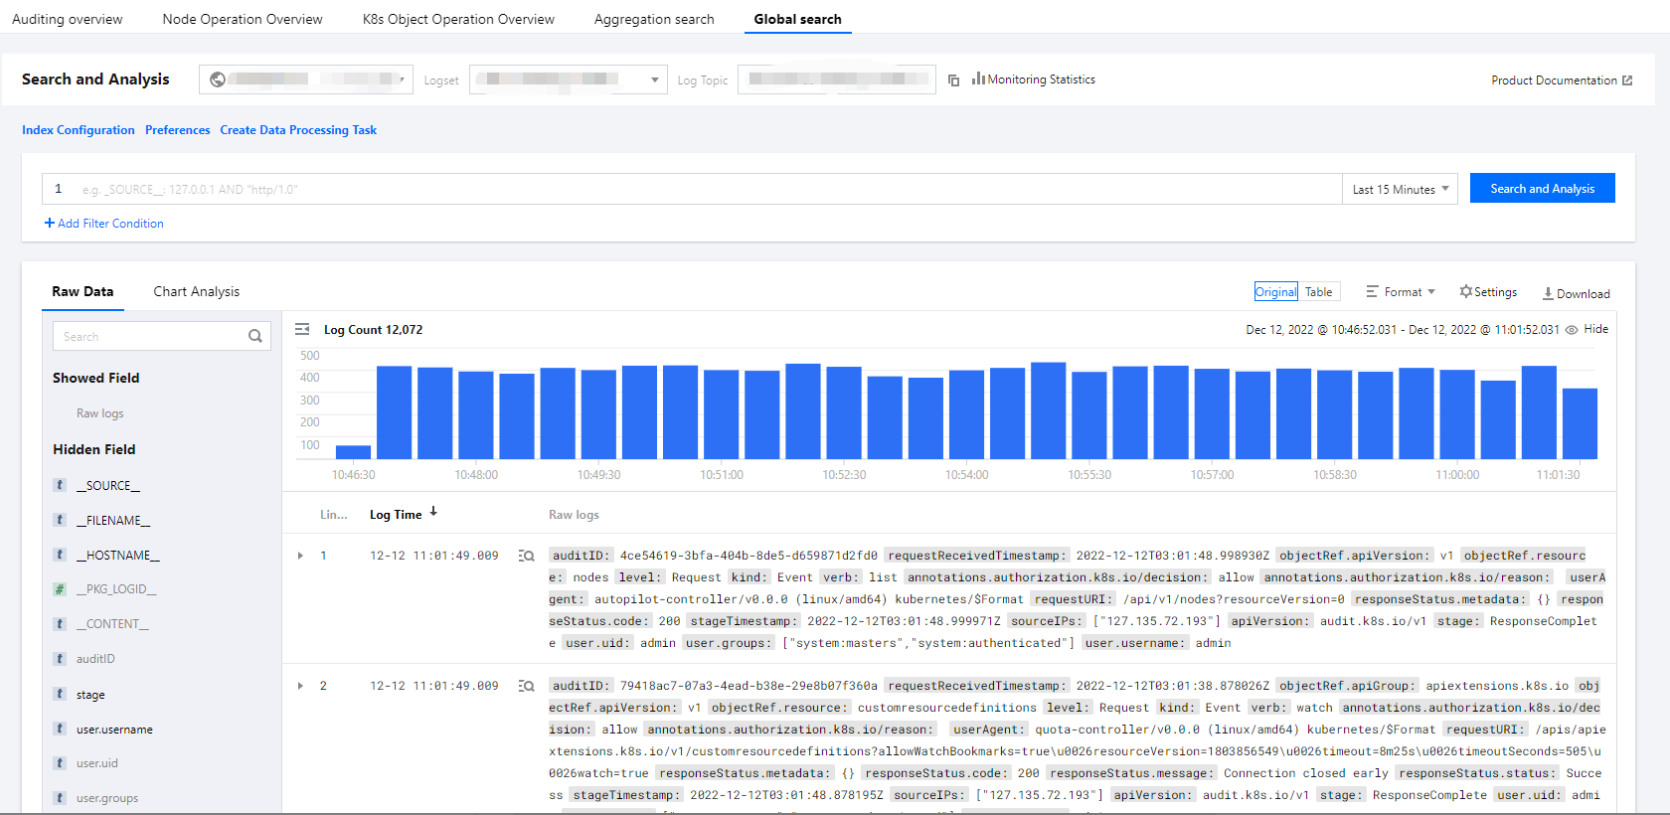
Global search
Global search dashboard, with built-in CLS search analysis page, is convenient for users to quickly search all events in the TKE console as shown below:
Configuring alarms based on the dashboards
You can configure alarms based on the preset dashboards. When the conditions you set are reached, the alarms will be triggered. The steps are as follows:
1. Click Add to Monitoring Alarm on the right of the target dashboard. 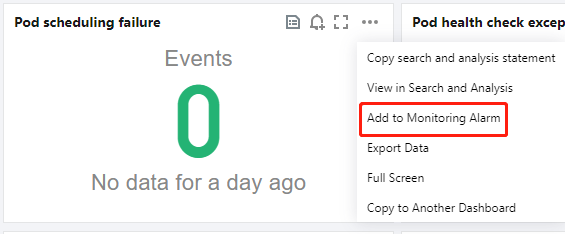
2. Create an alarm policy in Alarm Policy in the CLS console as instructed in Configuring Alarming Policies.

 Yes
Yes
 No
No
Was this page helpful?