Adjusting HPA Scaling Sensitivity Based on Different Business Scenarios
Download
Focus Mode
Font Size
Last updated: 2026-05-13 10:32:16
Support for Scaling Speed Adjustment by HPA v2beta2 and Later
Sensitivity adjustment for HPA scale-out is not supported by versions earlier than K8s 1.18.
The --horizontal-pod-autoscaler-downscale-stabilization-window parameter of kube-controller-manager controls the scale-in time window, which is five minutes by default, that is, a scale-in can be performed at least five minutes after the workload reduction.
The fixed algorithm of the HPA controller and the constant factor of hardware encoding control the scale-out speed, which cannot be customized.
In this design logic, users cannot customize the speed of HPA scaling. However, different business scenarios may have different requirements for scaling sensitivity:
1. For key businesses with traffic surges, a scale-out needs to be fast (if needed), and a scale-in needs to be slow (to avoid another traffic peak).
2. Applications processing key data should be scaled out as soon as possible when the data volume surges, so as to speed up data processing. When the data volume decreases, they should be scaled in as soon as possible to reduce costs. Unnecessary and frequent scaling operations are acceptable when the data volume jitters momentarily.
3. Businesses processing general data/network traffic can be scaled in a general way to reduce jitters.
HPA is updated on K8s 1.18, where scaling sensitivity control is added to v2beta2, but the version number of v2beta2 remains unchanged.
Principles and Misunderstandings
During HPA scaling, the fixed algorithm is first used to calculate the desired number of replicas:
Desired number of replicas = ceil[current number of replicas * (current metric / desired metric)]
Here, if "current metric / desired metric" is close to 1 (which is within the default tolerance of 0.1, that is, the ratio ranges between 0.9 and 1.1), no scaling is performed; otherwise, jitters may cause frequent scaling.
Note:
Tolerance is determined by the --horizontal-pod-autoscaler-tolerance parameter of kube-controller-manager. It defaults to 0.1, that is, 10%.
Scaling speed adjustment described in this document doesn't mean adjusting the algorithm for calculating the desired number of replicas. It doesn't increase/decrease the scaling ratio or quantity, but only controls the scaling speed. The implementation should deliver the following effect: controlling the maximum custom ratio/number of Pods that can be added/released in a custom time period allowed by HPA.
How to Use
In this update, the behavior field is added to HPA Spec, which contains the scaleUp and scaleDown fields for scaling control. For more information, see HPAScalingRules v2beta2 autoscaling.
Sample code
apiVersion: autoscaling/v2beta2
kind: HorizontalPodAutoscaler
metadata:
name: web
spec:
minReplicas:1
maxReplicas:1000
metrics:
-pods:
metric:
name: k8s_pod_rate_cpu_core_used_limit
target:
averageValue:"80"
type: AverageValue
type: Pods
scaleTargetRef:
apiVersion: apps/v1
kind: Deployment
name: web
behavior:# This is the key point.
scaleDown:
stabilizationWindowSeconds:300# When a scale-in is needed, observe for five minutes first. If it is still needed, perform the scale-in.
policies:
-type: Percent
value:100# Allow for releasing all
periodSeconds:15
scaleUp:
stabilizationWindowSeconds:0# Perform a scale-out when needed
policies:
-type: Percent
value:100
periodSeconds:15# Up to one time the current number of Pods can be added every 15 seconds.
-type: Pods
value:4
periodSeconds:15# Up to four Pods can be added every 15 seconds.
selectPolicy: Max # Use the larger value of the two calculated based on the above two scale-out policies
Notes
The above behavior configuration is default, which means it will be added by default if not specified.
You can configure one or more policies for scaleUp and scaleDown. selectPolicy determines which policy to use for scaling.
selectPolicy is Max by default, that is, different calculation results are evaluated and the largest number of Pods is selected for scaling.
stabilizationWindowSeconds is the stable window period, that is, scaling is performed only when the metric is below or above the threshold for the stable window period. This is to avoid frequent scaling caused by jitters. For a scale-out, the stable window defaults to 0, indicating to perform the scale-out immediately; for a scale-in, it defaults to five minutes.
policies defines the scaling policy. type can be Pods or Percent, indicating the maximum number or ratio of replicas that can be added every periodSeconds.
Scenarios and Samples
Fast scale-out
If you need to quickly scale out your application, you can use the following HPA configuration:
behavior:
scaleUp:
policies:
-type: Percent
value:900
periodSeconds:15# Up to nine times the current number of replicas can be added every 15 seconds.
The above configuration indicates that nine times the current number of replicas are added immediately, within the maxReplicas limit though.
Suppose there is only one Pod, the traffic surges, and the metric constantly exceeds nine times the threshold, a scale-out will be performed quickly, during which the number of Pods will change as follows:
1 -> 10 -> 100 -> 1000
If no scale-in policy is configured, a scale-in will be performed after the global default time window (which is five minutes by default).
Fast scale-out and slow scale-in
When the traffic peak is over and the concurrent volume drops significantly, if the default scale-in policy is used, the number of Pods will drop a few minutes later. If another traffic peak comes unexpectedly after the scale-in, the scale-out will be fast but still take some time. If the traffic surges to a really high level, the backend may fail to keep up, causing some requests to fail. In this case, you can add a scale-in policy for HPA by configuring behavior as follows:
behavior:
scaleUp:
policies:
-type: Percent
value:900
periodSeconds:15# Up to nine times the current number of replicas can be added every 15 seconds.
scaleDown:
policies:
-type: Pods
value:1
periodSeconds:600# Only one Pod can be released every ten minutes.
In the above sample, the scaleDown configuration is added, specifying that only one Pod can be released every ten minutes. This greatly slows down the scale-in, during which the number of Pods will change as follows:
1000 -> ... (10 minutes later) -> 999
In this way, key businesses will be able to handle traffic surges, and the requests won't fail.
Slow scale-out
If you want to make scale-outs slow and stable for general applications, add the following behavior configuration to HPA:
behavior:
scaleUp:
policies:
-type: Pods
value:1
periodSeconds:300# Only one Pod can be added every five minutes.
Suppose there is only one Pod and the metric constantly exceeds the threshold, the number of Pods will change as follows during the scale-out:
1 -> 2 -> 3 -> 4
Disabling automatic scale-in
If you want to prevent key applications from an automatic scale-in after a scale-out and need to determine the scale-in conditions by manual intervention or a self-developed controller, you can use the following behavior configuration to disable automatic scale-in:
behavior:
scaleDown:
selectPolicy: Disabled
Extending the time window for scale-in
By default, the time window for scale-in is five minutes. If you need to extend the time window to avoid exceptions caused by traffic peaks, you can specify the time window for scale-in by configuring behavior as follows:
behavior:
scaleDown:
stabilizationWindowSeconds:600# Perform a scale-in ten minutes later
policies:
-type: Pods
value:5
periodSeconds:600# Up to five Pods can be released every ten minutes.
In the above sample, when the load drops, a scale-in will be performed 600 seconds (ten minutes) later, and up to five Pods can be released every ten minutes.
Extending the time window for scale-out
Some applications often undergo frequent scale-outs due to data spikes, and the added Pods may be a waste of resources. In data processing pipelines, the desired number of replicas depends on the number of events in the queue. When a large number of events are heaped in the queue, a fast but not too sensitive scale-out is desired, as the heap may last only a short time and disappear even if no scale-out is performed.
The default scale-out algorithm executes a scale-out after a short period of time. You can add a time window to avoid resource waste after a scale-out caused by spikes. Below is the sample behavior configuration:
behavior:
scaleUp:
stabilizationWindowSeconds:300# A scale-out is performed after a 5-minute time window.
policies:
-type: Pods
value:20
periodSeconds:60# Up to 20 Pods can be added every minute.
In the above sample, a scale-out is performed after a 5-minute time window. If the metric falls below the threshold during this window, no scale-out is performed. If the metric constantly exceeds the threshold, a scale-out is performed, and up to 20 Pods can be added every minute.
FAQs
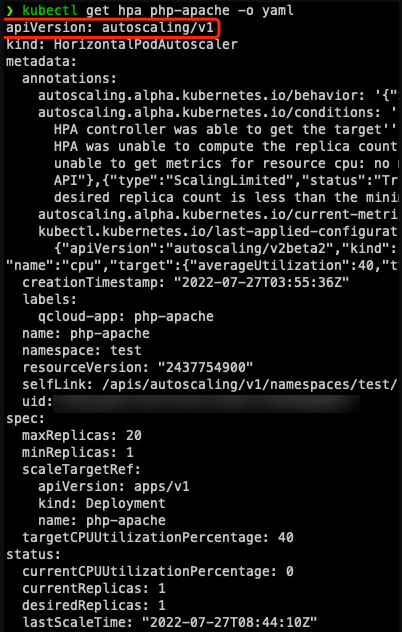
Why is YAML on v1 or v2beta1 obtained after a HPA is created by using v2beta2?
This is because HPA has many API versions:
kubectl api-versions |grep autoscaling
autoscaling/v1
autoscaling/v2beta1
autoscaling/v2beta2
The version number is irrelevant to the version for creation (which is automatically converted).
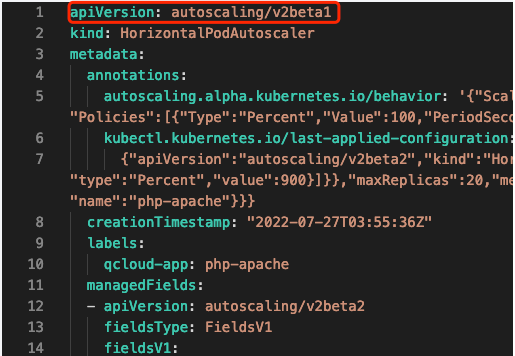
If kubectl is used, during API discovery, various types of resources and version information returned by the API server will be cached. Some resources are available in multiple versions; if the version to get is not specified, the default version will be used, which is v1 for HPA. If the operation is performed on some platform UIs, the result will depend on the platform implementation method. In the TKE console, the default version is v2beta1:
How do I use the v2beta2 version to get or edit?
Just specify the complete resource name containing the version information:
kubectl get horizontalpodautoscaler.v2beta2.autoscaling php-apache -o yaml
Why is a scale-out slow when it is configured to be fast?
Add the following configuration:
behavior:
scaleUp:
policies:
-type: Percent
value:900
periodSeconds:10
It indicates that up to nine times the current number of Pods can be added every ten seconds. In actual tests, it happens that the scale-out is slow when the threshold is greatly exceeded.
Generally, it's due to the calculation period and metric latency:
There is a period for calculating the desired number of replicas, which defaults to 15 seconds (determined by the --horizontal-pod-autoscaler-sync-period parameter of kube-controller-manager).
During each calculation, the corresponding metric API is used to get the current monitoring metric value, which is usually not returned in real time. For the TKE service, monitoring data is reported once every minute. For self-built Prometheus and Prometheus Adapter, monitoring data is updated according to the monitoring data scrape interval, and the --metrics-relist-interval parameter in Prometheus Adapter determines the monitoring metric refresh period (which can be queried in Prometheus); the sum of the two is the longest period for a monitoring data update.
Generally, extreme HPA sensitivity is not necessary, and a certain latency is acceptable. In highly sensitive scenarios, you can use Prometheus to shorten the monitoring metric scrape interval and --metrics-relist-interval of the Prometheus Adapter.
Summary
This document describes how to use new HPA features to control the scaling speed so as to meet the requirements in different scenarios. It also provides some common scenarios and configuration samples that can be used as needed.