使用 Prometheus 监控 MySQL 与 MariaDB
下载
聚焦模式
字号
操作场景
MySQL 是常用的关系型数据库,MariaDB 作为 MySQL 的分支版本,兼容 MySQL 协议,也越来越流行。在 Kubernetes 环境中,可借助开源的 mysqld-exporter 来使用 Prometheus 监控 MySQL 与 MariaDB。您可通过本文了解 Prometheus 并开始使用。
mysqld-exporter 简介
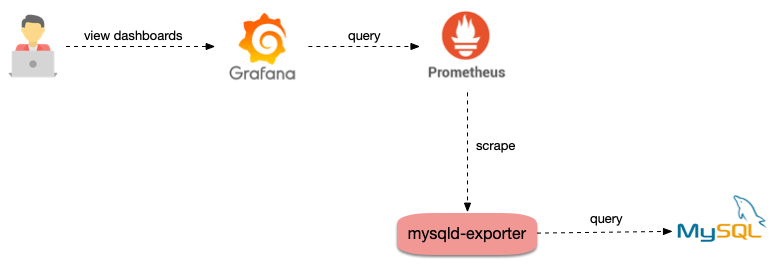
mysqld-exporter 通过读取 MySQL 或 MariaDB 中某些数据库状态的数据,将其转换为 Prometheus 的指标格式并暴露为 HTTP 接口被 Prometheus 采集,让原本不支持 Prometheus 指标的 MySQL 和 MariaDB 能够被 Prometheus 监控起来。如下图所示:
操作步骤
部署 mysqld-exporter
注意:
在部署 mysqld-exporter 之前需确保已在集群内、集群外或使用已有的云服务中部署 MySQL 或 MariaDB。
部署 MySQL
以从应用市场部署 MySQL 到集群为例。步骤如下:
1. 登录 容器服务控制台,在左侧导航栏选择应用市场。
2. 在应用市场页面,搜索并选择 MySQL。
3. 在应用详情页面,单击创建应用。
4. 在创建应用页面,填写应用信息后单击创建。
5. 应用创建完成后,在左侧导航栏选择应用,在应用页面查看应用详情。
6. 执行以下命令,查看 MySQL 是否正常运行。
$ kubectl get podsNAME READY STATUS RESTARTS AGEmysql-698b898bf7-4dc5k 1/1 Running 0 11s
7. 执行以下命令,获取 root 密码。
$ kubectl get secret -o jsonpath={.data.mysql-root-password} mysql | base64 -d6ZAj33yLBo
部署 mysqld-exporter
部署 MySQL 后,可以开始部署 mysqld-exporter。步骤如下:
1. 依次执行以下命令,创建 mysqld-exporter 账号并登录 MySQL。示例如下:
$ kubectl exec -it mysql-698b898bf7-4dc5k bash
$ mysql -uroot -p6ZAj33yLBo
2. 执行以下命令,输入 SQL 语句创建账号。以
mysqld-exporter/123456 为例,示例如下:CREATE USER 'mysqld-exporter' IDENTIFIED BY '123456' WITH MAX_USER_CONNECTIONS 3;GRANT PROCESS, REPLICATION CLIENT, REPLICATION SLAVE, SELECT ON *.* TO 'mysqld-exporter';flush privileges;
3. 使用 yaml 文件部署 mysqld-exporter。示例如下:
注意:
需根据实际情况替换 DATA_SOURCE_NAME 中的账号密码,以及 MySQL 的连接地址。
apiVersion: apps/v1kind: Deploymentmetadata:name: mysqld-exporterspec:replicas: 1selector:matchLabels:app: mysqld-exportertemplate:metadata:labels:app: mysqld-exporterspec:containers:- name: mysqld-exporterimage: prom/mysqld-exporter:v0.12.1args:- --collect.info_schema.tables- --collect.info_schema.innodb_tablespaces- --collect.info_schema.innodb_metrics- --collect.global_status- --collect.global_variables- --collect.slave_status- --collect.info_schema.processlist- --collect.perf_schema.tablelocks- --collect.perf_schema.eventsstatements- --collect.perf_schema.eventsstatementssum- --collect.perf_schema.eventswaits- --collect.auto_increment.columns- --collect.binlog_size- --collect.perf_schema.tableiowaits- --collect.perf_schema.indexiowaits- --collect.info_schema.userstats- --collect.info_schema.clientstats- --collect.info_schema.tablestats- --collect.info_schema.schemastats- --collect.perf_schema.file_events- --collect.perf_schema.file_instances- --collect.perf_schema.replication_group_member_stats- --collect.perf_schema.replication_applier_status_by_worker- --collect.slave_hosts- --collect.info_schema.innodb_cmp- --collect.info_schema.innodb_cmpmem- --collect.info_schema.query_response_time- --collect.engine_tokudb_status- --collect.engine_innodb_statusports:- containerPort: 9104protocol: TCPenv:- name: DATA_SOURCE_NAMEvalue: "mysqld-exporter:123456@(mysql.default.svc.cluster.local:3306)/"--apiVersion: v1kind: Servicemetadata:name: mysqld-exporterlabels:app: mysqld-exporterspec:type: ClusterIPports:- port: 9104protocol: TCPname: httpselector:app: mysqld-exporter
添加监控采集配置
部署 mysqld-exporter 后,添加监控采集配置,让 mysqld-exporter 暴露的数据可被采集。ServiceMonitor 定义示例如下(需要集群中支持):
apiVersion: monitoring.coreos.com/v1kind: ServiceMonitormetadata:name: mysqld-exporterspec:endpoints:interval: 5stargetPort: 9104namespaceSelector:matchNames:- defaultselector:matchLabels:app: mysqld-exporter
Prometheus 原生配置示例如下:
- job_name: mysqld-exporterscrape_interval: 5skubernetes_sd_configs:- role: endpointsnamespaces:names:- defaultrelabel_configs:- action: keepsource_labels:- __meta_kubernetes_service_label_app_kubernetes_io_nameregex: mysqld-exporter- action: keepsource_labels:- __meta_kubernetes_endpoint_port_nameregex: http
添加监控面板
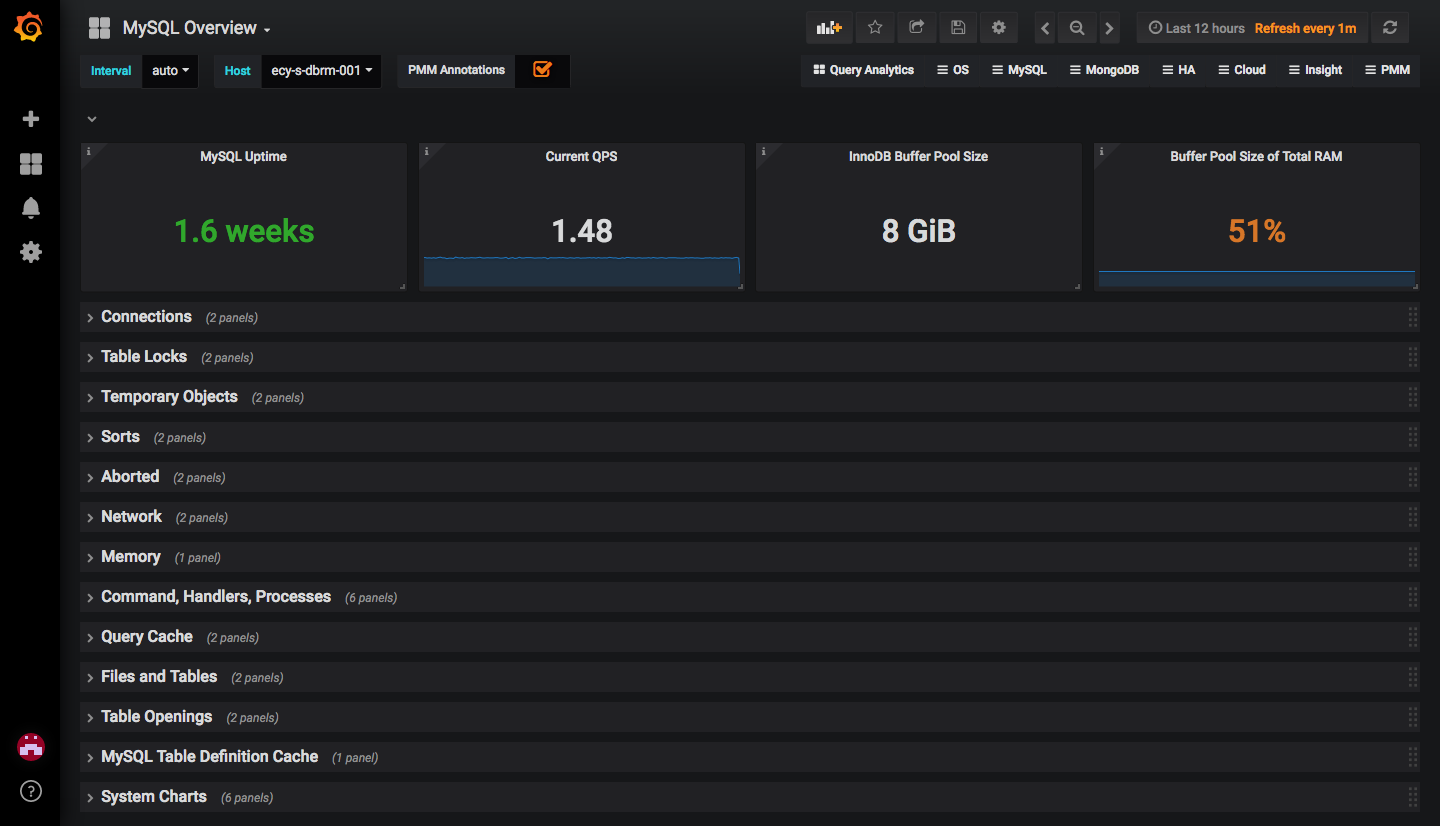
监控采集配置能正常采集数据之后,还需要为 Grafana 添加监控面板进行展示。
如果只需观察 MySQL 或 MariaDB 的概览情况,可导入面板 grafana.com。如下图所示:
如果需要更丰富的面板,导入 percona 开源面板 中
MySQL_ 开头的 json 文件中的内容即可。文档反馈