If your Dynamic Scheduler uses TPS as the data source and you don't change it, the Dynamic Scheduler will become invalid. To use TMP as the data source, you need to upgrade the Dynamic Scheduler before associating it with a TMP instance, as TMP adds API authentication capabilities.
If your Dynamic Scheduler uses the self-built Prometheus service, it will not be affected by the TPS deactivation, but you need to guarantee the stability and reliability of the self-built Prometheus service.
Overview
Add-on description
The Dynamic Scheduler is a dynamic scheduler provided by TKE for pre-selection and preferential selection based on actual node loads. It is implemented based on the native kube-scheduler extender mechanism of Kubernetes. After being installed in a TKE cluster, this add-on will work with the kube-scheduler to effectively prevent node load imbalances caused by the native scheduler through the request and limit scheduling mechanisms.
This add-on relies on the Prometheus add-on and rule configuration. We recommend you follow the instructions in Deploying dependencies; otherwise, the add-on may not work properly.
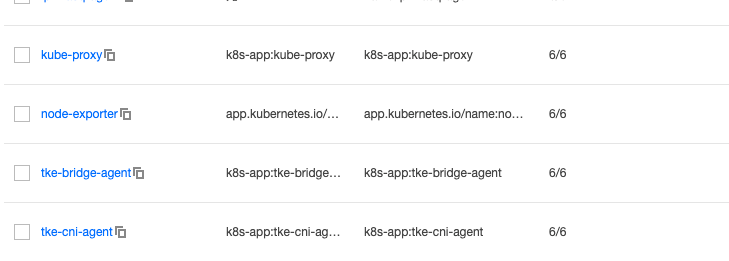
Kubernetes objects deployed in a cluster
Kubernetes Object Name
Type
Requested Resource
Namespace
node-annotator
Deployment
100 MB CPU and 100 MiB MEM for each instance; one instance in total
kube-system
dynamic-scheduler
Deployment
400 MB CPU and 200 MiB MEM for each instance; three instances in total
kube-system
dynamic-scheduler
Service
-
kube-system
node-annotator
ClusterRole
-
kube-system
node-annotator
ClusterRoleBinding
-
kube-system
node-annotator
ServiceAccount
-
kube-system
dynamic-scheduler-policy
ConfigMap
-
kube-system
restart-kube-scheduler
ConfigMap
-
kube-system
probe-prometheus
ConfigMap
-
kube-system
Use Cases
Uneven cluster loads
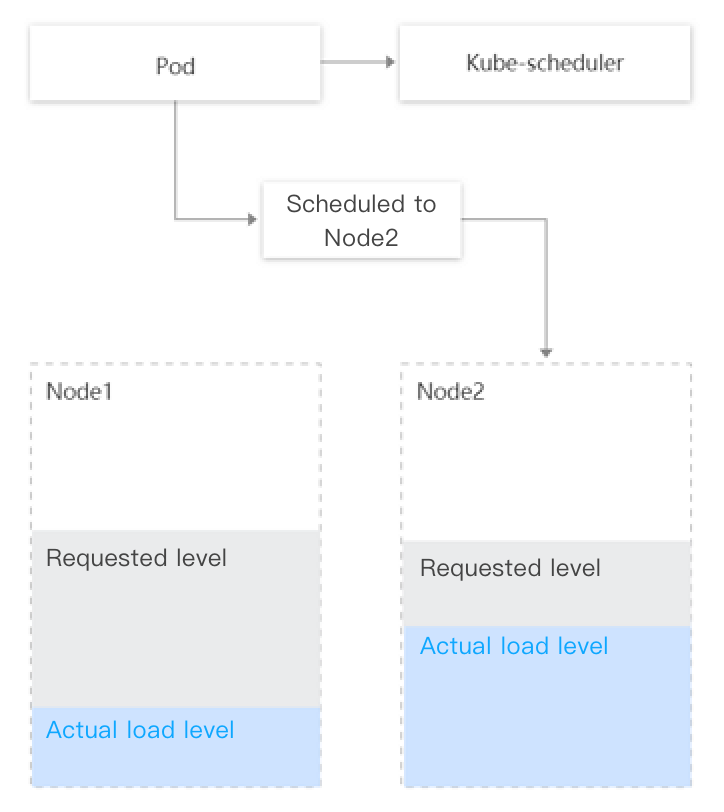
Most of Kubernetes' native schedulers rely on Pod request resources for scheduling, which means that they cannot make decisions based on the actual node loads in the current and past periods of time and may cause the following problems:
A large number of remaining resources on some nodes of the cluster can be scheduled (value calculated based on the request and limit values of the running Pods on the nodes), but the actual loads are high; on other nodes, a small number of remaining resources can be scheduled, but the actual loads are low. In this case, the kube-scheduler will preferentially schedule Pods to nodes with more remaining resources (based on the LeastRequestedPriority policy).
The kube-scheduler will schedule the Pod to node 2, despite the fact that node 1 with a lower actual load level is a better choice.
Avoiding scheduling hotspots
To avoid continuing to schedule Pods from low-load nodes, the Dynamic Scheduler supports a policy to avoid scheduling hotspots, that is, to collect the number of Pods scheduled in the past few minutes and lower the node's score during preferential selection.
The current policy is as follows:
If more than two Pods are scheduled to the node in the past minute, the node's score for preferential selection is decreased by 1.
If more than five Pods are scheduled to the node in the past five minutes, the node's score for preferential selection is decreased by 1.
Risk Control
This add-on has been interconnected to TKE's monitoring and alarming system.
We recommend you enable event persistence for the cluster to better monitor the add-on for exceptions and locate the problems.
Uninstalling the add-on will only delete the scheduling logic of the Dynamic Scheduler and will not affect the scheduling feature of the native kube-scheduler.
Limits
The TKE is on v1.10.x or later.
If you need to upgrade the Kubernetes master version:
For a managed cluster, you don't need to set the add-on again.
For a self-deployed cluster, master version upgrade will reset the configurations of all the add-ons in the master, which affects the configuration of the Dynamic Scheduler add-on as a scheduler extender. Therefore, you need to uninstall the Dynamic Scheduler and install it again.
How It Works
The Dynamic Scheduler is based on the scheduler extender mechanism to get the node load from the Prometheus data. It adopts a scheduling policy based on the actual node load and performs intervention during pre-selection and preferential selection, so that Pods are preferentially scheduled to low-load nodes. This add-on consists of node-annotator and the dynamic scheduler.
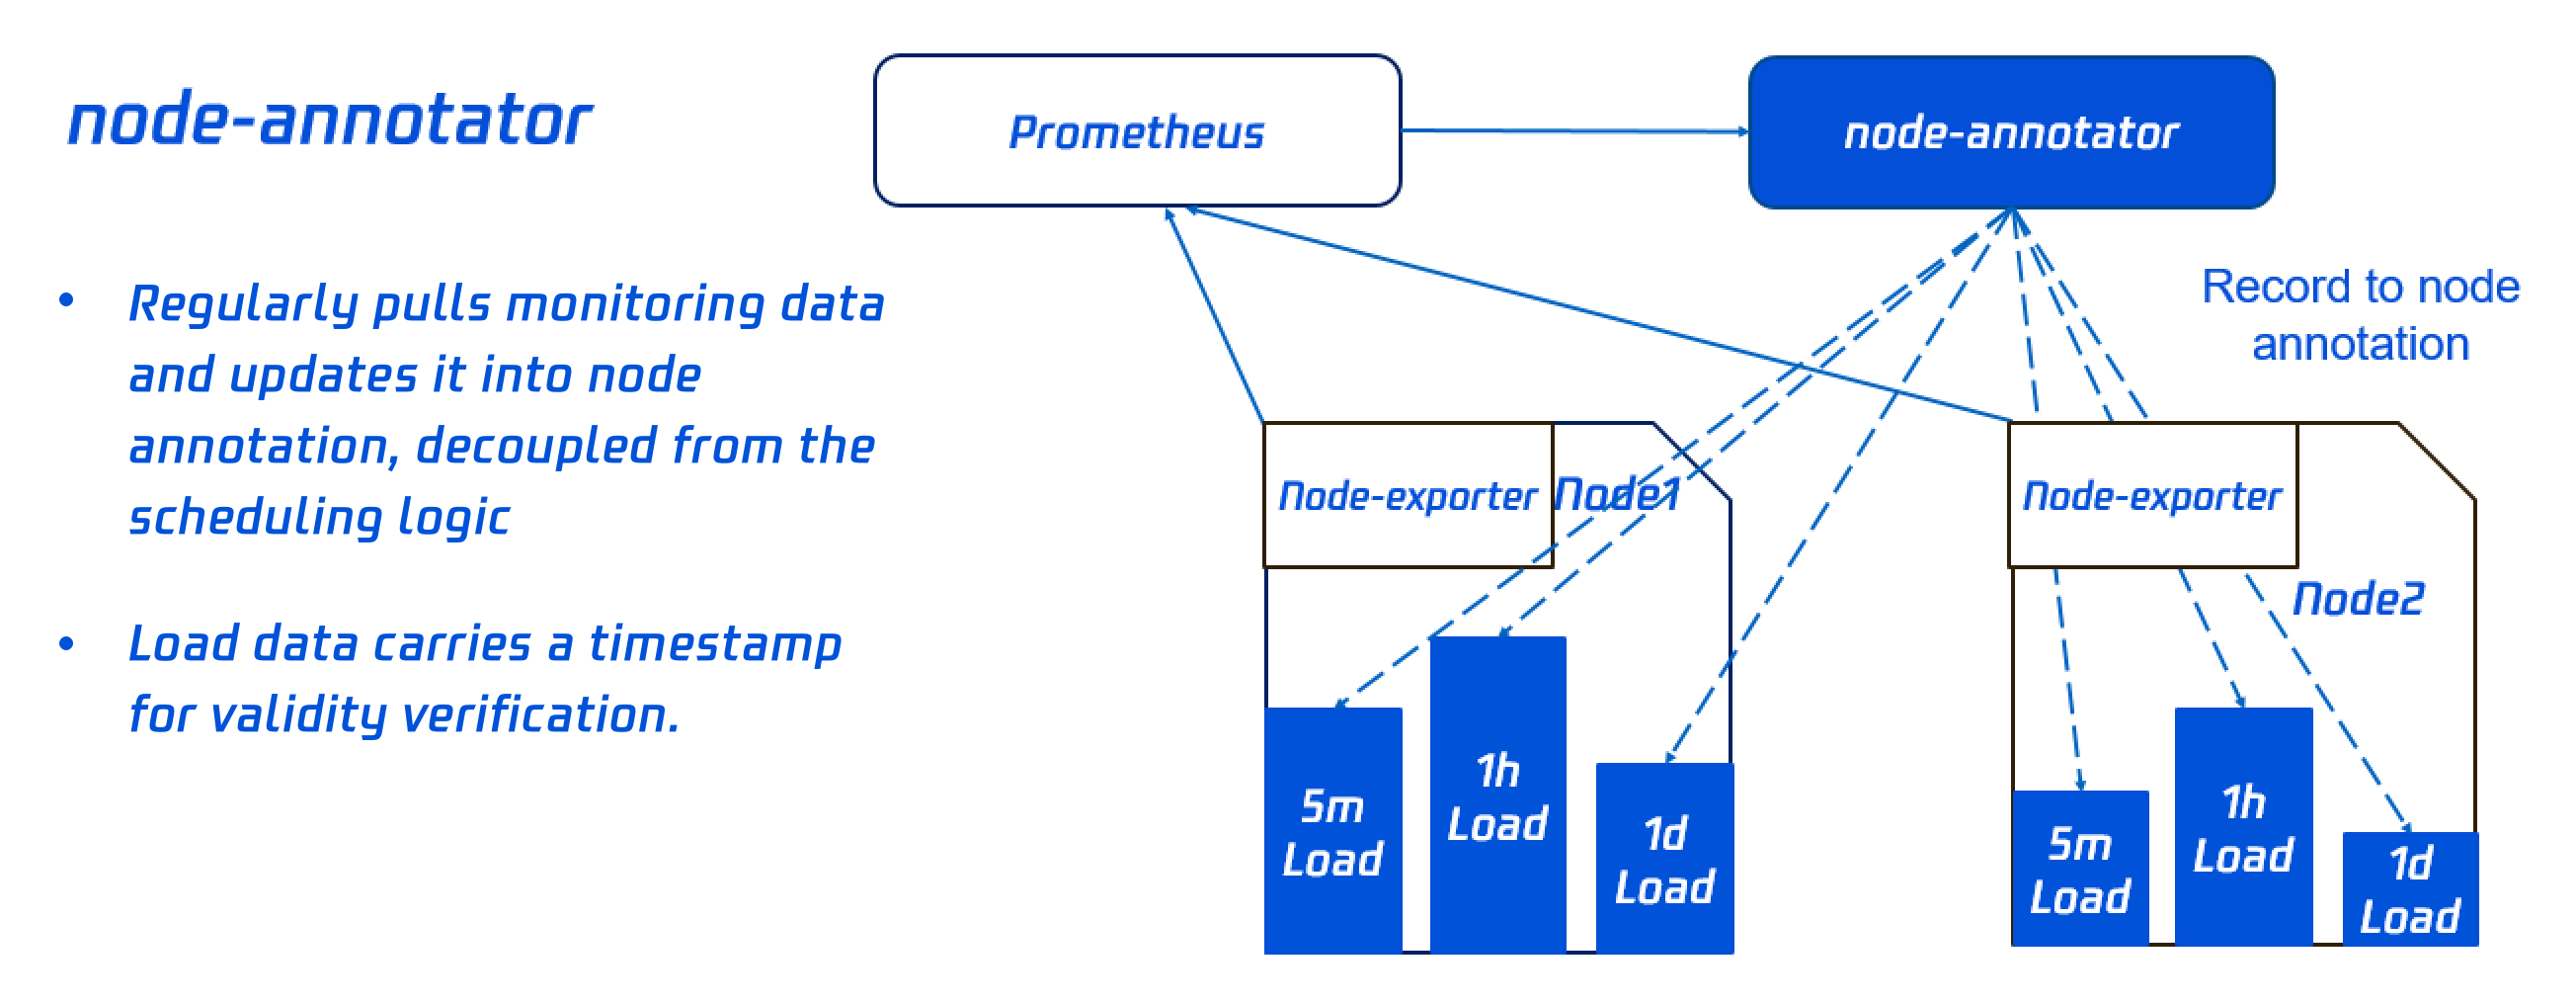
node-annotator
node-annotator is responsible for regularly pulling the metrics of the node load from the monitoring data and sync them to the annotation of the node.
Note:
After the add-on is deleted, the annotation generated by node-annotator will not be cleared automatically and needs to be cleared manually.
Dynamic scheduler
The dynamic scheduler is a scheduler extender that filters and scores the nodes during pre-selection and preferential selection based on the load data of the node annotation.
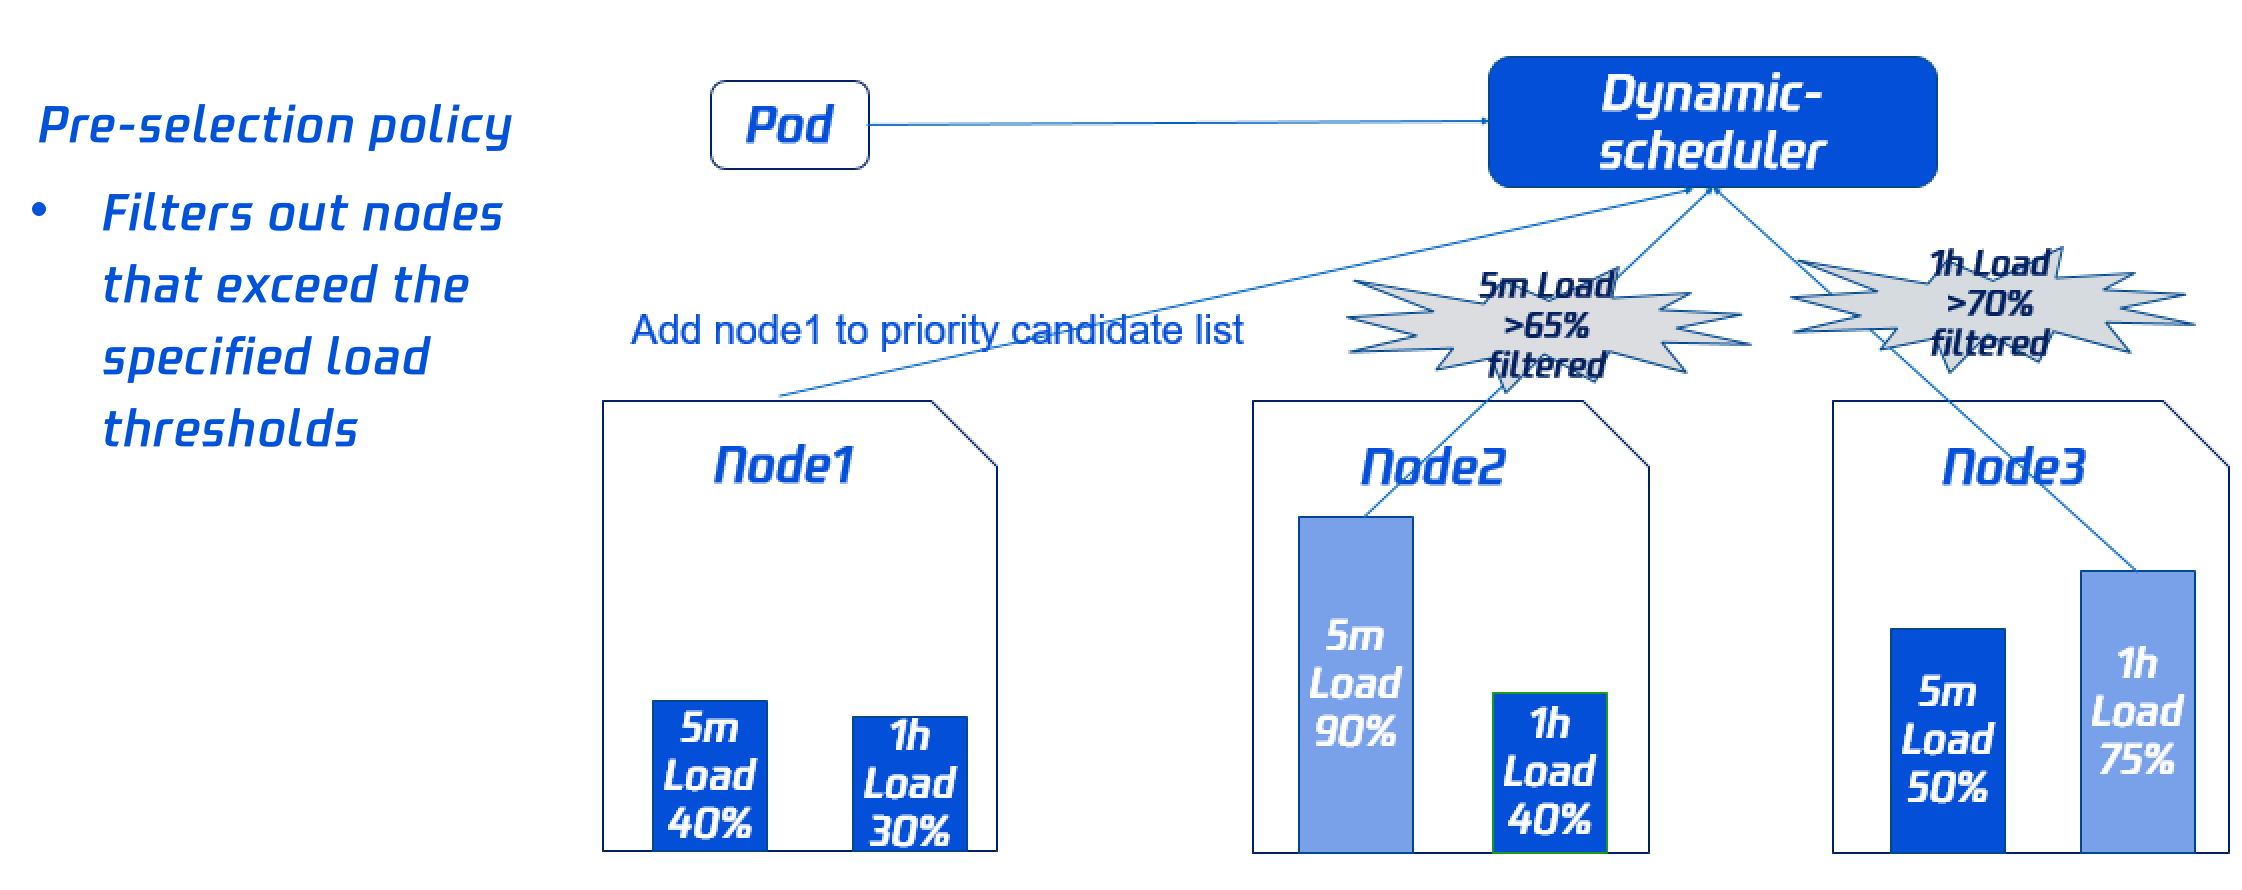
Pre-selection policy
To avoid scheduling Pods to high-load nodes, you need to filter out some high-load nodes during pre-selection. You can dynamically configure the filter policy and ratio as instructed in Add-On Parameter Description.
As both node 2's load in the past five minutes and node 3's load in the past hour exceed the threshold, they will not be included in preferential selection.
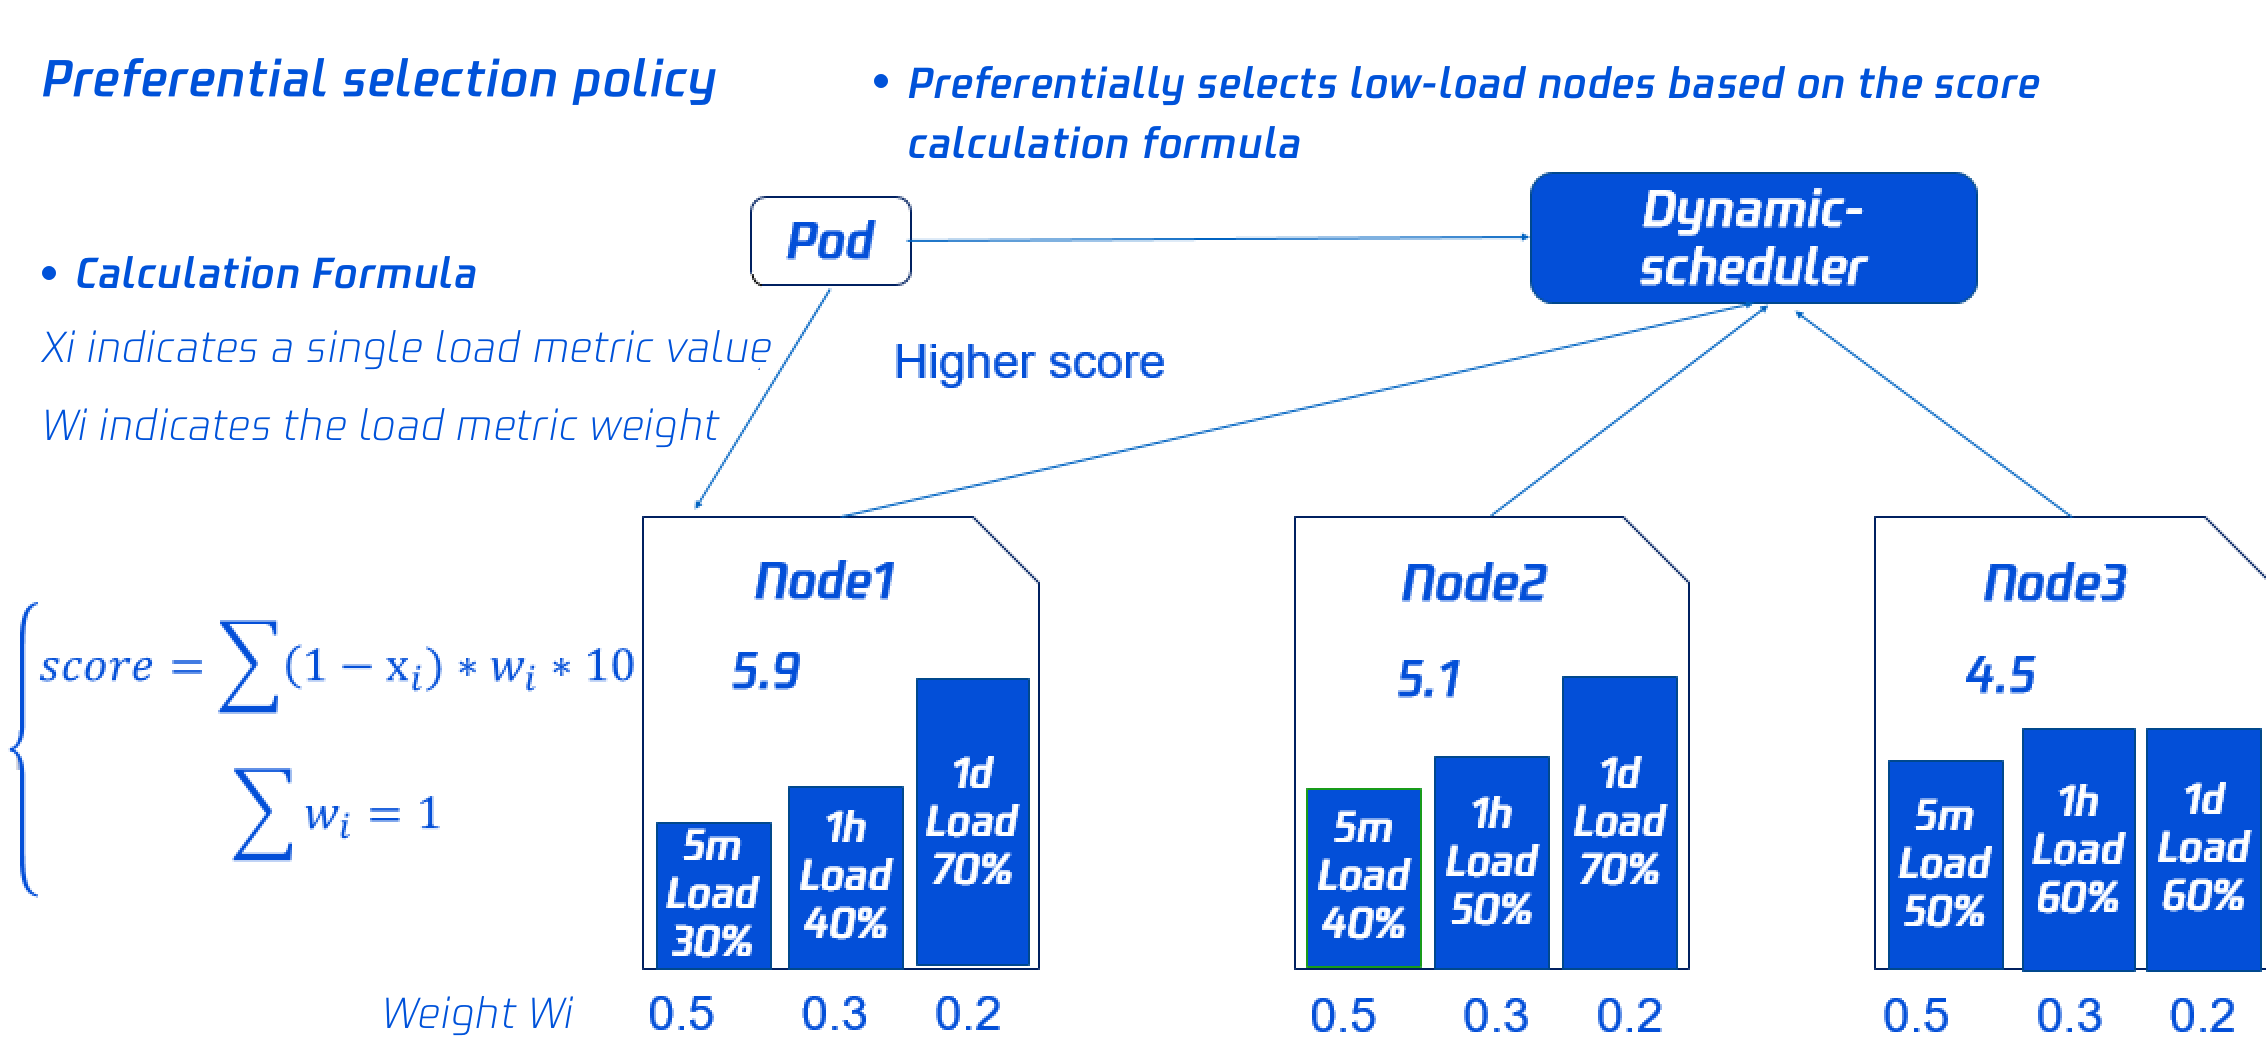
Preferential selection policy
To balance the loads on each node in the cluster, the dynamic scheduler will score the nodes based on their load data. The lower the load, the higher the score.
Node 1 with the highest score will be preferentially selected for scheduling. You can dynamically configure the scoring policy and weights as instructed in Add-On Parameter Description.
Add-On Parameter Description
Prometheus data query address
Note:
To ensure that the required monitoring data can be pulled by the add-on and the scheduling policy can take effect, follow the Configuring the Prometheus rule step in Deploying dependencies to configure the monitoring data collection rules.
Default values have been set for the pre-selection and preferential selection parameters. If you have no special requirements, you can directly use them.
If you use the self-built Prometheus service, just enter the data query URL (HTTPS/HTTPS).
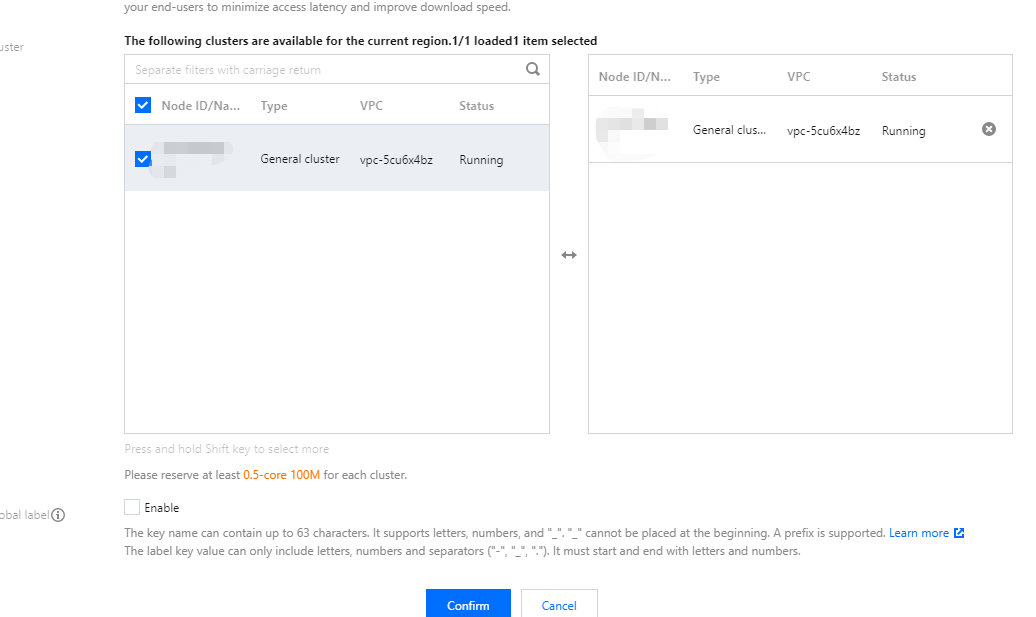
If you use the managed Prometheus service, just select the managed instance ID, and the system will automatically parse the data query URL of the instance.
Pre-selection parameters
Default Value of the Pre-selection Parameter
Description
Average CPU utilization threshold in five minutes
If the average CPU utilization of the node in the past five minutes exceeds the configured threshold, no Pods will be scheduled to the node.
Maximum CPU utilization threshold in an hour
If the maximum CPU utilization of the node in the past hour exceeds the configured threshold, no Pods will be scheduled to the node.
Average memory utilization threshold in five minutes
If the average memory utilization of the node in the past five minutes exceeds the configured threshold, no Pods will be scheduled to the node.
Maximum memory utilization threshold in an hour
If the maximum memory utilization of the node in the past hour exceeds the configured threshold, no Pods will be scheduled to the node.
Preferential selection parameters
Default Value of the Preferential Selection Parameter
Description
Average CPU utilization weight in five minutes
The greater the weight, the bigger impact the average CPU utilization in the past five minutes has on the node score.
Maximum CPU utilization weight in an hour
The greater the weight, the bigger impact the maximum CPU utilization in the past hour has on the node score.
Maximum CPU utilization weight in a day
The greater the weight, the bigger impact the maximum CPU utilization in the past day has on the node score.
Average memory utilization weight in five minutes
The greater the weight, the bigger impact the average memory utilization in the past five minutes has on the node score.
Maximum memory utilization weight in an hour
The greater the weight, the bigger impact the maximum memory utilization in the past hour has on the node score.
Maximum memory utilization weight in a day
The greater the weight, the bigger impact the maximum memory utilization in the past day has on the node score.
Directions
Deploying dependencies
The Dynamic Scheduler relies on the actual node loads in the current and past periods of time to make scheduling decisions. It needs to get the information of the actual node loads of the system through the Prometheus add-on. Before using the Dynamic Scheduler, you need to deploy the Prometheus add-on. In the TKE, you can use the self-built Prometheus monitoring service or the cloud native monitoring service.
Self-built Prometheus monitoring service
Prometheus monitoring service
Deploying the Node Exporter and Prometheus
You can deploy the Node Exporter and Prometheus as needed to monitor node metrics through the Node Exporter.
Configuring aggregation rules
After getting the node monitoring data from the Node Exporter, you need to aggregate and calculate the data collected in the native Node Exporter through Prometheus. To get metrics such as cpu_usage_avg_5m, cpu_usage_max_avg_1h, cpu_usage_max_avg_1d, mem_usage_avg_5m, mem_usage_max _avg_1h, and mem_usage_max_avg_1d required by the Dynamic Scheduler, you need to configure rules in Prometheus as follows:
apiVersion: monitoring.coreos.com/v1
kind: PrometheusRule
metadata:
name: example-record
spec:
groups:
-name: cpu_mem_usage_active
interval: 30s
rules:
-record: cpu_usage_active
expr: 100 - (avg by (instance) (irate(node_cpu_seconds_total{mode="idle"}[30s])) * 100)
1. The above section defines the rules to calculate the metrics required by the Dynamic Scheduler. You need to configure the rules to Prometheus as a general Prometheus configuration file. Below is a sample:
global:
evaluation_interval: 30s
scrape_interval: 30s
external_labels:
rule_files:
- /etc/prometheus/rules/*.yml# /etc/prometheus/rules/*.ymlis the defined rules file.
2. Copy the rules configurations to a file (such as dynamic-scheduler.yaml) and put the file under /etc/prometheus/rules/ of the above Prometheus container.
3. Load the Prometheus server to get the metrics required by the Dynamic Scheduler from Prometheus.
Note:
In general, the above Prometheus configuration file and rules configuration file are stored via a ConfigMap before being mounted to a Prometheus server's container. Therefore, you only need to modify the ConfigMap.