Linuxインスタンスでのatop監視ツールの使用
ダウンロード
フォーカスモード
フォントサイズ
概要
atopはLinuxシステムのリソースとプロセスの監視に用いられるツールのひとつであり、一定の頻度でシステムの実行状態を記録し、システムのリソース(CPU、メモリ、ディスクおよびネットワーク)の使用状況およびプロセス実行状況データを収集するとともに、ログファイルの形式でディスク内に保存します。インスタンスに問題が生じた際に、対応するatopログファイルを取得して分析に用いることができます。
ここでは、OSがCentOS 7.9のCVMを例にとり、atopモニタリングツールの使用方法についてご紹介します。
操作手順
atopのインストール
2. 以下のコマンドを実行し、atopをインストールします。
yuminstallatop -y
画面に
Complete!というメッセージが表示された場合は、インストールが成功したことを表します。atopの設定と起動
以下の手順を参照し、atopのモニタリング間隔とログ保存期間を設定します。
1. 以下のコマンドを実行し、VIMエディタを使用してatop設定ファイルを開きます。
vim /etc/sysconfig/atop
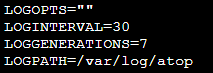
2. iを押して編集モードに入り、以下の設定を変更します。
LOGINTERVAL=600をLOGINTERVAL=30に変更することは、デフォルトのモニタリング間隔である600sを30sに変更することを表します。30sへの変更をお勧めしますが、実際の状況に応じて変更することが可能です。LOGGENERATIONS=28をLOGGENERATIONS=7に変更することは、デフォルトのログ保存期間である28日間を7日間に変更することを表します。atopを長時間実行するとディスク容量を多く占有してしまうため、7日間への変更をお勧めしますが、実際の状況に応じて変更することが可能です。
変更が完了すると以下のようになります。
3. Escを押して:wqを入力し、変更を保存してからエディタを終了します。
4. CentOS 7およびそれ以降のバージョンでは、以下のコマンドを実行してatopを起動することができます。
systemctl restart atop
atopの分析
atopの起動後、収集されたデータは
/var/log/atopディレクトリのログファイル内に記録されます。実際のログファイル名を取得し、以下のコマンドを実行してログファイルを確認するとともに、atopでよく使用するコマンド および システムリソースモニタリングフィールドの説明 を参照して分析を行ってください。atop -r /var/log/atop/atop_2021xxxx
atopでよく使用するコマンド
ログファイルを開いた後、以下のコマンドを使用して必要なデータをフィルタリングできます。
c:プロセスのCPU使用率に応じて降順でフィルタリングします。
m:プロセスのメモリ使用率に応じて降順でフィルタリングします。
d:プロセスのディスク使用率に応じて降順でフィルタリングします。
a:プロセスのリソース全体使用率に応じて降順でフィルタリングを行います。
n:プロセスのネットワーク使用率に応じて降順でフィルタリングを行います(このコマンドを使用するには別途カーネルモジュールのインストールが必要なため、デフォルトではサポートしていません)。
t:次のモニタリングポイントにジャンプします。
T:ひとつ前のモニタリングポイントにジャンプします。
b:時間を指定します。形式はYYYYMMDDhhmmです。
システムリソースモニタリングフィールドの説明
下の図は一部のモニタリングフィールドおよび数値です。数値はサンプリング間隔に基づいて取得したもので、参考用です。
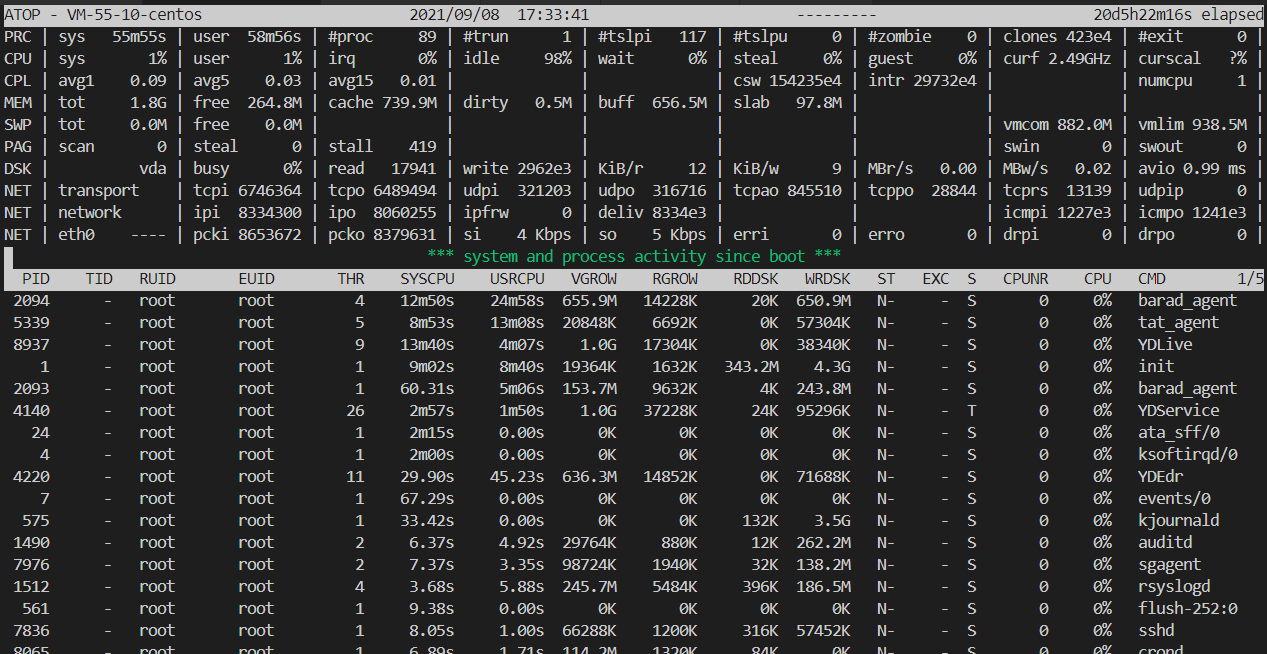
ATOP行:ホスト名、情報サンプリング日および時間。
PRC行:プロセス全体の実行状況。
sysおよびuser:CPUがプロセスの処理に使用された際、プロセスがカーネルステータスおよびユーザーステータスにおいてCPUを占有した時間の比率。
#proc:プロセスの総数。
#zombie:ゾンビプロセスの数。
#exit:Atopのサンプリング間隔の間に終了したプロセスの数。
CPU行:CPU全体(マルチコアCPUを1つのCPUリソースとする)の使用状況。CPU行の各フィールドの数値を合計した結果はN00%となります。NはCPUコアの数です。
sysおよびuser:CPUがプロセスの処理に使用された際、プロセスがカーネルステータスおよびユーザーステータスにおいてCPUを占有した時間の比率。
irq:CPUが処理の中断に使用された時間の比率。
idle:CPUが完全にアイドル状態にあった時間の比率。
wait:CPUが「プロセスのディスクIO待機によりアイドル状態となった」時間の比率。
CPL行:CPU負荷状況。
avg1、avg5およびavg15:過去1分、5分および15分における実行キュー内の平均プロセス数。
csw:コンテキストスイッチの回数。
intr:中断発生の回数。
MEM行:メモリの使用状況。
tot:物理メモリの総量。
cache :ページキャッシュに使用されているメモリサイズ。
buff:ファイルキャッシュに使用されているメモリサイズ。
slab:システムカーネルが占有するメモリサイズ。
SWP行:スワップ領域の使用状況。
tot:スワップエリアの総量。
free:スワップ領域の空き容量。
PAG行:仮想メモリのページング状況
swinおよびswout:スワップインおよびスワップアウトされたメモリページ数。
DSK行:ディスク使用状況。各ディスクデバイスがそれぞれ1列に対応します。sdbデバイスがあれば、DSK情報を1行追加します。
sda:ディスクデバイスのラベル。
busy:ディスクがビジーだった時間の比率。
readおよびwrite:読み取り、書き込みのリクエスト数。
NET行:複数列のNETでネットワークの状況を表示します。これにはトランスポート層(TCPおよびUDP)、IP層および動作中の各ネットワークポート情報が含まれます。
xxxxxi:各層または動作中のネットワークポートの受信パケット数。
xxxxxo:各層または動作中のネットワークポートの送信パケット数。
atopの停止
業務環境下でatopを長時間実行することはお勧めしません。問題の原因調査が完了すればatopを停止することができます。CentOS 7およびそれ以降のバージョンでは、以下のコマンドを実行してatopを停止することができます。
systemctl stop atop
フィードバック