Setting Log Retrieval
Download
Focus Mode
Font Size
Overview
Log retrieval is also known as the real-time log function. Cloud Object Storage (COS) provides this function to record various bucket-related request logs and retrieve and analyze log data in real time. You can quickly enable this function for buckets in the COS console to retrace exceptional events and locate faults.
Note
To enable the real-time log function for a COS bucket, enable Cloud Log Service.
When using the real-time log query function, you are charged by Cloud Log Service (CLS). For details about billing standards, see Billing Overview.
Currently, the log retrieval function of COS is available in the regions, including Beijing, Guangzhou, Shanghai, Chengdu, Nanjing, Chongqing, Hong Kong (China), Silicon Valley, Singapore, Mumbai, Frankfurt, Toronto, Shenzhen Finance, and Shanghai Finance. This function will be available in more regions. Please stay tuned for product updates.
COS does not ensure the accuracy of log data. Log data is for reference only and cannot be used as a basis for measurement and billing.
Directions
Activating Log Retrieval
1. Log in to the COS console.
2. On the left sidebar, click Bucket List to go to the bucket list page.
3. Locate the bucket for which you want to activate log retrieval, and click the bucket name to go to the management page.
4. In the left sidebar, choose Logging > Log Retrieval.
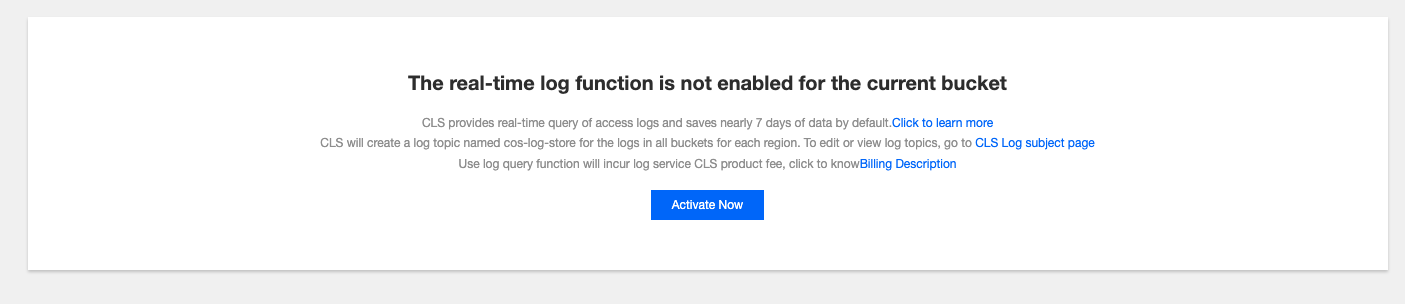
5. On the Log Retrieval page, if the real-time log function is not enabled for the current bucket, click Activate Now.
Note:
After the function is enabled, access logs of this bucket will be shipped to the log topic named cos-log-store in the same region of CLS. Authorization is required for the initial activation.
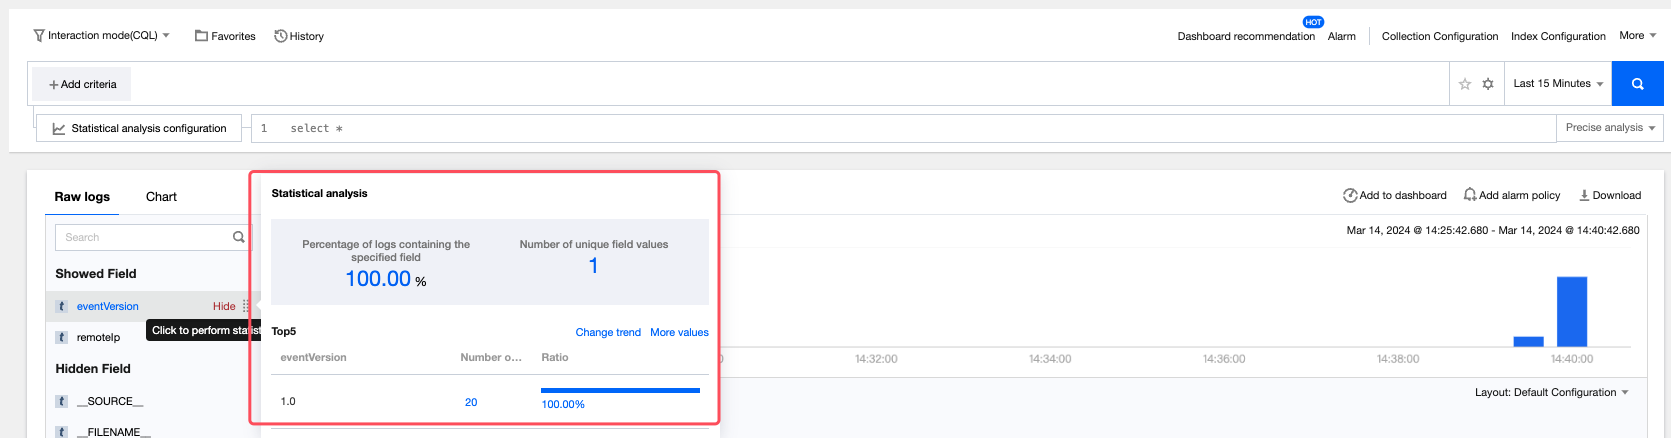
Activating Field-Based Statistical Analysis
Log retrieval enables you to perform quick statistical analysis based on fields without the need to enter query statements. For default supported fields, see Log Fields. For more information, see Quick Analysis.
Note:
If you want to perform statistical analysis on logs based on a specific field, enable statistics for that field in the following two ways.
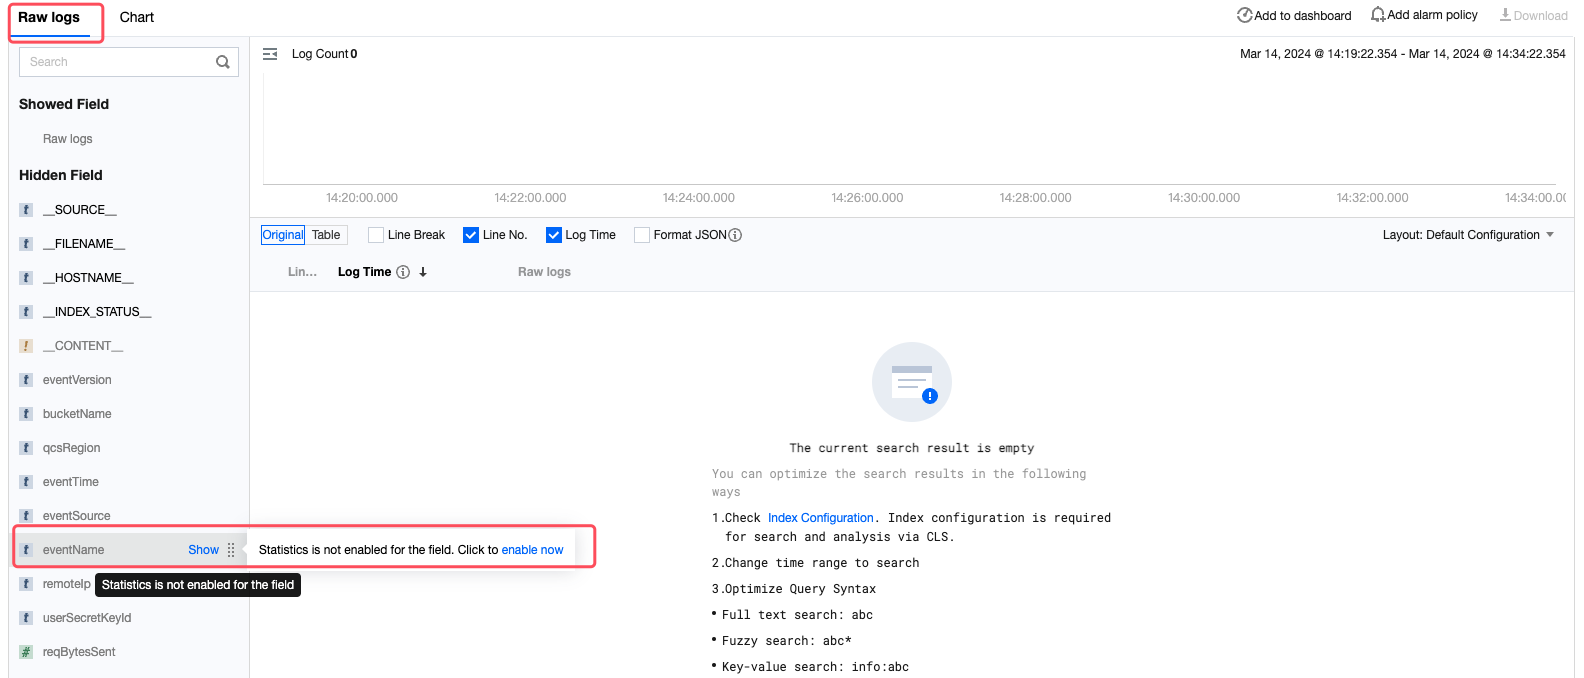
Method 1: Enable Statistics on the Raw Logs Tab Page
1. Go to the Raw logs tab page.
2. Locate the target field and click enable now.
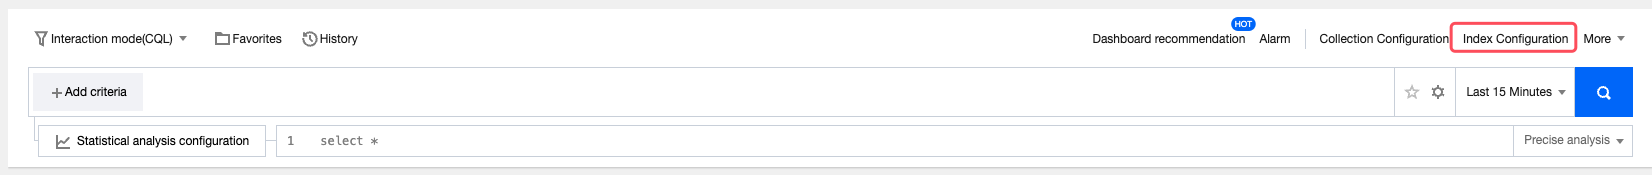
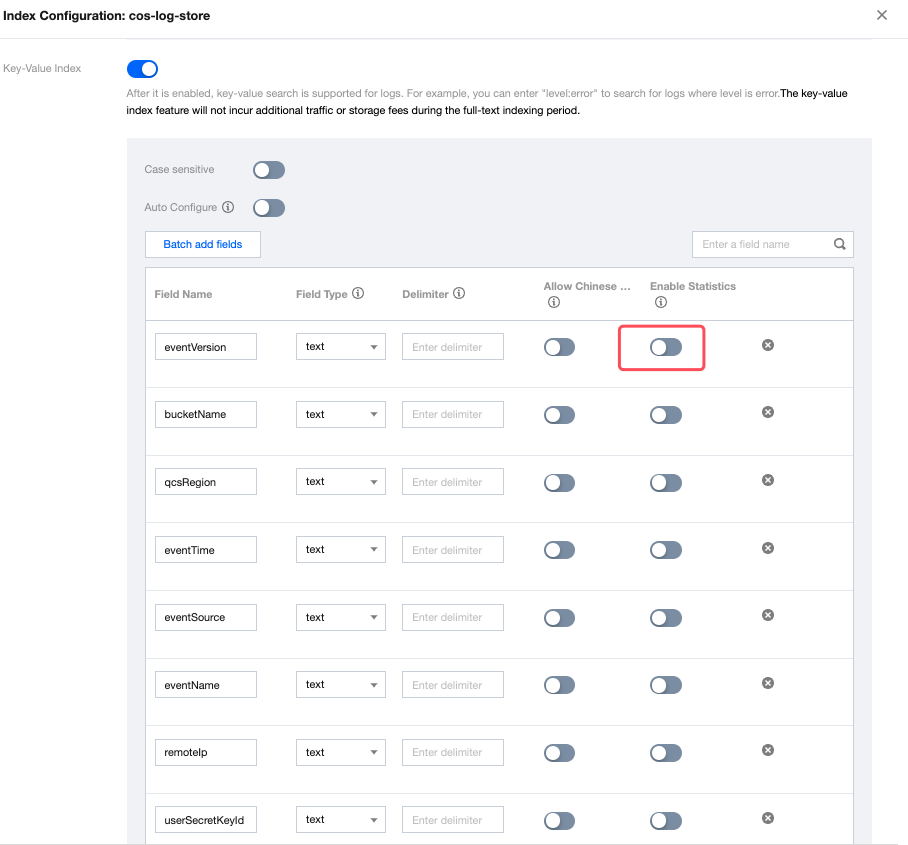
Method 2: Enable Statistics on the Index Configuration Page
1. Click Index Configuration to go to the index configuration page.
2. On the index configuration page, click Edit in the upper right corner, locate the target field, turn on the switch in Enable Statistics column, confirm the information, and click OK.
3. On the page that appears, view statistical analysis of the field. Click a number to automatically generate the corresponding retrieval and analysis statements and chart.
Entering Retrieval and Analysis Statements
Note:
Index Configuration is a necessary condition for retrieval and analysis with CLS. You can perform retrieval and analysis on log data only when the index configuration function is enabled. Index configuration is complex, so it's recommended that you use the suggested configurations in Modifying index configuration to fulfill most use cases. For more information, see Configuring Indexes.
For the prerequisites and user guide of retrieval and analysis statements, see Syntax and Rules. For analysis methods of bucket access logs, see COS Access Log Analysis.
A retrieval and analysis statement consists of Criteria and SQL statements. Enter the retrieval and analysis statement to retrieve and statistically analyze access logs.
Criteria: Specify the conditions that the logs need to match, so that logs that meet the conditions are returned. For example, use
status:404 to retrieve application request logs with a response status code of 404. If the criteria are empty or *, all logs are displayed. For more information about syntax rules and examples, see Syntax and Rules.SQL statement: Statistically analyze logs that meet the criteria, so that the analysis results are returned. For example, use
status:404 | select count(*) as logCounts to count the number of logs with a response status code of 404. For more information about syntax usage and examples, see SQL Statement Syntax Rules.
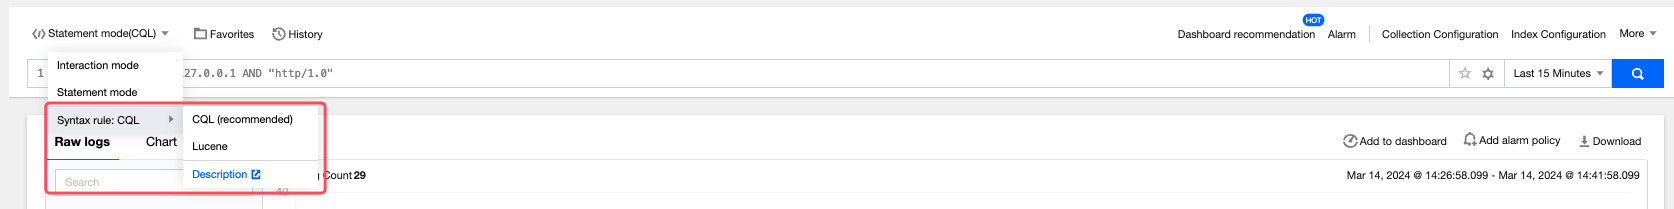
1. On the Log Retrieval page, select Interaction mode(CQL) or Statement mode(CQL) for retrieval and analysis statements.
**Interaction mode(CQL)**: In this mode, you can click specified retrieval criteria and statistical analysis rules to automatically generate retrieval and analysis statements. This mode is highly user-friendly.

**Statement mode(CQL)**: In this mode, you can directly enter retrieval and analysis statements following the syntax rules. This mode is highly flexible.

2. Click the drop-down list to switch to Syntax rule: CQL. The options are CQL (recommended) and Lucene. For more information about syntax rules and examples, see Search Condition Syntax Rules.
3. Enter the retrieval and analysis statement, select the time range, and click the Search button to retrieve the access logs reported by the bucket to CLS.
Viewing Log Retrieval and Statistical Analysis Results
After a successful retrieval, you can view the retrieval and statistical analysis results of access logs on the Log retrieval page. The results are respectively displayed on the Raw logs and Chart tab pages, which can be quickly switched. Details of the two tabs are as follows:
Raw logs: When a retrieval and analysis statement only contains criteria, you can view the logs matching the criteria on the Raw logs tab page. The logs are sorted by time in descending order.
Chart: When a retrieval and analysis statement contains SQL statements, you can view the analysis results on the Chart tab page and the logs matching the criteria on the Raw logs tab page. In this case, you can compare and analyze the statistical results and raw logs.
Raw Logs
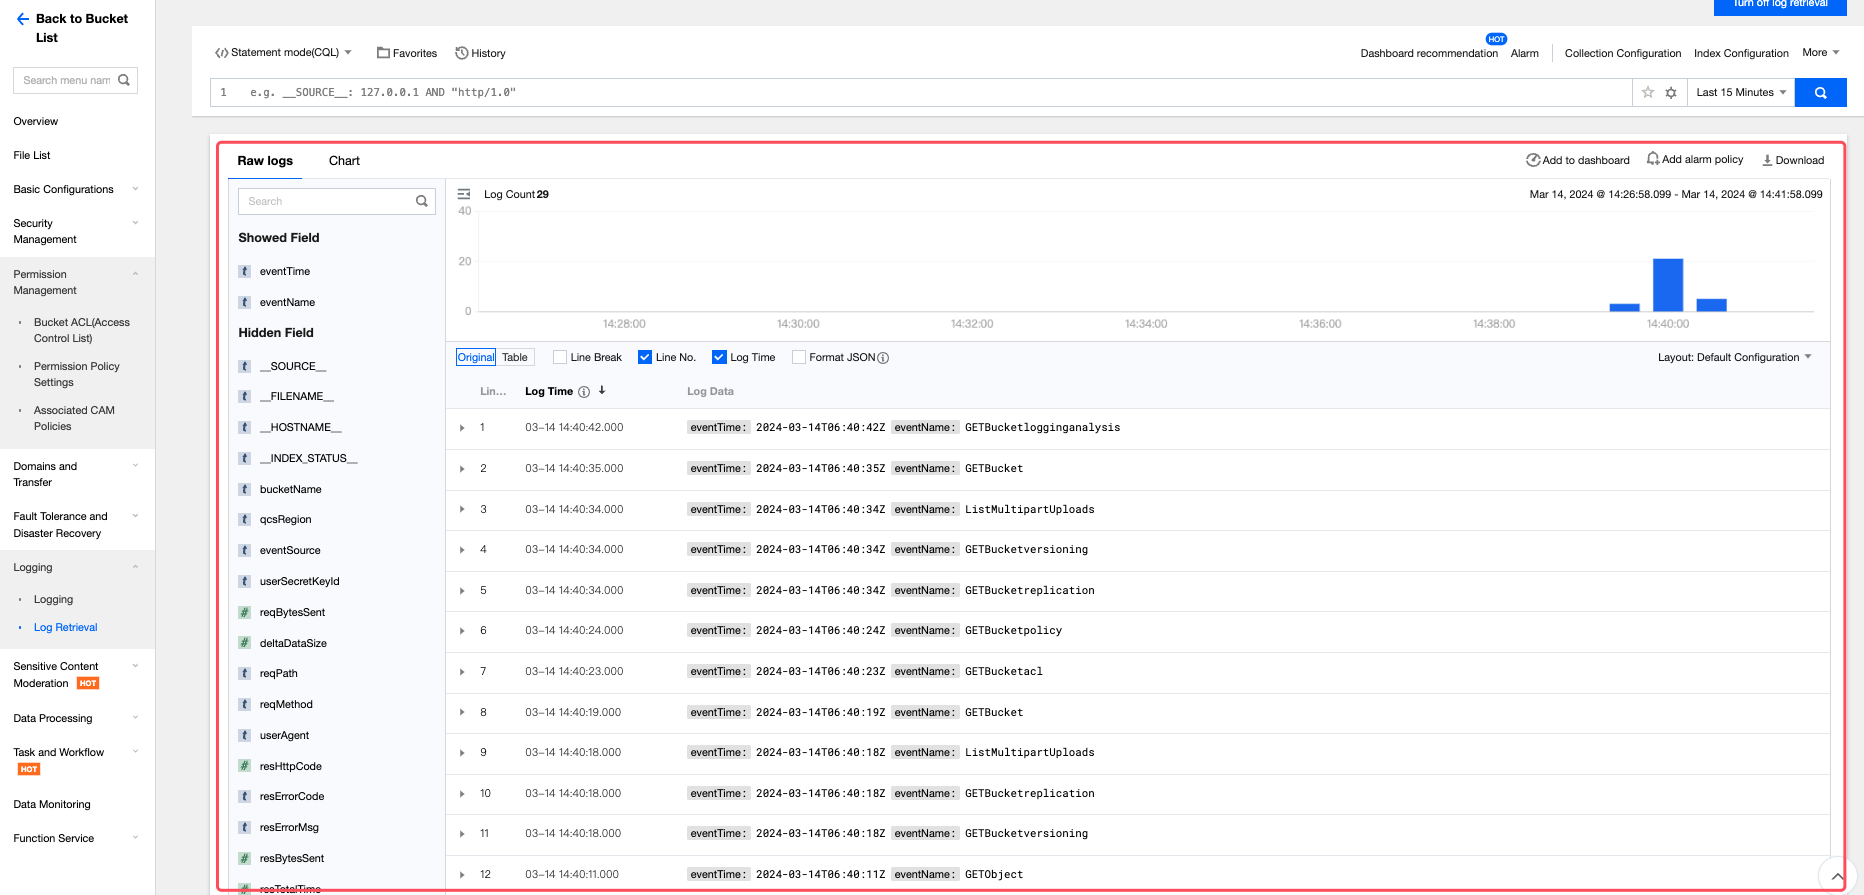
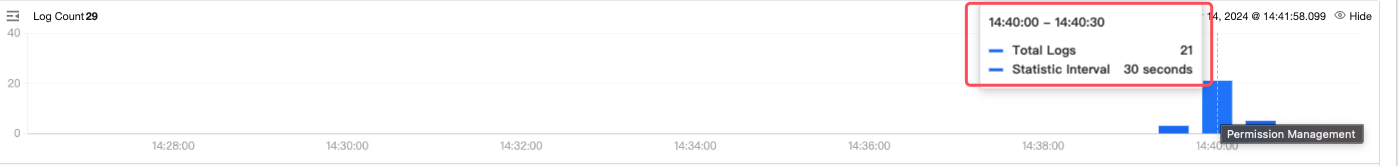
1.1 You can view the statistics information of logs within a specified time range under the current criteria in a bar chart.
1.2 By default, log data is displayed in original form. The display form can be customized.
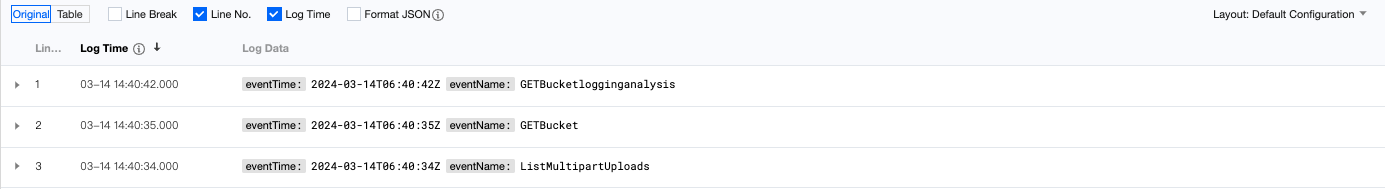
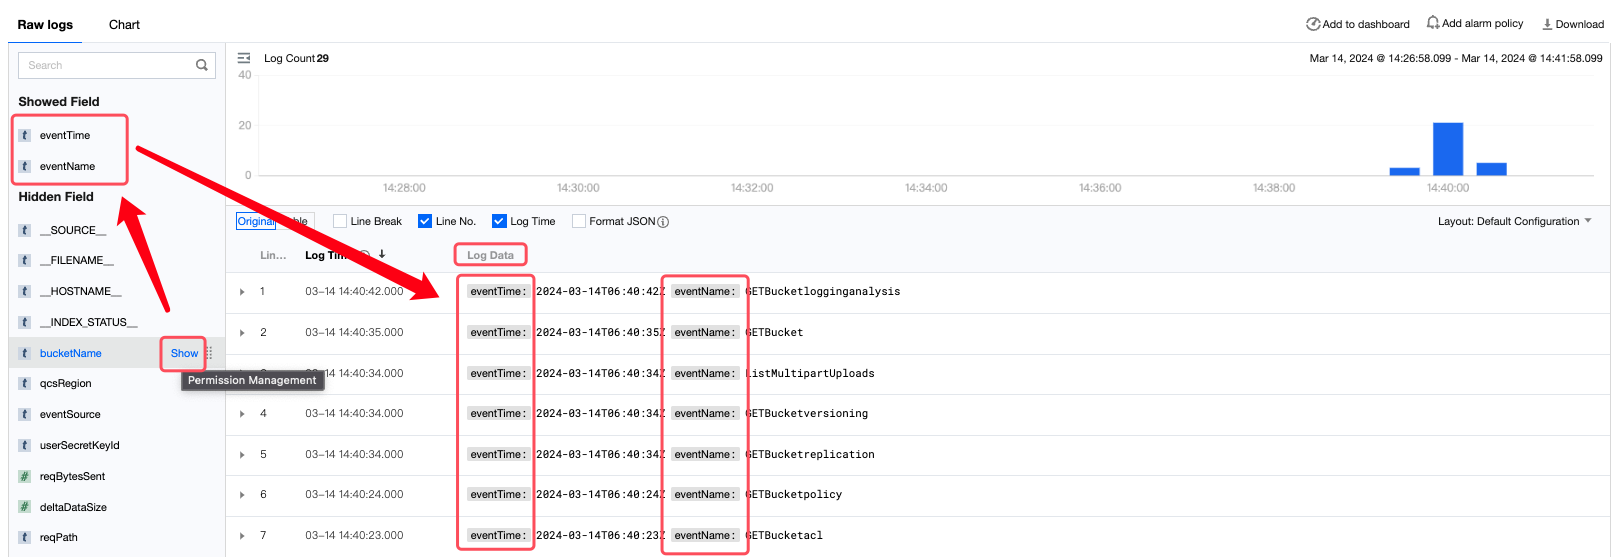
1.3 Only the fields with Show next to them are displayed in the Log Data column. You can view or hide more fields associated with logs in the following three ways:
List Operation: In the left panel on the Raw logs tab page, locate the target field and click Show or Hide to complete the configuration.
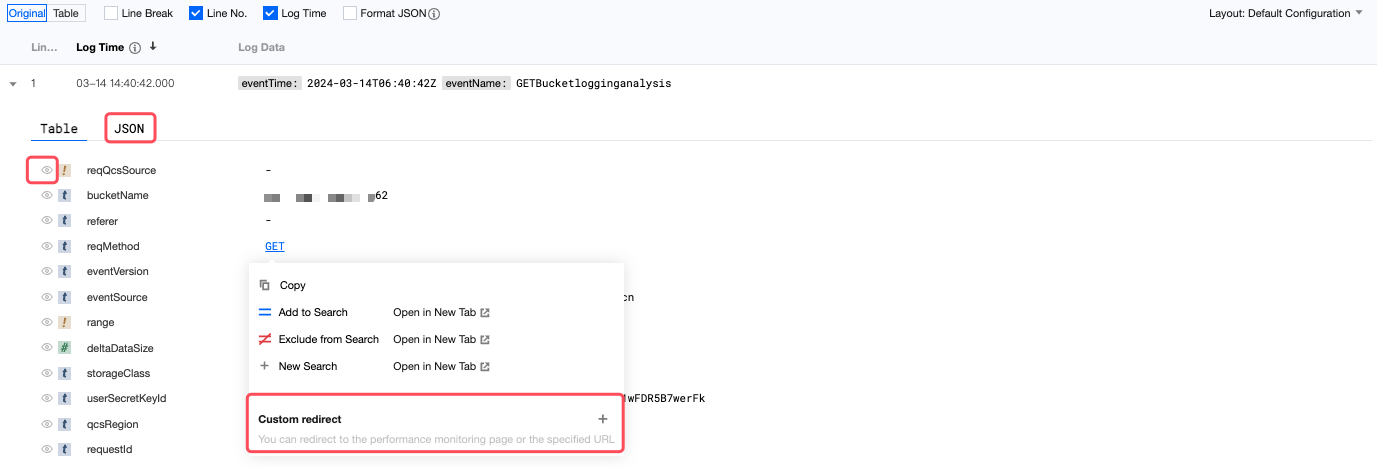
Log Details: Expand details of a log, and click the view icon to quickly hide or show a certain field. You can also view data of each log in JSON format and quickly copy the data. In addition, you can click a field value for custom redirection.
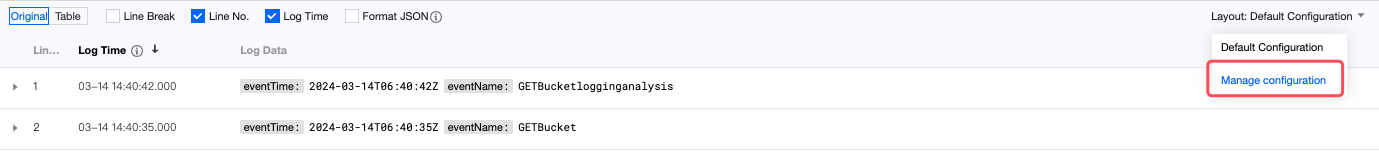
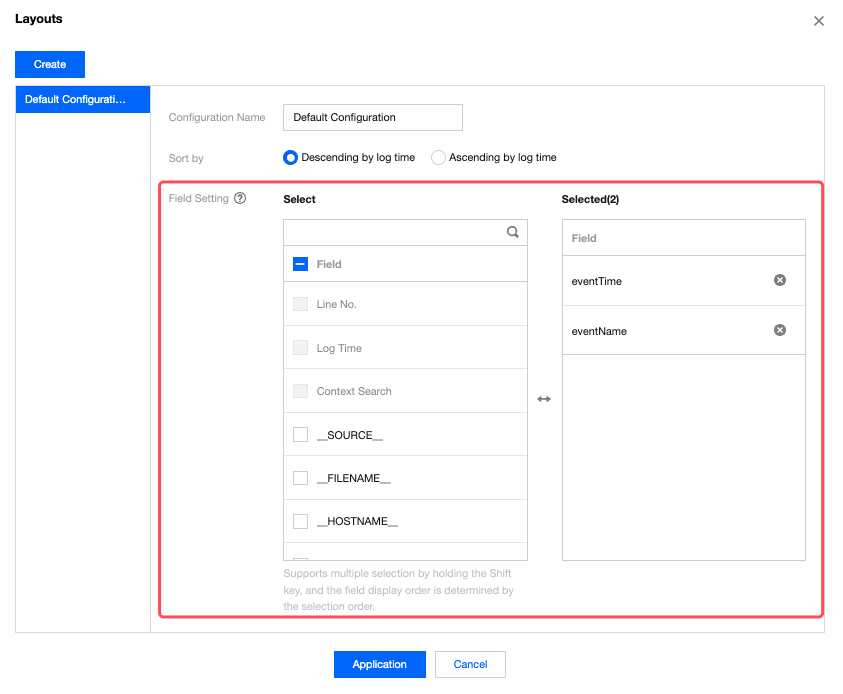
Layout: Click "Layout: Default configuration" on the right, and select Manage configuration. You can show fields in batches, and click Application to complete the configuration.
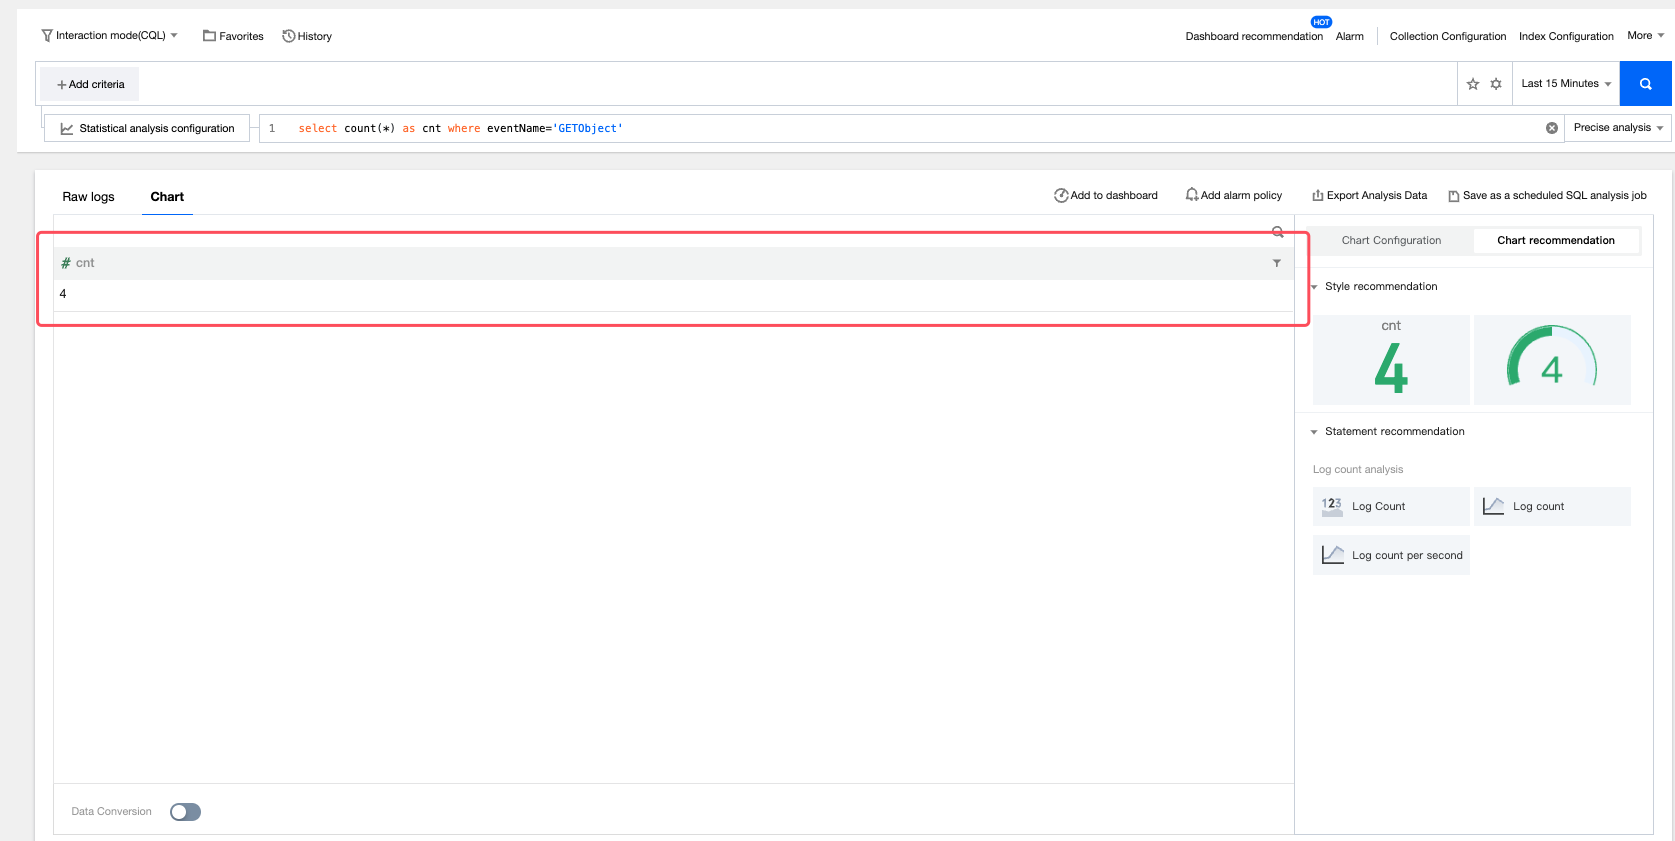
Chart
The Chart tab page shows analysis results in tables by default. You can customize the chart type and related information in Chart Configuration on the right. For further visualization and alarm configuration of bucket access logs, go to the CLS console.
Downloading Logs and Exporting Analysis Results
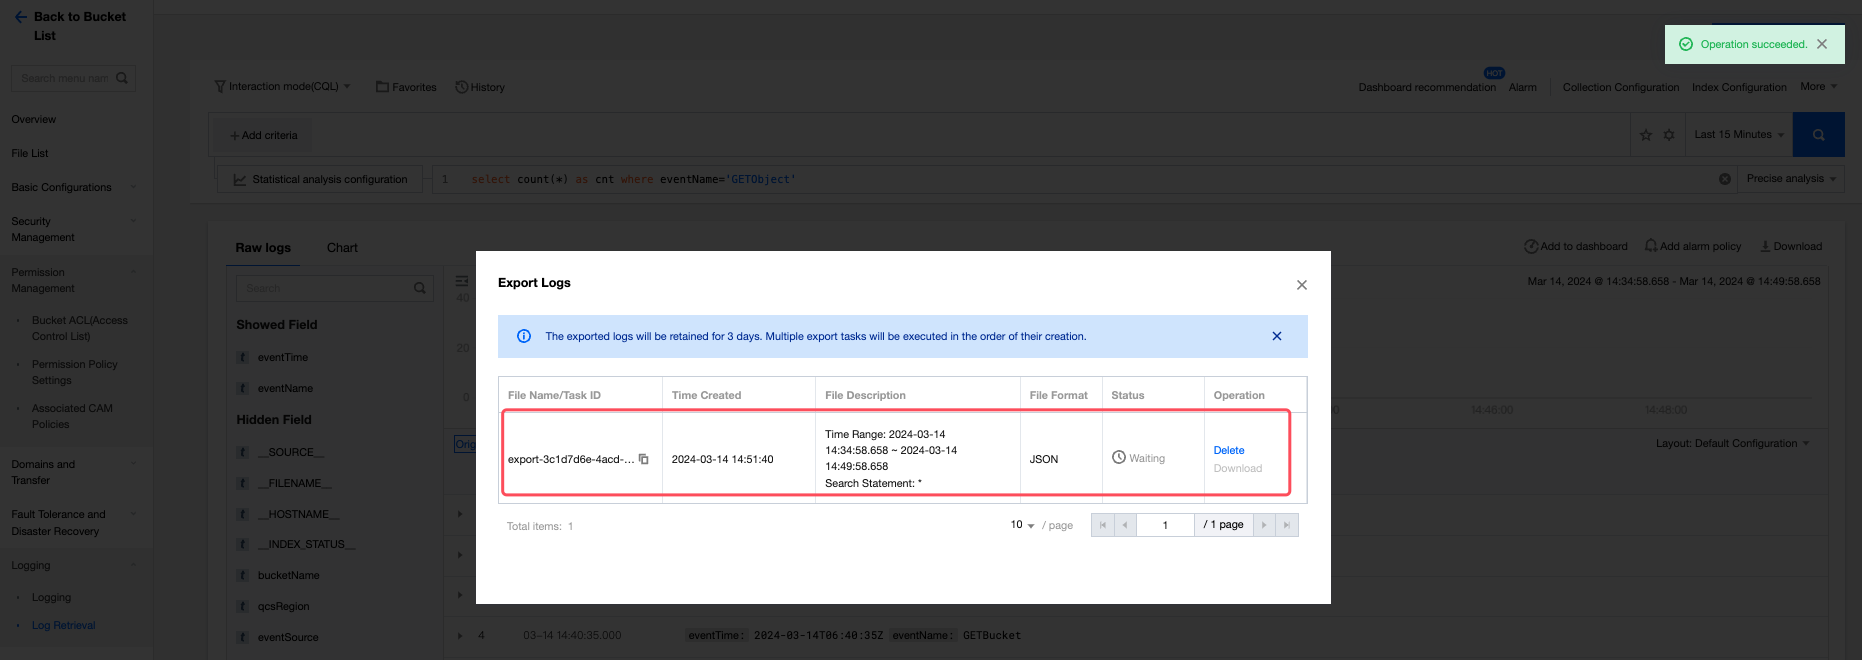
Downloads Logs
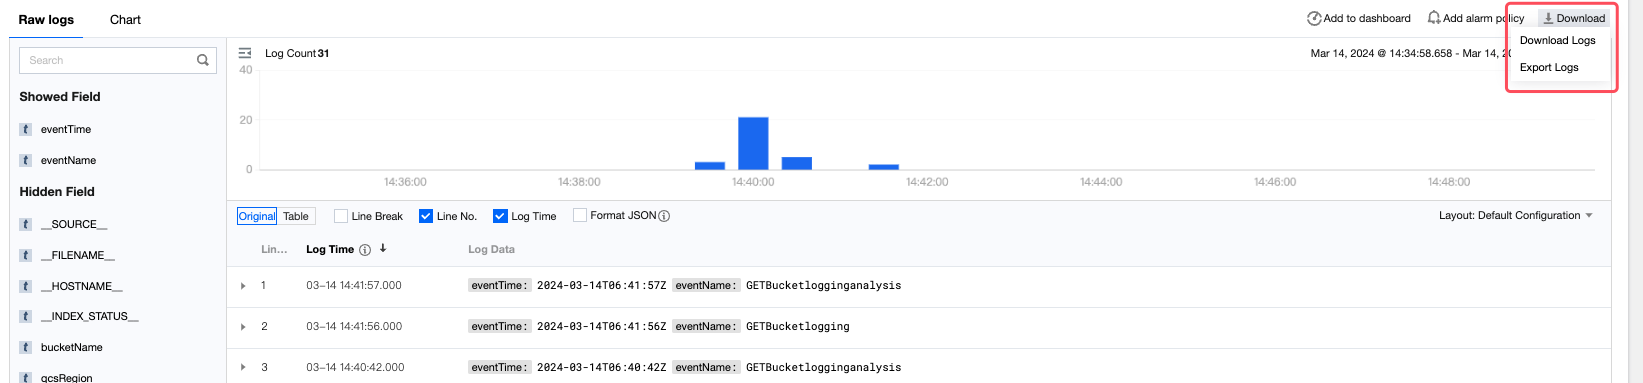
1. Click Download on the right and select Download Logs.
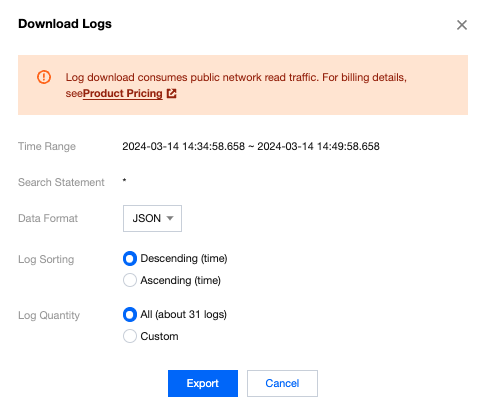
2. In the popup window, configure the information on the figure below, verify the configuration, and click Export.
3. In the Export Logs window where the new export task is displayed, view the current task progress, or delete or download the task. When the task is in the Waiting state, you can exit the window. Then you can click Download on the right and select Export Logs to enter the window again.
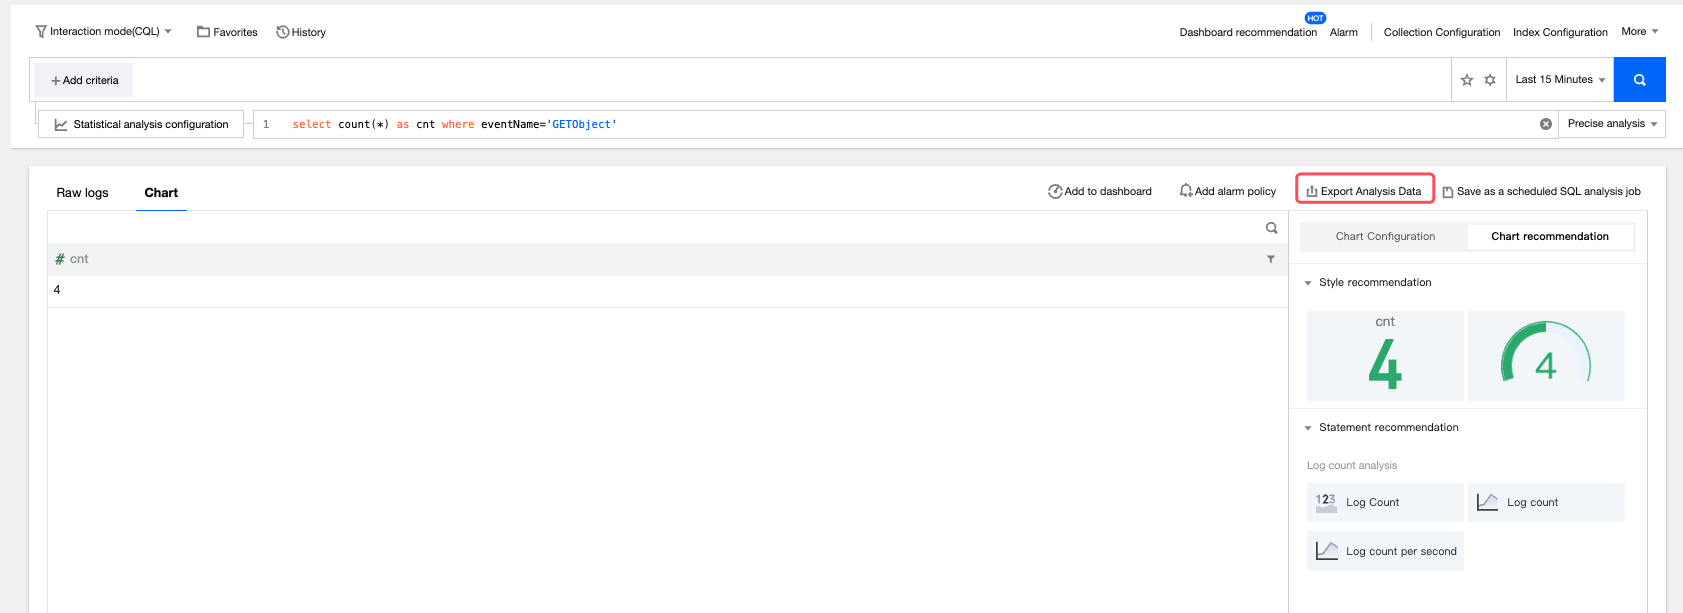
Exporting Analysis Data
Click Export Analysis Data on the right to download the analysis results to your local path.
Disabling Log Retrieval
If you do not want to use the log retrieval function for a bucket, disable the function.
Note:
Before disabling this function, go to the CLS console to check for empty log topics. If you do not delete them in time, extra charging will be incurred.
Log Field Description
Serial Number | Field Name | Description | Example |
1 | eventVersion | Record version | 1.0 |
2 | bucketName | Bucket name | examplebucket-1250000000 |
3 | qcsRegion | Region for the request | ap-beijing |
4 | eventTime | Event time (end time of the request, which is a timestamp in UTC+0 time zone) | 2018-12-01T11:02:33Z |
5 | eventSource | Domain name to be accessed | examplebucket-1250000000.cos.ap-guangzhou.myqcloud.com |
6 | eventName | Event name | UploadPart |
7 | remoteIp | Source IP address | 192.168.0.1 |
8 | userSecretKeyId | Key ID for access | AKIDNYVCdoJQyGJ5brTf |
9 | reqBytesSent | Number of bytes in the request | 83886080 |
10 | deltaDataSize | Change in storage made by the request (in bytes) | 808 |
11 | reqPath | File path for the request | /folder/text.txt |
12 | reqMethod | Request method | put |
13 | userAgent | User agent (UA) | cos-go-sdk-v5.2.9 |
14 | resHttpCode | HTTP return code | 404 |
15 | resErrorCode | Error code | NoSuchKey |
16 | resErrorMsg | Error message | The specified key does not exist. |
17 | resBytesSent | Number of bytes in the response | 197 |
18 | resTotalTime | Total time consumed for the request, which is the time between the first byte of the request and the last byte of the response, in milliseconds | 4295 |
19 | logSourceType | Type of the log source | USER (user access request) and CDN (CDN origin-pull request) |
20 | storageClass | Storage class | STANDARD, STANDARD_IA, and ARCHIVE |
21 | accountId | Bucket owner ID | 100000000001 |
22 | requester | Requester account | The value is in the format of root account ID:sub-account ID. In case of an anonymous access, the value is shown as -. |
23 | requestId | Request ID | NWQ1ZjY4MTBfMjZiMjU4NjRfOWI1N180NDBiYTY= |
24 | objectSize | Object size, in bytes | 808. If you use multipart upload, the objectSize field will be displayed only when the upload is completed. During the upload of each part, the field will be displayed as -. |
25 | versionId | Object version ID | Random string |
26 | targetStorageClass | Target storage type, which is recorded for any replication request | STANDARD, STANDARD_IA, and ARCHIVE |
27 | referer | HTTP referer of the request | *.example.com or 111.111.111.1 |
28 | requestUri | Request URI | "GET /fdgfdgsf%20/%E6%B5%AE%E7%82%B9%E6%95%B0 HTTP/1.1" |
29 | resTurnAroundTime | Time consumed by the request server, which is the time between the last byte of the request and the first byte of the response, in milliseconds | 4295 |
30 | vpcId | VPC Request ID | "0": non-VPC; "12345": VPC, which is a non-zero string |
Common Examples
A few commonly used examples are provided below. More cases will be added later. Please stay tuned for product updates. For more information, see Examples.
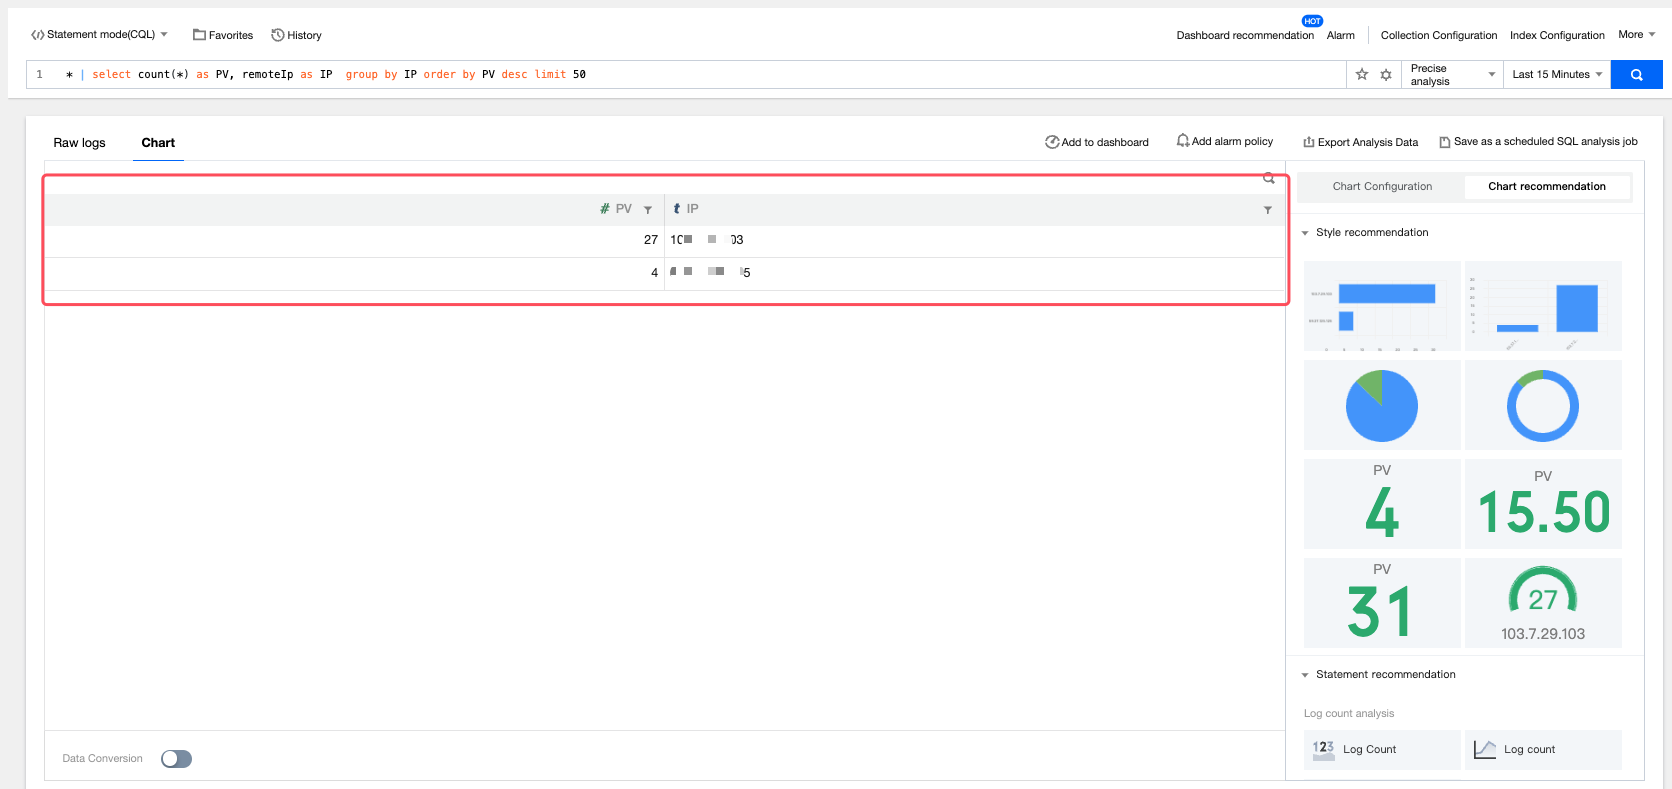
Example 1: Top 50 IP Addresses by Traffic Volume
1. Select Statement mode(CQL) and enter the following SQL statement:
* | select count(*) as PV, remoteIp as IP group by IP order by PV desc limit 50
count(*) as PV: Counts all log entries, which is PV.group by IP: Groups by IP, counting the PV for each IP.order by PV desc: Sorts by PV in descending order, prioritizing IP addresses with high PVs.limit 50: Only returns the top 50 query results, which are the IP addresses with the top 50 high PVs.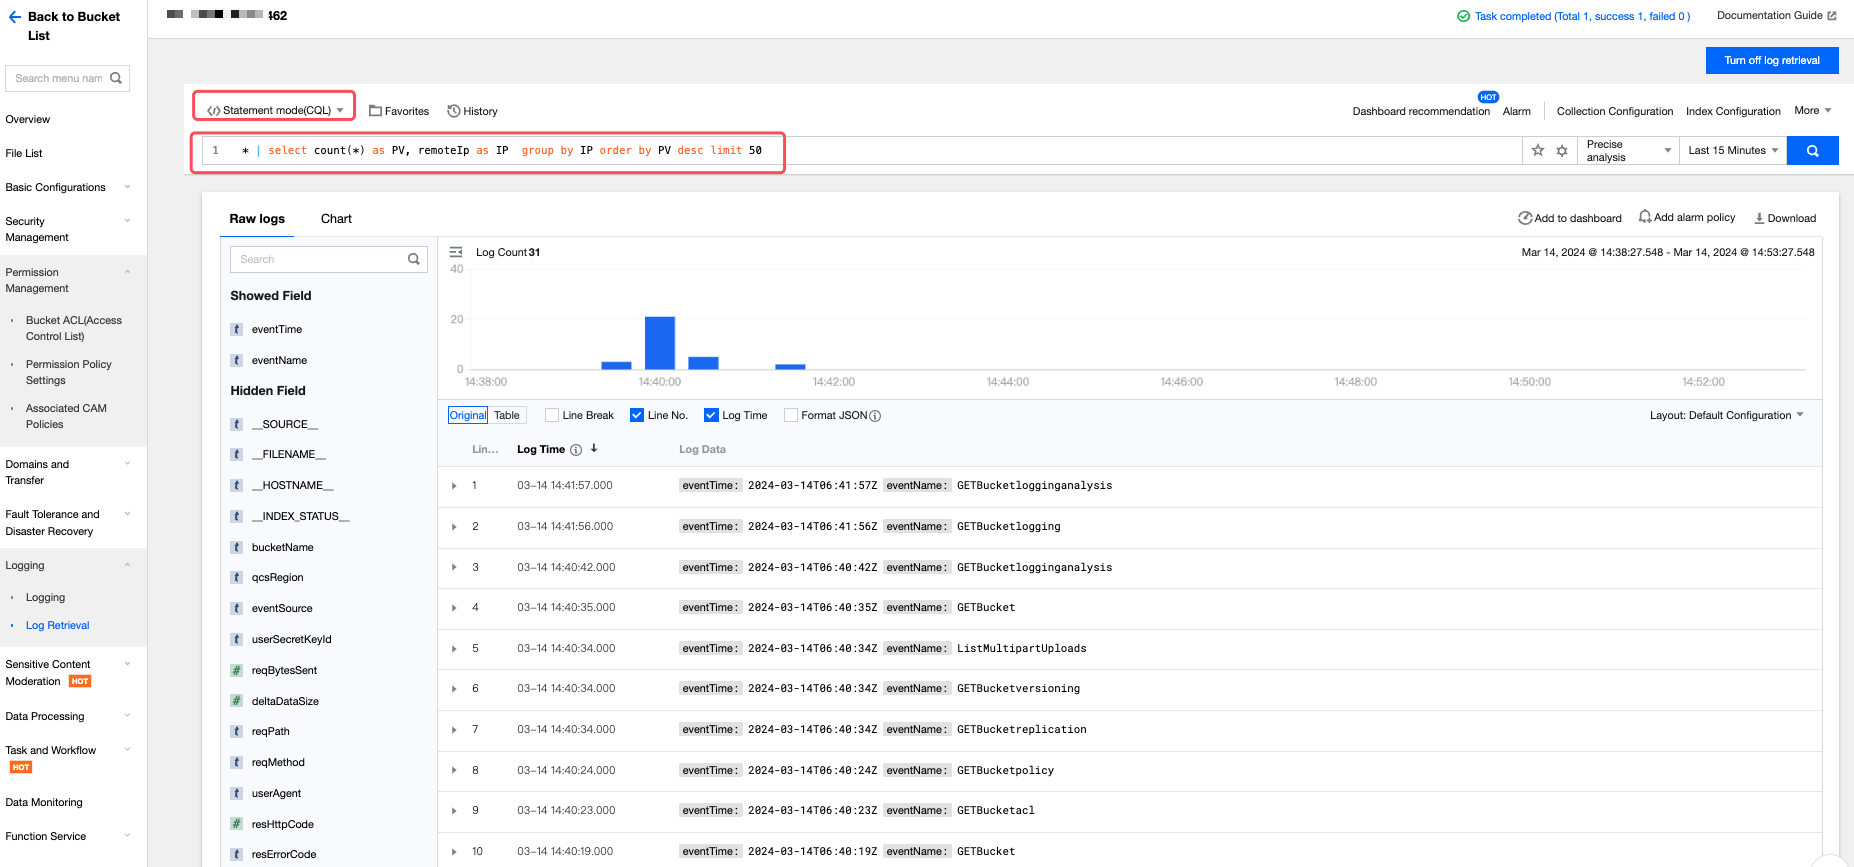
2. Select the time range and click Search. On the statistical analysis page, view the analysis results. You can switch chart types on the right side.
3. If the query statement fails to run, check the error location specified in the error message. For more information about error reasons, see Search Analysis Error.
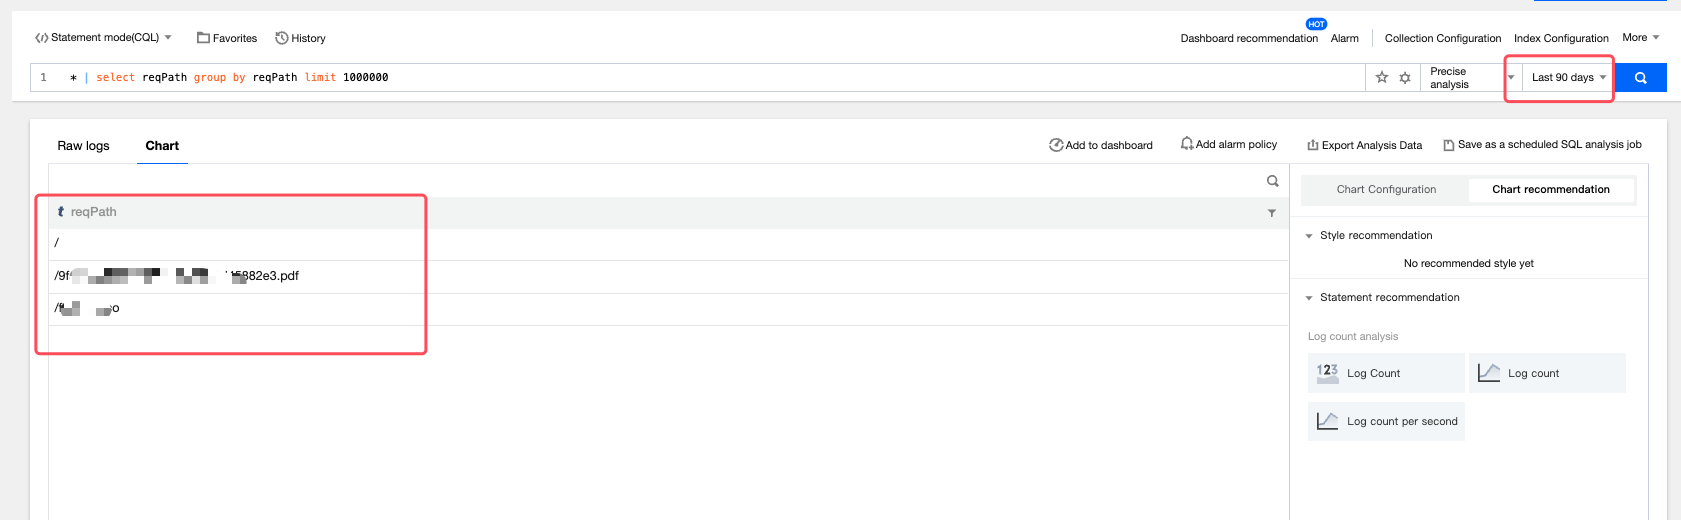
Example 2: Querying Files of Access Within Recent 90 Days
1. Select Statement mode(CQL) and enter the following SQL statement:
* | select reqPath group by reqPath limit 1000000
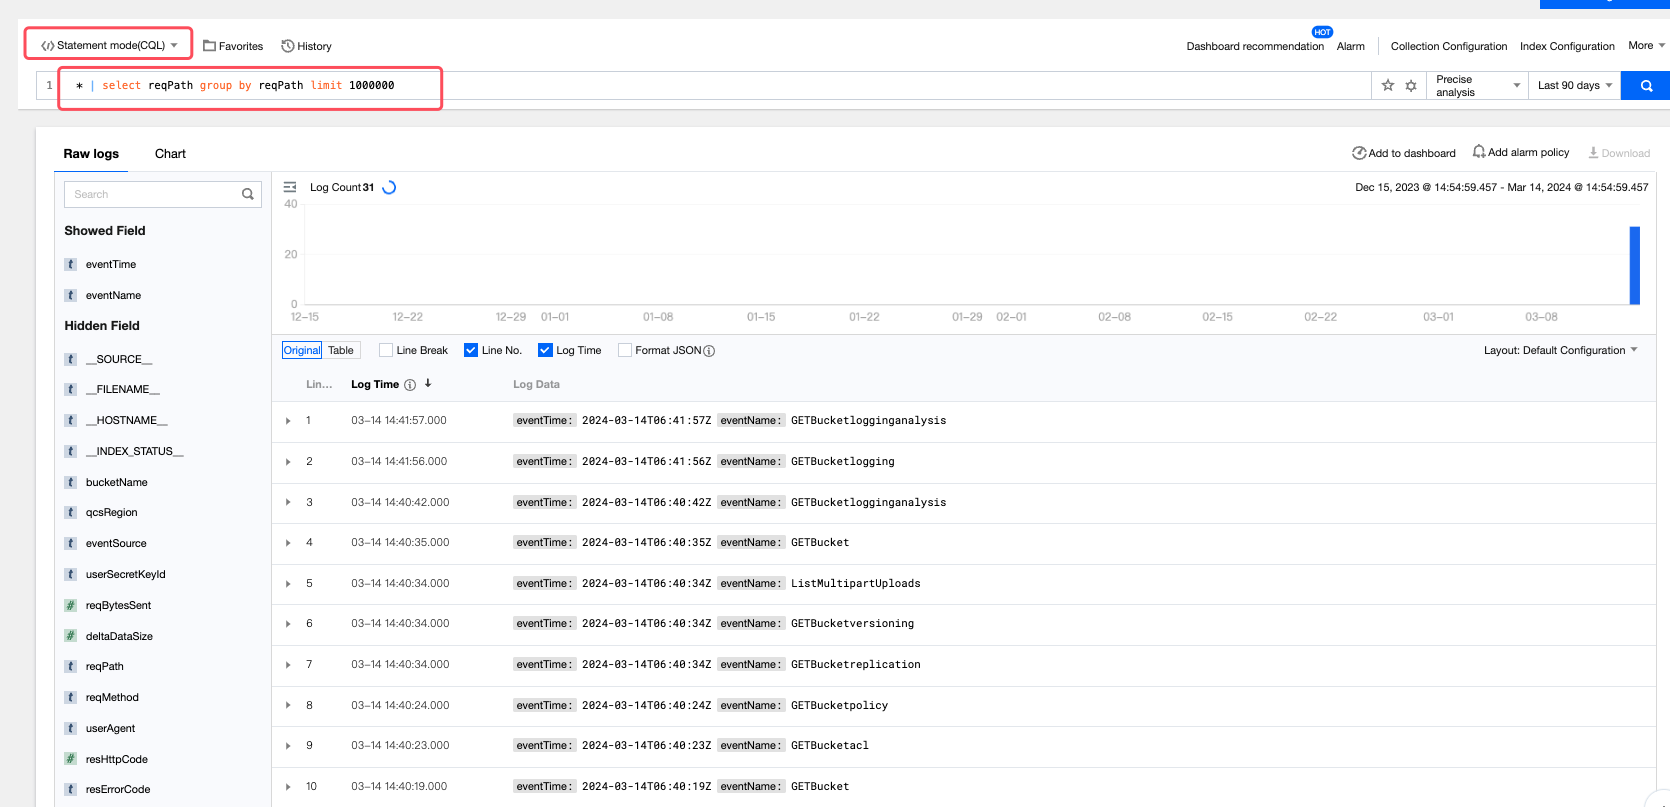
2. Set the time range to the recent 90 days and click Search. On the statistical analysis page, view the analysis results. You can switch chart types on the right side.
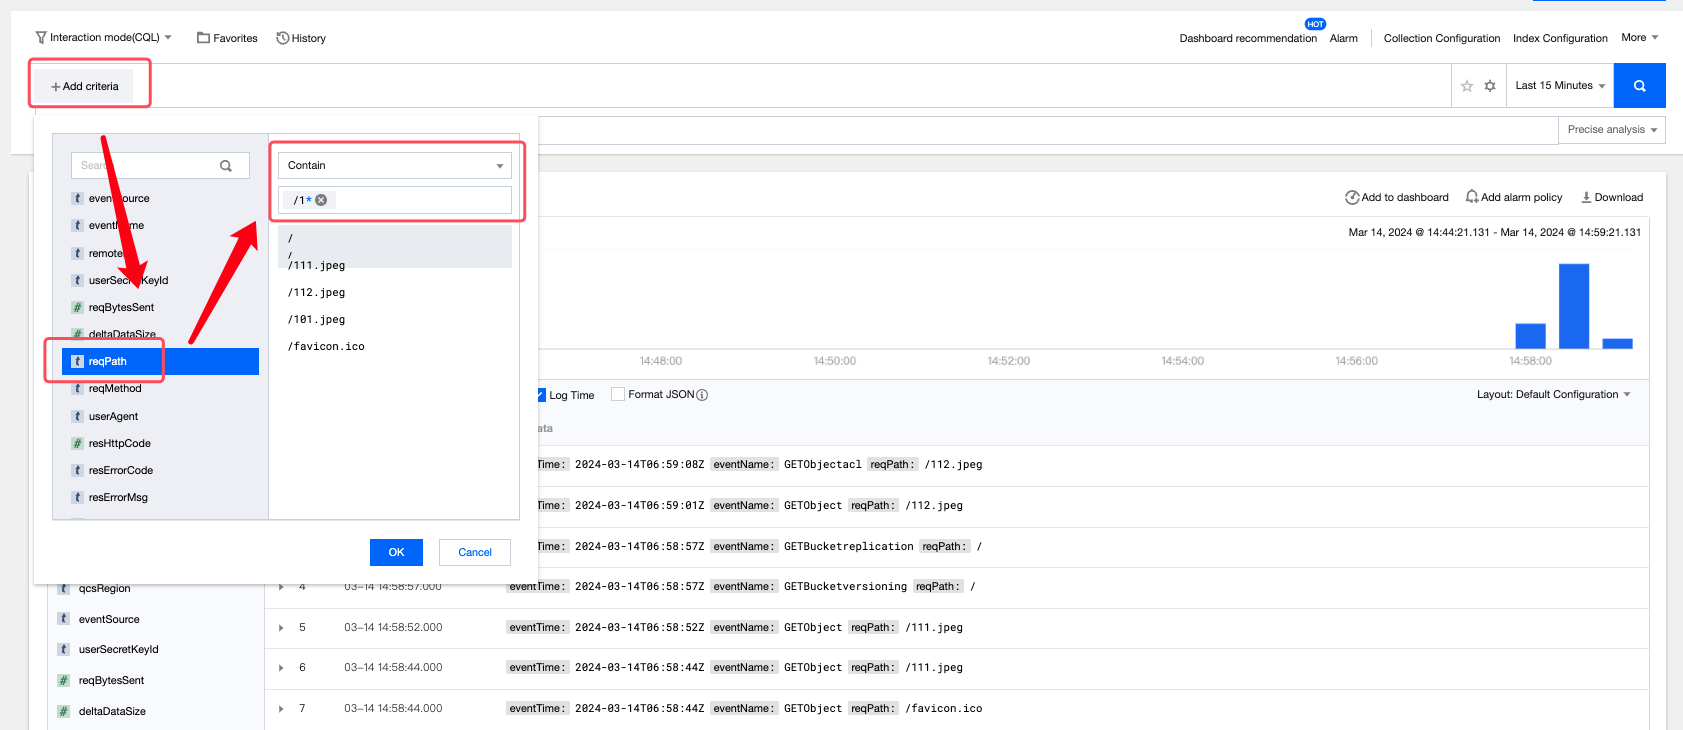
Example 3: Counting Requests, Traffic, and Storage for Specified Prefixes
For example, all the following files within the bucket generate log requests. You may desire to count the requests, traffic volume, and storage volume for objects prefixed with 1(that is, the objects with file paths "/111", "/112", and "/101").
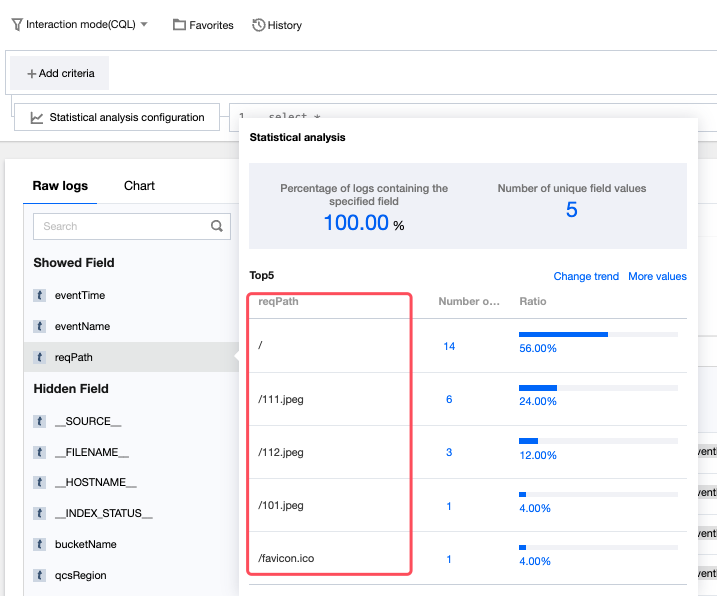
Note:
Object traffic: Total number of object bytes returned for log requests.
Object storage volume: Sum of object sizes (objectSize) in log requests, excluding "-". For more information, see Log Field Description.
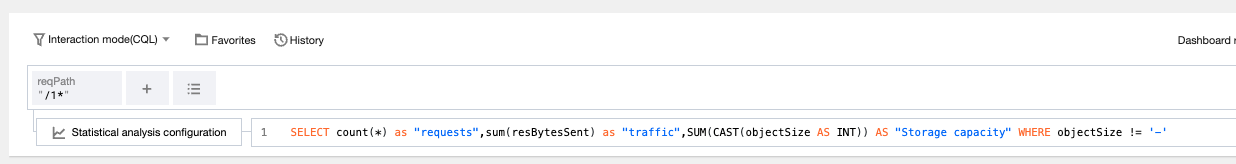
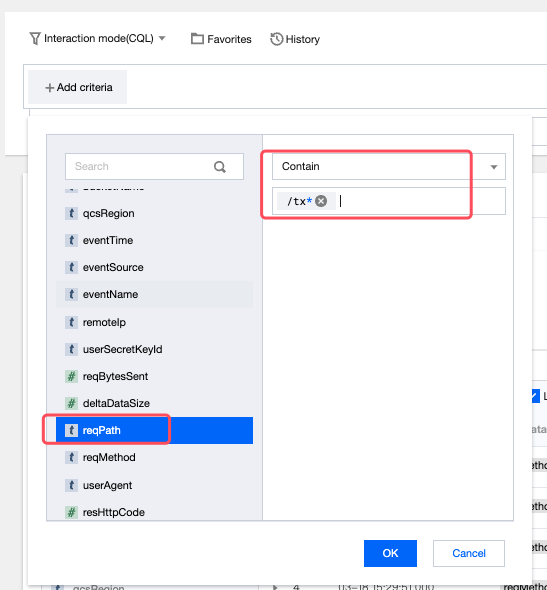
1. Select Interaction mode(CQL), click Add criteria, specify reqPath to contain /1, and set the time range to filter object request logs prefixed with 1, where is a wildcard.
2. Enter the following statement in the input box:
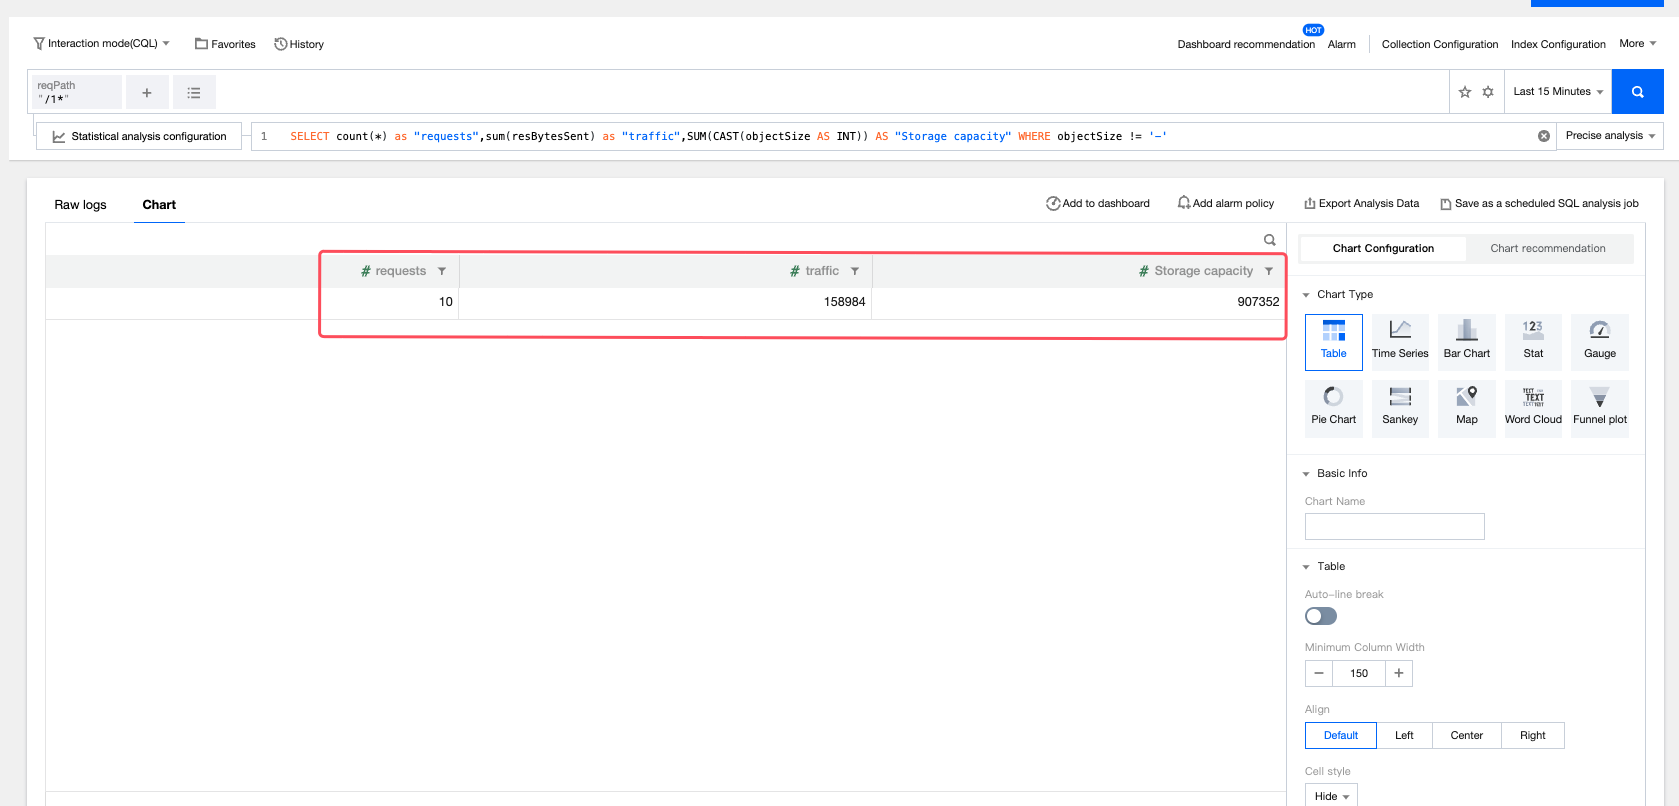
SELECT count(*) as "Number of requests", sum(resBytesSent) as "Traffic volume", SUM(CAST(objectSize AS INT)) AS "Storage volume" WHERE objectSize != '-'
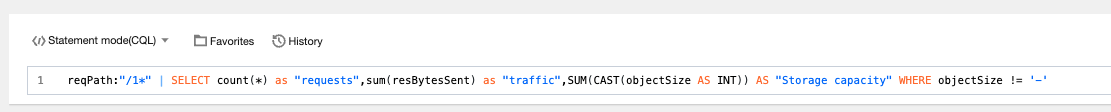
3. Alternatively, select Statement mode(CQL) in Step 1 and directly enter the following SQL statement:
reqPath:"/1*" | SELECT count(*) as "Number of requests", sum(resBytesSent) as "Traffic volume", SUM(CAST(objectSize AS INT)) AS "Storage volume" WHERE objectSize != '-'
4. Select the time range and click Search. On the statistical analysis page, view the analysis results. You can switch chart types on the right side.
Example 4: Locating Reasons for File Access Failure
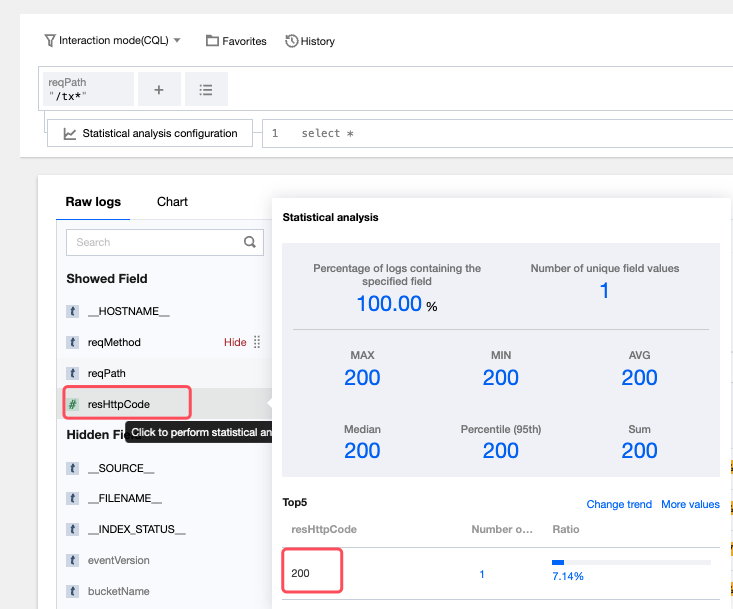
1. Select Interaction mode(CQL) and click Add criteria. Specify the target file name, select the Time range and click Search.
2. Click the field name on the left, enable quick analysis, and conduct statistical analysis based on the resHttpCode field. View log information of error codes, such as 403 and 204.
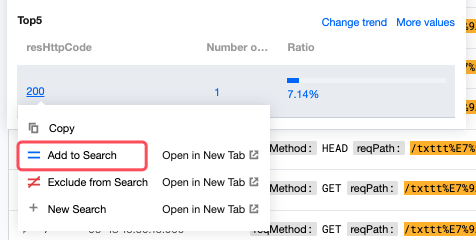
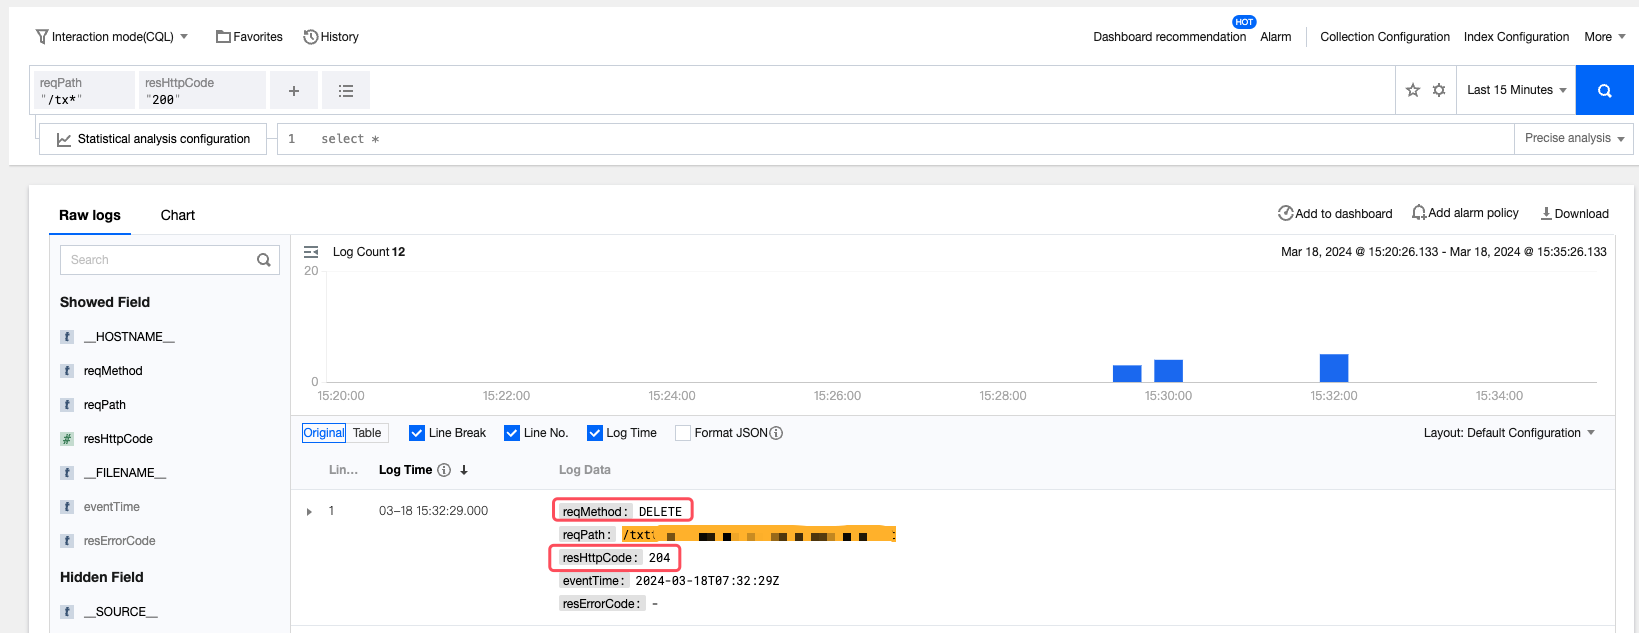
3. Click an error code and choose Add to Search to filter the logs. In the log details, view information about other fields, focusing on the fields such as reqMethod. The figure below shows that the delete operation is performed on the file, resulting in object access failure.
Help and Support
Was this page helpful?
You can also Contact sales or Submit a Ticket for help.
Help us improve! Rate your documentation experience in 5 mins.
Feedback